TUNER SPECIFICATIONS
RADIO TUNERS ARE COMPOSED of two main sections: that which processes the 'radio' (or r.f.) signal and that which handles the subsequently extracted audio (or d.f.) signal. Although the first section can have some (subtle) influence on the audio signal passed to the partnering hi-fi amplifier, the second section is generally more exacting in this respect.
R.F. Section
The first section mainly determines how well (or otherwise) the tuner will behave under different reception conditions : for example, how well it will receive weak signals for a stated background noise ('hiss') and hence signal to-noise (S/N) ratio. It also determines how well it will accommodate weak signals from the aerial in competition with a multiplicity of strong ones simultaneously present ; also how well it will separate a weak signal from a stronger one on a near frequency (selectivity). Most things like this are handled by the 'radio' section.
A.F. Section
After the 'radio' signal has been processed, the resulting weak audio signal needs to be amplified to a level suitable for application to the radio or tuner input of the hi-fi amplifier. The stereo multiplex signal , also present with the 'mono' audio signal at the detector output of the first section, is decoded in the second section. This is handled by the stereo decoder, which delivers separate left and right channel audio signals.
The second section of a stereo tuner thus has an audio amplifier for each channel . Other things also happen in the second section, including the required FM de-emphasis and the filtering of unwanted sub-channel spurious signals which are inevitably produced during the decoding process. Distortion, stereo separation, frequency response and to some extent the noise background on a stereo program are thus influenced by the parameters of the second section of an f. m. tuner .
Difficult Reception Areas
Provided the 'signal' conditions where a tuner is operated are not unduly 'difficult' or abnormal , then it is possible to achieve valid hi-fi reproduction from a tuner whose first section is below the ultimate requirements for very 'difficult' reception areas ; that is, of course, provided the parameters of the second section satisfy the hi-fi requirements.
However, such a tuner may not give very good results from 'weak' aerial signals, particularly in areas where the tuner is expected to work in competition with very strong signals from nearby transmitters. Nevertheless, for good quality reception in many areas it is not always essential to spend out on a tuner whose first section is engineered to the pinnacle of the art.
If you are interested in receiving only the 'local' stations at top quality, then look for a tuner with good second section parameters. On the other hand, if you are in a 'difficult' reception area or like tuning stations outside the service area you will also need to study the first section parameters . Sadly, parameters of tuner specifications rarely make clear whether they are related to the first or second section. What we propose to do, therefore, is to divide the list of tuner parameters into two sections , the first relating to the 'radio' performance and the second to the audio or 'sound' performance.
Such a parameter list is given below.
'Radio' Parameters
Sensitivity for 30dB S/N mono: 1 ·51' V for 50dB S/N mono: 51'V for 50dB S/N stereo: 50 I' V
Limiting -1dB: 21'V 3rd-order intermodulation: 68dB
Equivalent front-and selectivity: 46dB
Repeat spot suppression ratio: 86dB IF rejection ratio: 90dB
Image response rejection ratio: 70dB
Capture ratio: 2dB
Selectivity
±200kHz: 5dB
±400kHz: 60dB
S/N ratio 1mV
mono: 70dB stereo: 67dB
AM rejection ratio: 60dB
Hum: 70dB
Pilot tone rejection ratio: 50dB
Distortion 100% modulation mono: 0·2% stereo: 0.4%
Audio Parameters
Frequency response ref. 1kHz 20Hz: -3dB 15kHz: -1dB
Stereo separation 1kHz: 35dB 10kHz: 25dB
Distortion on breakthrough signal : 20%
Birdies interference rejection ratio: 60dB
Some of these may appear to be rather technical; but don't despair ! You may also see some parameters on our list which are not included in the manufacturers' specifications . We shall explain these.
Sensitivity
Tuner sensitivity is stated as the strength of the aerial signal required for a given background noise ('hiss'). With an FM tuner, as the aerial input signal strength is increased so the background 'hiss' falls. The intensity of the 'hiss' is compared with the intensity of a single tone audio signal corresponding to full modulation level , called 100% modulation level . Thus, if the noise is, say, ten times less than the actual signal we could say that at that particular aerial input the S/N ratio is 10: 1. It is general practice, though, to translate the ratio to a dB ratio. A signal voltage (noise or audio signal) ratio of 10: 1 is 20dB (see, for example, page 38 in Pickups and Loudspeakers). The dB ratio is better than a direct ratio because it is logarithmic and thus correlates to the way that we hear.
Sensitivity for 30dB S/N ratio, therefore, merely gives the aerial signal required for the noise to be 30dB (3 1 .62: 1 voltage ratio) below 100% modulation. To get the noise to fall to 50dB (3 16.2: 1 voltage ratio) below full modulation a larger aerial input is required. You will notice that the aerial input required for a 50dB S/N ratio is greater for stereo than mono. This is due to the extra bandwidth and noise produced by the decoding action.
For hi-fi listening the S/N ratio should be, at least, 60dB in both stereo and mono modes, so although the 30dB and 50dB ratios give a good impression of the 'absolute' sensitivity of a tuner, you will require to feed the tuner with a greater aerial signal to cut the noise further.
The S/N ratio, later defined, lets you know how low the noise is when the aerial input is 1mV. Incidentally, 11-1V (microvolt) is one-millionth of a volt and 1-mV (millivolt) one-thousandth of a volt or 1,0001-'V. You can get tuners with a 30dB mono S/N ratio as low as 0 · 81-1 V, but the average is round 1· 51-'V. The average f. m. tuner has a 50dB S/N ratio of about 51-' V mono and 501-' V stereo. There is generally a 10: 1 voltage difference between the two modes, meaning that for stereo you need 20dB more aerial signal than for mono to provide 50dB S/N ratio. This difference diminishes with increasing aerial signal.
Limiting -1 dB If we now exclude the noise and look only at how the audio output from the tuner rises with increasing aerial signal we can assess the limiting. When the modulated aerial signal strength arrives at a certain value the audio output from the tuner no longer rises . It remains at a steady level . The value of signal required for this is called the full limiting signal . Since the rise towards full limiting occurs very slowly to the nth degree, the aerial input to provide an audio output which is 1 dB below full limiting is often quoted. This is called -1 dB limiting aerial input . The average f. m. tuner has a -1 dB limiting input close to the input required for 30dB mono S/N ratio.
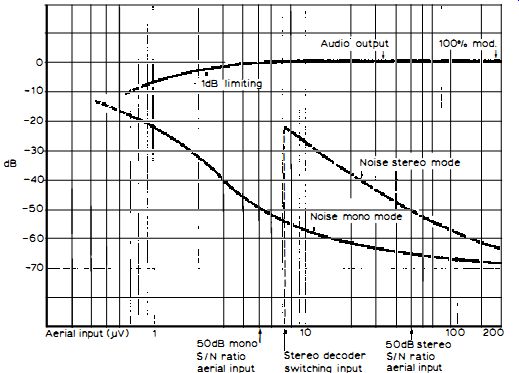
Fig. 3.1: Curves showing the parameters of limiting and mono and stereo
S/ N ratios.
If you are interested in receiving weak signals and in long-distance (DX) reception, where the signal is likely to be weak and fading (rising and falling in strength), then you should certainly look for a tuner whose -1 dB limiting occurs at the lowest possible aerial input. If the limiting comes on at a too high aerial input , the strength of the audio signal fed to the amplifier will rise and fall in sympathy with a signal fade or the level will be different between stations of different strength.
The curves in Fig. 3.1 summarize the points so far discussed.
3rd-order IM (RFIM)
An FM aerial responds to all the signals present in the v.h.f. (very high frequency) FM band (called Band 11) and possibly other signals outside the band. It is the job of the first stages of the tuner to select the required signal.
This selection happens progressively as the aerial signals pass through the front-end.
As with an amplifier, there is a limit to the strength and number of signals that can be handled by the front-end linearly. A multiplicity of relatively strong signals, depending on the large-signal handling ability of the front end, can cause overloading. When this happens intermodulation products are generated. These are spurious signals which are not actually picked up by the aerial but which are created in the tuner circuits, and once they have been created they cannot be eliminated.
The frequencies of these signals are related to the frequencies of the signals from the aerial in a rather complex way. For example, if the tuner is receiving simultaneously signals at , say, f1 = 94MHz and f2 = 95MHz, then a spurious signal at 2f2 –f1 = 96MHz and another at 2f1 -f2 = 93MHz can result . These are called 3rd-order intermodulation (IM) products . With more than two signals, the interactions become much more complicated. The products could, of course, interfere with the wanted signals. With the three frequencies of a station group of f2, f3 and f4, corresponding to Radios 2, 3 and 4 on, say, 89.1 MHz, 91.3MHz and 93.5MHz respectively (e.g., the Wrotham transmitter), 3rd-order IM can give rise to a spurious signal at f2+f4-f3 which, if you work it out, you will find falls right on top of the Radio 3 signal at 91 · 3MHz. A tuner of poor 3rd order IM performance could thus give interference on Radio 3.
When the measurement is made, the strength of two signals applied to the tuner for a 30dB interference ratio is determined and is referred to the strength of the signal required for the ordinary 30dB S/N ratio in terms of a dB ratio. Thus the greater the dB figure of the 3rd-order IM parameter, the greater the immunity the tuner has to this sort of interference.
Unfortunately, few manufacturers' specifications carry this parameter in spite of its great importance; but tuner and receiver reviews under the names of John Earl and our associated company Gordon J. King (Enterprises) Limited appraise this aspect of tuner performance by a consistently used method of measurement, allowing ready comparisons . With our measurement, an average value would be about 58dB; the ratio of a poor tuner in this respect would be round 30dB and a top-flight tuner 70dB or more.
Again, if you are interested in DX-ing and/or live in an area where the local signals are very strong, you should look for a tuner with an average, at least, 3rd-order IM dB ratio.
Equivalent Front-End Selectivity
The required signal of the multiplicity of signals delivered by the aerial is selected in the tuner front-end by variable-tuned circuits operated by the tuning control knob or, perhaps, push-buttons . Selection is never one-hundred percent sharp. This means that when a particular station is tuned in, signals either· side of it will produce a front-end response. The degree of this response at frequencies either side of the tuned frequency is determined by the overall selectivity of the front-end.
The more variable-tuned, ganged circuits there are, the better the selectivity and hence the greater the discrimination given to unwanted side-frequency signals. If the selectivity is poor, this will not necessarily mean that you will be plagued by adjacent-frequency stations breaking through to the required one.
This mode of discrimination is handled in the i.f. stages, and is appraised under 'selectivity' . What it does mean, however, is that the front-end circuits likely to produce 3rd-order IM will be receiving a higher level of signals either side of the tuned signal , thereby increasing the probability of interference due to 3rd-order IM. Therefore, for DX-ing and for difficult reception areas it is desirable for the tuner to have a relatively high value of front-end selectivity. This is another parameter not present in the manufacturers' specifications . Our lab, however, has devised a method of determining the equivalent front-end selectivity ('figure of merit' -- see Wireless World February 1975), and as we use this consistently in our reviews and reports you can easily compare tuners in this respect . The more tuned circuits there are, the greater the dB number. The average value is 40dB, a relatively poor value 30dB and a top-flight value 70dB or more. It is noteworthy that the measurement also assesses the 2nd-order IM performance of a tuner .
Repeat Spot Suppression
Tuners suffer other spurious responses in addition to those already considered. One reason for this is that a superhet receiver uses a local oscillator, whose tuning is ganged to the signal variable-tuned circuits, to provide the intermediate-frequency (i .f.) signal . Normally, the i.f. is produced by the local oscillator tracking the signal frequency as the tuning is adjusted by a frequency which is always the i.f. above the signal frequency (fs) - in a few cases the oscillator runs at the i.f. below fs . Thus, if the tuner is set to 95MHz and the i.f. is 10.7MHz (the standard for FM tuners and receivers) , then the oscillator will be running at 95+10.7MHz, or 105.7MHz.
By various means , signals at frequencies other than 95MHz could 'mix' with the oscillator signal (fo) to yield the i.f. One condition is when fo has a 2nd harmonic component which, at the 95MHz tuning point, would fall at 21 1.4MHz. Now, if there happens to be a strong signal at 100 · 35MHz also arriving at the tuner , a transistor in the front-end could run into non-linearity and from this produce a 2nd harmonic at 200.7MHz.
We would then have the 2nd harmonic of fo at 211.4MHz and the 200.7MHz 2nd harmonic of the 100 - 35MHz signal , the difference being exactly 10.7MHz, corresponding to the i.f. The 100.35MHz signal could thus cause interference or generate a spurious response. This is called the repeat spot response or the half-i .f. response because the signal causing the trouble is half the i.f. (5.35MHz) away from the tuned frequency.
This is another parameter which is rarely given in the manufacturers' specifications . It is given, however, in our own reviews and test reports, measured consistently for comparison purposes. The dB ratio of this parameter should always be high, an average value being round 80dB. A tuner whose front-end tends to overload early or whose local oscillator has a relatively high 2nd harmonic yield may return a ratio not much higher than 60dB. On the other hand, the ratio from a top-flight tuner could be greater than 100dB. The highest ratio possible, consistent with tuner price, should be selected for DX-ing and 'difficult' reception areas . IF Rejection Ratio This parameter indicates the susceptibility of the tuner to a signal arriving at the aerial at the i.f. It is a function of the front-end selectivity and is superseded by the more meaningful equivalent front-end selectivity measurement.
Where it is found in specs , the value should be as high as possible -80dB or more.
Image Response Rejection
This is another spurious response. If we take the case of a tuner adjusted to 95MHz and the oscillator running at 105.7MHz, then the i.f. is produced also from an aerial signal of 105.7+10.7MHz, or 11 6.4MHz. This is the image or 'second channel' response. Again, the response is determined by the front-end selectivity - the higher the selectivity the greater the response dB ratio.
Look for a tuner with a response dB figure greater than 50dB, which is about the average for hi-fi tuners . You will also see specs where the parameter is up to 100 dB, but these are applicable to the more costly models.
You will find that a tuner with a high dB figure front-end selectivity will also have a high image response dB figure. Our lab elects to measure the equivalent selectivity rather than the image response ratio.
Capture Ratio
This parameter is applicable only to the FM system of broadcasting. An FM tuner has the ability to virtually reject a signal which is a little weaker than the wanted signal, even when the two signals fall at exactly the same frequency.
This is called the 'capture effect'. There is no a.m. equivalent . The capture ratio gives an indication in dB as to how much stronger the wanted signal needs to be referred to the unwanted signal on the same frequency for a 30dB interference ratio. An average value is round 3dB. A value round 5dB would be regarded as 'poor' for a hi-fi tuner . Expensive tuners and FM receivers often boast a ratio as small as 1 dB or less. You will see, therefore, that the smaller the dB number in this case, the better the capture ratio.
A tuner with a small dB number capture ratio is highly desirable in areas where hills, large buildings, etc. cause signal reflections . It is well known that on TV, reflected signals produce ghost images to the right of the main image.
On FM the reflections cause harmonic distortion which increases in severity with increase in modulation; they are also responsible for impaired results on stereo.
The reflected signal (or signals) arrives a fraction of a second after the main, direct-route signal . Thus, a tuner with a good capture ratio helps to suppress the effects of the reflected signal(s) . Selectivity The output of the front-end is at the i.f. The i.f. signal is amplified by transistors and/or integrated circuits (ICs) within a carefully controlled bandwidth. Tuned circuits and ceramic or 'surface acoustic wave' (SAW) filters at a fixed frequency provide the required selectivity (bandwidth) characteristics.
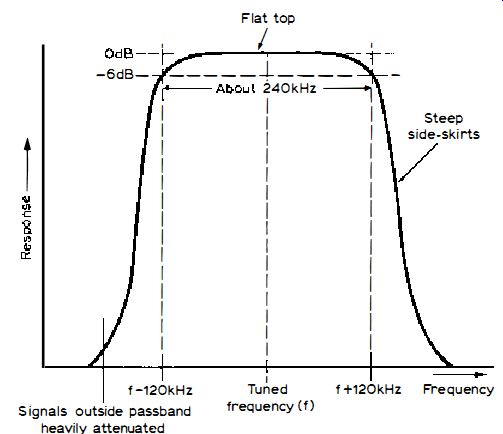
Fig. 3.2: Bandpass characteristics of i.f. channel.
For high modulation level stereo signals the effective bandwidth needs to be round 240kHz if distortion is to be avoided. However, the side-skirts of the bandpass shape need to be very sharp to reduce the response to side-frequency signals (see Fig. 3.2). The filters also need to be designed for small group delay for the best results.
The selectivity is evaluated at side frequencies of ±200kHz (adjacent channel) and ±400kHz (alternate channel), the results being dB numbers indicative of the selectivity ratios . The phase distortion and group delay are shown up in the audio section parameters - 100% modulation distortion, stereo separation, etc.
The average alternate channel selectivity ratio is round 50dB for a hi-fi tuner. Tuners with less exacting i.f. stages may have ratios down to about 30dB, while top-flight designs sometimes boast ratios as high as 50dB or more. The adjacent channel selectivity ratio is obviously much smaller, sometimes being less than 4dB or even a negative value (based on a 30dB interference ratio using two test signals) . A high selectivity ratio is required for DX-ing and for use in areas where relatively powerful signals are present in adjacent or alternate channels (a channel width is 200kHz) referred to the wanted signal . However, if the bandwidth is cut too much in favor of higher selectivity ratios, the sound quality can suffer.
Some tuners are equipped with switchable bandwidth, the narrow setting and correspondingly high selectivity ratio being used for seeking out weak stations close to powerful ones and the wider setting for the best quality reproduction of the 'local ' service area stations . A tuner with an alternate channel ratio round 50 -60dB has a fairly reasonable all-round application.
That, then, concludes the 'radio' section parameters . You will have noticed that some of these reflect into the audio side; but shortcomings in this respect are highlighted in the audio parameters themselves, which we shall now study.
S/N Ratio 1 mV
To a certain limit, the greater the aerial input applied to an FM tuner, the greater becomes the S/N ratio. A fairly typical signal strength is 1m V, so it is logical to measure the mono and stereo S/N ratios with an aerial input of this level . Again, the signal part of the ratio corresponds to 100% modulation level (e.g., ±75kHz deviation mono and ±67.5kHz audio deviation plus ±7.5kHz pilot tone and sub-carrier deviation stereo) . The stereo ratio is always less than the mono ratio because the actual audio of a stereo signal is about 1 dB less than the full modulation audio of a mono signal and also because of the extra noise produced by the stereo decoding.
Noise weighting
Before the noise is put into the S/N ratio it is subjected to a 'weighting'. Noise components are wideband, and the components in certain parts of this wideband are more subjectively annoying than components in other parts. It would be illogical, therefore, to include all the wideband components in the S/N ratio.
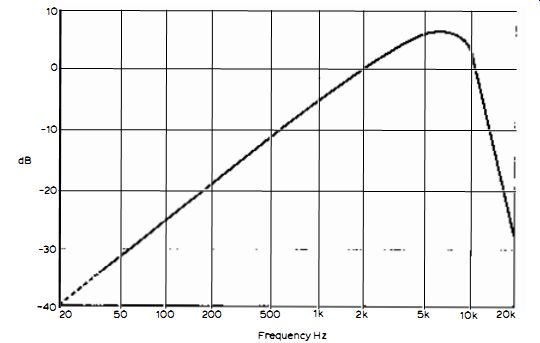
Fig. 3.3: CCI R/ ARM weighting characteristic.
We all know, for example, how irritating a two-stroke motor bike engine can be. On the other hand, the noise produced by a powerful car engine is far more acceptable; yet the wideband noise readings of the two might well be identical! In general, middle- and upper-middle-to-high-frequency noise is more irritating than low-frequency noise and hum. Very high-frequency noise, of course, is not audible, anyway.
The weighting, therefore, constitutes a filter which gives more prominence to the noise components (frequencies) which annoy most and less prominence to those which annoy least . A variety of networks have been evolved over the years for noise weighting, and that favored by our lab is known as the CCIR characteristic. For the evaluation of broadcast and 'professional ' equipment the 0-dB reference of the curve is set to 1kHz and a quasi-peak responding meter used to measure the noise (CCIR recommendation).
CCIR/ ARM Characteristic
For the evaluation of consumer equipment, such as hi-fi, the reference is sometimes set to 2kHz and an average responding meter (ARM) used to measure the noise. This is known as the CCIR/ ARM characteristic (Fig. 3.3). This configuration is recommended by the Dolby labs, who are working to establish it as a standard.
The difference between the 1kHz and 2kHz reference is essentially one of zero calibration only. With any given meter, the S/N ratio measured with the 2kHz reference will be approximately 6dB greater than that measured with the 1kHz reference. The type of meter also affects the noise reading. For example, an ARM reads about 11 % lower on gaussian noise than a true root mean square (r.m.s.) meter, so the S/N ratio measured with the former type of meter will be about 1 dB higher than the ratio measured with the latter type meter.
Using the CCIR/ ARM characteristic, the average mono S/N ratio at 1-mV is about 74dB and the average stereo ratio about 67dB. Tuners with mono and stereo ratios respectively as high as 83dB and 76dB have been measured. A stereo ratio much less than 62dB with this weighting would be pretty poor. In the stereo mode, the tuner's output also includes pilot tone signal and residual sub-channel signals . These must be filtered out separately before the stereo noise is read.
The curves in Fig. 3.4 show how the mono and stereo S/N ratios tend to increase slightly with increasing aerial signal above 1 mV. It should also be noted that noise weighting is used to assess the S/N ratios of amplifiers (see Section 2).
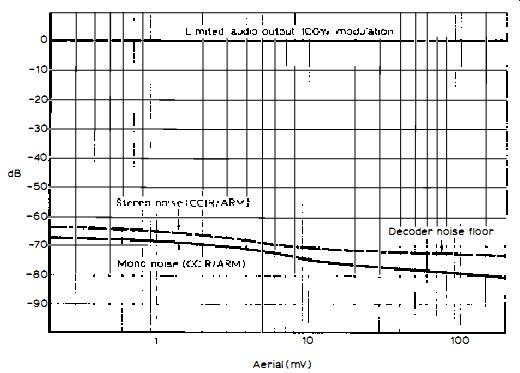
Fig. 3.4: Mono and stereo S / N ratios (CCIRI ARM weighted) at high aerials
inputs showing the 1 m V S/N ratios.
AM Rejection Ratio
FM tuners and receivers should be essentially unresponsive to a.m. signals, and as impulsive interference is of an a.m. nature, FM equipment should be bothered less by electrical interference than a.m. equipment. This also applies
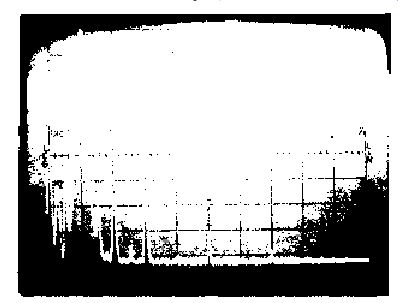
Fig. 3.5: Distortion spectrogram showing hum components at the left of
the 20Hz 100% modulation signal . Scale 10 dB/ div. vertically and 200Hz/
div. Horizontally to 'beats' (whistles) of two signals . This , indeed,
is one of the aspects of the capture effect . The a.m. rejection ratio
is usually measured with the aerial signal amplitude modulated to a depth
of 30%, this then being referred to the 100% FM output . The measurement
is made on constant tone modulation of 400Hz or 1kHz. The average tuner
has a ratio round 60dB when the aerial input is 1-mV. A poor value would
be 40dB and an excellent value 70dB. Unfortunately, the immunity to impulsive
interference may be less in practice than promised by the constant tone
test.
Hum
When CCIR weighting is used to measure noise, the curve in Fig. 3.3 shows that the attenuation at the mains frequency of 50Hz is greater than 30dB. This means that the noise reading does not give a true measure of the mains frequency hum or its harmonics.
A better assessment of hum is achieved by measuring the noise with the weighting switched out . However, to measure the hum completely independently of the noise requires the use of a wave or spectrum analyzer. The hum fundamental and the harmonics of the hum can then also be assessed.
The spectrogram -(from a spectrum analyzer) in Fig. 3.5 shows a 200Hz tone corresponding to full modulation peaking at 0dB (the top horizontal line datum) and to the left of this the hum fundamental and harmonics. In this case the harmonics and fundamental are down about -60dB. The components at the right of the 200Hz driving signal are distortion harmonics.
Sometimes a tuner tends to produce more hum when it is actually tuned to a station. This is called modulation hum, and the test revealed in Fig. 3.5 also A good response, even with a 10kHz filter fitted, should not be much worse than -1 to -1 · 5dB at 14kHz with respect to the response at 1kHz, and not much more than 1 to 2dB down at 20Hz.
The sweep oscillogram shown by the upper trace in Fig. 3.8 is scaled at 1dB per vertical division and the sweep is logarithmic from 20Hz to 43kHz. This shows the response at -0.5dB at 20Hz and -1dB at 14kHz, which is acceptable. The response then falls rapidly into the 19kHz pilot tone notch (see caption for frequency scaling). The accuracy of response is determined by the design of the de-emphasis in conjunction with the 19kHz filtering. Some designers are able to secure better results than others.
Stereo Separation
The lower curve in Fig. 3.8 is scaled at 10dB per division vertically and shows the amount of crosstalk in the non-speaking channel (e.g., stereo separation) . Here we see that the separation remains round 40dB over all the spectrum, which is excellent.
It will be understood, of course, that good separation is required for the best stereo effect . However, in addition, poor separation can lead to greater overall distortion than may be expected from the speaking channel distortion figures owing to the intrinsically high level of distortion on the breakthrough signal (see below).
'Spitting' on transients can also sometimes be heard when the high frequency separation is poor. An average value is 35dB at 1kHz and 25 to 30dB at 10kHz.
Distortion on Breakthrough Signal
The spectrogram in Fig. 3.9 shows the distortion on the non-speaking channel of a typical f. m. tuner. The first component is the 1kHz driving signal at about -35dB, which corresponds approximately to the stereo separation. We then see the second, third, fourth, fifth and six harmonics.
The vector sum of these referred to the amplitude of the fundamental frequency breakthrough works out to something like 25%, which corresponds to the total harmonic distortion on the breakthrough signal . Hence the reason for maintaining the best possible stereo separation! The spectrogram also shows the pilot tone at 42dB below the speaking channel 100% driving signal, which is only 8dB below the 1kHz breakthrough signal!
Birdies Suppression
When the stereo decoder is activated by the stereo signal, harmonics of the 38kHz reclaimed sub-carrier are produced. These are predominately odd order harmonics, the 5th, for example, being at 190kHz. Now, if the tuner is tuned to a stereo signal and there happens to be another signal in the adjacent [...]
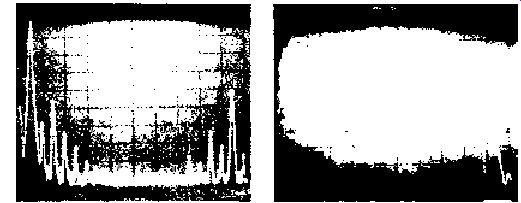
Fig. 3.7: (left) Distortion spectrogram, also showing pilot tone, where
the total harmonic distortion (stereo mode) is round 0.521 % (see text
) . Scale as Figs. (a ) and (b) 3.6.
Fig. 3.8: (right) Frequency/ amplitude sweeps of frequency response (upper trace and 1dB/div. vertical) and stereo separation (lower trace and 10dB/div. down from upper trace) . Frequency scaling 20Hz -43kHz logarithmic with three divisions per frequency decade.
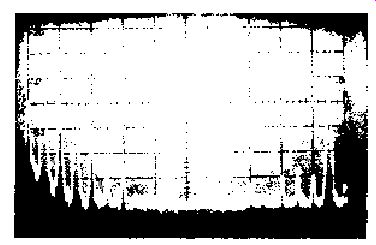
Fig. 3.9: Spectrogram showing distortion on the breakthrough signal .
Relative to the driving signal in the non-speaking channel (e.g., to the
fundamental at the breakthrough signal), the distortion is as high as 25%.
Also showing pilot tone at -42dB relative to the speaking channel 100%
1kHz drive.
... channel (200kHz away) , the adjacent signal may not be heard because of the selectivity and capture effect of the tuner . However , some of the adjacent signal might well enter the i.f. passband (see Fig. 3.2) and arrive at the FM detector with the tuned signal. Intrinsic non-linearity here encourages a 200kHz beat signal , which arrives at the stereo decoder . This 200kHz signal itself 'beats' with the 190kHz 5th harmonic of the sub-carrier, thereby yielding a 10kHz tone, and because this is perturbed by the modulation (frequency deviation) the 10kHz tone manifests as a 'warble' , colloquially called 'birdies interference' . How much 'birdies interference' is produced by a tuner depends on the steepness of its i.f. selectivity characteristic, on the design of the FM detector and stereo decoder and, of course, on the strength of the adjacent (or alternate, since there are other 38kHz harmonics present) channel signal.
Birdies rejection is never included in tuner specs , but since we rate it high in importance it is measured in our lab and is now being included in our test reports and reviews . Some tuner designers eliminate the trouble by fitting a low-pass filter (circa 53kHz turnover) between the FM detector and stereo decoder. However, unless this is done properly the high-frequency stereo separation can suffer.
Measured our way, a good value is 70dB and a poor value 50dB or less . The average value is 60dB, and with this it is unlikely whether 'birdies' would be troublesome except, perhaps, in difficult areas . Summary We have deliberately not ventured into a.m. radio specifications . This is a guide dealing with hi-fi specifications, and the existing a.m. is far from hi-fi! From the information presented you should easily be able to select a tuner most suitable for your particular requirements . You should be able to do this from the parameters of the spec without having to rely too much on individual 'opinion' as to the 'sounding' of a tuner ! We have found that the parameters given have a close correlation to the subjective experience of a tested, weighted and experienced listening panel working under controlled conditions.
= = = =