AMAZON multi-meters discounts AMAZON oscilloscope discounts
No. 28 : IF AGC TV TESTS
The symptom of AGC trouble appears on the TV screen as a loss of or distortion of video only on strong local channels. The weak snowy stations are unaffected or are sometimes better.
Also , with AGC trouble, the picture could be missing, have too much contrast or weave. The key to the AGC diagnosis is that the symptom occurs primarily on strong channels and to a lesser extent or not at all on the weak channels. Once AGC is suspected as the trouble, the fact must be proved before component-by-component testing of the AGC circuit is begun, because a defect in the IF circuit or video detector could also be causing the same symptom. If the AGC symptom is not being caused by the AGC circuit itself, that fact should be ascertained at the beginning of the repair.
The best way to be sure is to substitute an external bias for the AGC circuit and observe what happens. A bias box acts exactly like the AGC circuit. It provides a variable plus or minus DC voltage. An AGC circuit simply provides a plus or minus DC voltage to turn the RF and IF off and on to various degrees according to the incoming signal strength. To test the IF AGC, attach the bias box to the first IF input on the AGC circuit side of any isolation resistor in the circuit (Fig. 24). Then, turn on the TV and try to get rid of the AGC symptom by adjusting the bias box voltage. If the symptoms disappear, the AGC circuit contains the trouble. If the AGC ' symptoms persist , the AG-C circuit itself is exonerated.
No. 29 : RF AGC TEST

Fig. 24. The bias box can be used as a substitute for the AGC voltage, confirming
or denying suspected trouble.
When a TV picture develops snow on strong channels and the weak channels still come in as usual, the RF amplifier is indicated as defective. However, the RF amplifier itself might not be defective ; the AGC input to the RF amplifier might be at fault.
The AGC circuit has one DC output which varies slightly in accordance to the amount of signal that is passing through the video detector. For tube circuits the De must be a negative voltage if it is applied to the control grids of the tubes. On rare occasions when the AGC is applied to a cathode of a tube , the AGC must be positive De in order to change the cathode voltage as a means of varying the tube gain in order to compensate for variations in the video and provide a constant amplitude output. In NPN transistor circuits , since the NPN electron flow is from emitter to base and collector, just as the electrons is in a tube flow from cathode to plate, the AGC applied to the base must be negative. If applied to the emitter it must be positive.
In PNP transistor circuits, since the electron flow is opposite to that in an NPN and tubes , or from the collector to base and emitter, the base injected AGC must be positive. If applied to the emitter, it must be negative.
All this discussion notwithstanding, if the RF AGC connection is disconnected and the snow ceases, the RF AGC base line contains the trouble. If the snow persists, the AGC input is good and the trouble is in the RF amplifier .

Fig. 25. The color TV horizontal output cathode current is a critical test
with a 0-500 milliammeter.
No. 30 : HORIZONTAL OUTPUT CURRENT
In a black-and-white and especially in a color TV, high-voltage requirements are strict. There might be no apparent symptoms except that the horizontal output transformer (flyback ) or horizontal output tube repeatedly burn out. Don't just keep changing the expensive parts. Find out why the part keeps failing. It is rarely due to poor design on the part of the manufacturer.
It is a good idea to check the amount of current passing through the horizontal output circuit. If there is a little too much current, the parts will overheat and eventually fail prematurely. When the current is extremely high, the part will burn up within minutes. The best place to make a test is in the cathode of the horizontal output (Fig. 25 ). In fact , many color TVs are equipped with removable links to permit the insertion of a milliammeter into the circuit without unsoldering. The meter should read anywhere from 150 milliamps to 220 milliamps according to the actual circuit. The service notes should specify the exact amount of current.
Too much current can be caused by many conditions. A shorted screen grid resistor or capacitor , a leaky component in the flyback circuit, or any number of other things. The most common cause in a color TV is a de-tuned flyback circuit. The Q is lowered and added drain put on the horizontal output. The circuit can be retuned by "tuning " the efficiency coil until the current is reduced to the amount specified in the service notes.
Minimum current is sometimes the correct setting, but not always.
No. 31: COLOR TV GRAY-SCALE TEST
With the color intensity control turned off, a color TV picture ideally should have no color in it. The viewer should not be able to tell that the TV is a color set by analyzing the picture. The whites should be white. The blacks should be black and the grays true. If there is a tint to the picture at all , in the highlights (white ) or the low lights (gray and black) , the gray scale is defective. Many older TVs are not capable of producing a perfect black-and-white picture ; however, recent TVs all are. When a TV that is capable of a good black-and white picture does not have one, the first step is a gray-scale alignment test. The color TV picture, even monochrome one, is composed of a mixture of red, blue and green light. The correct mixture produces a perfect black and white. The three electron guns (red, green and blue ) in the CRT are adjusted with the CRT bias, the three screen controls are the three drive (control grid ) controls (Fig. 26 ). The service switch kills vertical sweep, producing a horizontal line. The three drive controls are turned all the way up and the three screen controls are turned all the way down.
Then the screens are turned back up until a small amount of each color light is mixed in the correct proportions to produce a white line. Then, the service switch is reactivated, producing full sweep again.
If there are any tints in the highlights , the drives are adjusted to remove it. If any of the screens won't produce a color, the CRT bias is turned up until it does. With practice, the test is performed in minutes .
No. 32 : COLOR TV PURITY
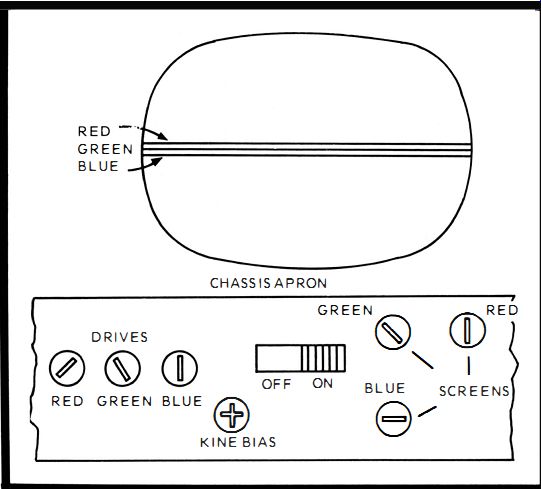
Fig. 26. Color TV gray-scale setup is conducted with simultaneous use of eight
chassis apron controls.
When the colors in a TV picture are incorrect in spots and when a black-and-white picture has splotches of tinting, it is an indication that the purity adjustment is off. This is different than the gray-scale problem with tinting over the entire display. In fact, you can set up the gray scale and get a good monochrome picture except for these splotches.
The gray scale is dependent on the purity, though. The purity is perfect when each electron beam is landing on its correct color phosphor. If the beam is lighting up another phosphor, the purity needs adjusting. A magnifying glass or small telescope enables you to see a closeup of the phosphor dots on a color TV screen. If you look closely , you can see that the beams are landing incorrectly.
The reasons for impurity are three (Fig. 27 ) : One, the CRT or its holder has become magnetized, thus pushing the beams off course. Two , the purity ring on the CRT neck could be misadjusted, pushing the beams near screen center off course. Three, the deflection yoke could be too far forward or too far back on the neck of the tube, causing incorrect crossover points for the optical-like beam, thus changing the landing position of the beams, especially around the perimeter of the CRT. The first step in the cure is to get a red field by turning off the green and blue screens , then degauss the CRT. Next, adjust the purity tabs for screen center and the deflection yoke for the CRT perimeter. By performing the job two or three times a near perfect red field is produced. Then the gray scale must be reset.

Fig. 27. The purity of a color TV picture is adjusted with a degaussing coil,
purity rings and yoke.
No. 33 : COLOR TV DOT CONVERGENCE
The major problem with a 3-gun color TV picture tube is getting the three separate pictures, red, green and blue, in perfect registry. The three pictures must be reproduced one on top of each other. At spots on the screen where registry does not take place , colors will bleed and distort the picture. Bleeding , while noticeable in a color display , is even more noticeable in a black-and-white picture. Therefore, it is a good idea to analyze a black-and-white picture for bleeding and perform the necessary adjustments while observing the black and-white picture.
It is possible to adjust the faults in registry or convergence, as its called, with an off-the-air program, and it is even easier if you can find one channel that is transmitting a stationary test pattern, weather program or stock market numbers. The best way to converge, however , is with a dot-bar generator. The generator places a pattern on the screen that is steady and won 't disappear all of a sudden like a test pattern. The TV screen is divided into five distinct sections for convergence adjustments. Each has its own controls. The sections are center, top, bottom, left side and right side. We discuss the center adjustments here and the other four adjustments in the next test.
The center adjustments are best made with a dot pattern on the screen. A crosshatch pattern could be used, but the dots are the ideal. There are four adjustments especially designed to move the color dots around in the center of the screen. They are called the statics-red, green and blue and the blue lateral. These four adjustments are found on practically every 3-gun color TV.
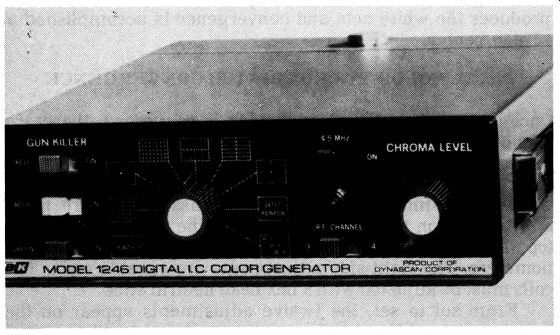
--------------- B & K Model 1246 digital IC color generator used for
convergence adjustment.
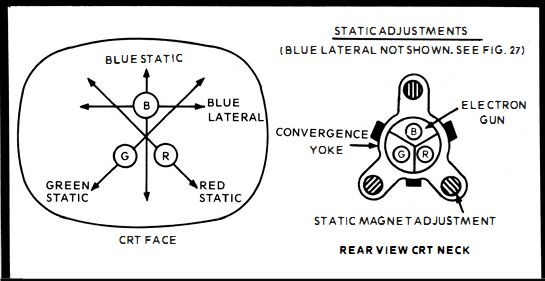
Fig. 28. The blue lateral, red, green and blue statics are all adjusted to
achieve convergence at screen center.
The color dot-bar generator is attached to the TV antenna terminals, set at one of the low VHF channels and all the equipment turned on. Dots are sent into the TV. The entire TV screen will display the dots , but for the static adjustments , only a small section in the center of the display is watched.
The rest is easy. Set up a mirror in front of the TV set and begin the adjustments. The idea is merge the three dots , red, green and blue , together until they produce a single white dot. The red static adjustment, usually found at the eight o'clock position on the convergence yoke , causes the red dots to move diagonally across the screen from left to upper right (Fig. 28 ). The green static adjustment, usually at the four o'clock position (green and red could be reversed ), causes the green dots to move diagonally across the screen from bottom right to upper left. When the red and green dots merge, they make yellow dots. The blue static adjustment, usually at the 12 o'clock position , causes the blue dots to move up and down.
The blue static is adjusted until the blue dots merge with the yellow or are alongside the yellow.
The blue lateral adjustment, usually set back on the CRT neck, causes the blue dots to move side to side. It is adjusted until the blue dot merges exactly with the yellow dot. This produces the white dots and convergence is accomplished at screen center.
No. 34 : COLOR TV CROSSHATCH CONVERGENCE
Once the center of the color display is converged, there are four other sections of the screen that should also be put into perfect registry, the top, bottom, left side and right side. The 3 gun color CRT is usually equipped with a convergence board with 12 adjustments to perform this task. There are three adjustments on the board for each of the four sections. The top, bottom and left-side adjustments are usually potentiometers. The right-side adjustments are tunable coils. The coils must be adjusted with a hex head neutral stick.
From set to set, the twelve adjustments appear on the board in many different arrangements. However, they are set up primarily to merge the crosshatch bars in the respective sections. Dots , TV channel test patterns and even a live picture are suitable for the adjustment procedure, but ideally a crosshatch pattern is best. You should see red, green and blue crosshatch patterns on the screen. When they are merged , they produce a white crosshatch, and when a white crosshatch appears all over the screen, all three beams are in perfect registry.
For practical purposes, quite often perfect registry is impossible , due to the imperfections in the TV or CRT. At these times the best compromise picture is usually satisfactory. If the crosshatch can be made to appear merged at six feet, without noticeable bleeding, the viewer will usually be satisfied. If convergence cannot be obtained, a defect in the receiver's high-voltage section, sweep section or CRT is indicated.
The same hookup is used as was described in the color dot section, except the generator is switched to produce a crosshatch output. Once the crosshatch is displayed and the center has been converged, the top, bottom, left side and right side are analyzed (Fig. 29 ). It must be remembered that if after some of these adjustments, called dynamic, are made, and the center should go out of adjustment, it can be re-converged and then the dynamic adjustments continued.
There are adjustments for the following parts of the crosshatch. One, the red-green horizontal bars. Two, the red-green vertical bars. Three, the blue horizontal bars. There is no adjustment for the blue vertical bars. They are the reference by which the other bars are adjusted. If you find the blue vertical bars are out of adjustment, you must reset the blue static, the blue lateral and then try to merge the red green vertical with the blue vertical. You can't adjust the blue vertical dynamically.
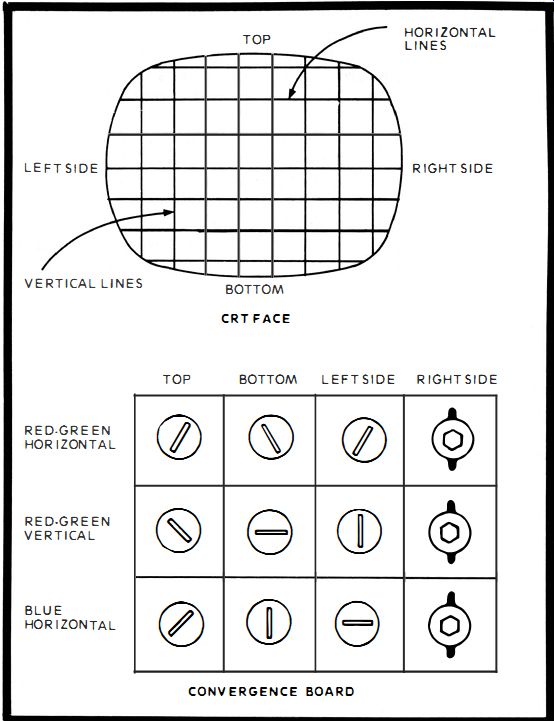
Fig. 29. The twelve adjustments on the convergence board and the crosshatch
from a color generator are used in convergence adjustments.
There are three adjustments for each section of the screen. Consider each section of the screen independent of the other. However, there is considerable interaction between the top and bottom adjustment, and also between the left-side and right-side adjustments. It is good technique to use two hands. For instance, when you are adjusting red-green vertical at the top, keep the other hand on red-green vertical at the bottom. If the top adjustment moves the bottom a bit, you can immediately adjust it back into place.
Or if you are adjusting red-green horizontal on the left side, keep a neutral stick in the red-green horizontal on the right side. If some unwanted bar movement occurs in the right side as you adjust the left, you can touch up the right-side coil as it goes out. If you are turning one of the right-side coils and it suddenly stops having any effect, chances are good you have rotated the coil past the resonant point. Further adjustment is useless. Rotate the coil back to a location where it has an effect again. It is useless anyplace else. The actual alignment from beginning to end is routine and easy as long as you are aware of what the move you are making is accomplishing.
When you analyze and see more bleeding out of the left side blue horizontal bar, it can be touched up by going to the blue horizontal left side pot and adjusting it, keeping a neutral stick in the right side blue horizontal coil. If you make any other move, you are not only wasting your time but could throw off the precise adjustments. From beginning to end, the routine adjustments follow this pattern :
1. Adjust the top and bottom red-green vertical for convergence on the reference blue vertical bars.
2. Adjust the left-side and right-side red-green vertical for convergence on the reference blue vertical bars .
3. Adjust the top and bottom red-green horizontal for convergence on the blue horizontal bars.
4. Adjust the left-side and right-side red-green horizontal for convergence on the blue horizontal bars .
5. Adjust the top and bottom blue horizontal for convergence on the red-green horizontal bars.
6. Adjust the left-side and right-side blue horizontal for convergence on the red-green horizontal bars.
Notice there are only six steps for the 12 adjustments on the board. That's because good technique dictates using two adjustments at a time in the full convergence procedure. If you are touching up one section, it need be that you have to adjust only one at a time. The steps can be taken in any order and it will be rare that the entire alignment will be completed with one pass. Usually, you'll have to adjust and adjust, going back and forth between the four statics and the twelve dynamics. It is also usual that you will have to redo the gray scale and purity adjustments as you perform this alignment.
Touchups only are usually needed when the TV has been operating for awhile and bleeding begins due to aging of components. The full alignment usually is needed only during times when the TV has been disassembled because a color CRT, deflection yoke or convergence yoke became defective. When there is an actual component defect in the convergence circuitry, registry is not impossible. If you find such a case, abandon your alignment procedure until you are able to get the convergence circuit difficulty out of the way. Otherwise , you are wasting time.
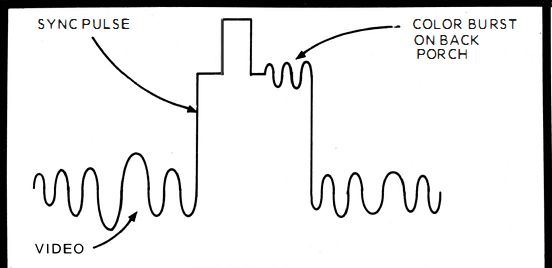
Fig. 30. The composite TV signal has about eight "rings" of color
burst on the horizontal sync "back porch."
No. 35 : COLOR TV AFPC ALIGNMENT
The colors in a TV picture are locked into place by means of the color sync section, commonly called the AFPC. The heart of the color sync section is the 3. 58-MHz color oscillator. The 3.58-MHz color subcarrier is suppressed at the transmitter and must be reconstructed in the receiver before the color can be reproduced in the display.
The 3.58-MHz oscillator is the reconstruction mechanism.
The oscillator , however, cannot simply run free at 3.58-MHz. It must run exactly at 3.58 and exactly in phase with the incoming signal. The information to lock in the oscillator is transmitted to the receiver on the "back porch" of the composite TV signal (Fig. 30). The color sync pulse takes the form of a sine wave with eight ringing waves. The sine wave, of course, is of the correct phase and it's called the "color burst. " The burst is extracted from the back porch, amplified in a burst amplifier and then fed as sync into the oscillator circuit.
The oscillator output is then sent off to the demodulators. When the oscillator is off frequency, an incorrect signal is sent to the demodulators. This causes incorrect colors on the screen or causes the colors to cascade through the picture in a disturbing fashion. When this trouble occurs , the best approach is to perform the AFPC alignment. If the oscillator is simply running off frequency , alignment will quickly restore the correct synchronization. If there is a defect in the AFPC network, the alignment will localize the defect to a particular circuit.
There is more to the color sync section than just the oscillator and burst amplifier. In order to lock in the oscillator , a sampling of the oscillator output is injected into one end of a phase detector. The output of the burst amplifier is injected into the other end of the phase detector, where a DC output voltage is obtained from a center tap in the phase detector circuit. This output is fed to a reactance circuit. The varying DC changes the bias of the reactance circuit and thus its output (Fig. 31). The reactance circuit, which acts as a varying capacitance or inductance, is connected across the oscillator and is an integral part of the oscillator's frequency-controlling tank. The output of the reactance circuit causes the oscillator to vary slightly in frequency and phase. As the oscillator tends to vary from the prescribed frequency, the sample is compared to the incoming burst and the DC control voltage brings it back into step with the burst.
You can do the alignment with an off-the-air TV program, but better control over the procedure is obtained if a color-bar generator is used. The color-bar generator is attached to the antenna terminals and the tuner set to a low VHF channel. The color bars should appear in a specific order on the screen when the set is operating correctly. The phase of the oscillator is indicated by the color of the bars and the frequency of the oscillator by the stability of the bars. A discrepancy of only 2 Hz will cause the bars to drift. There are lots of color receivers which do not use reactance control. If you are aligning one of them, simply skip the reactance part of the alignment.
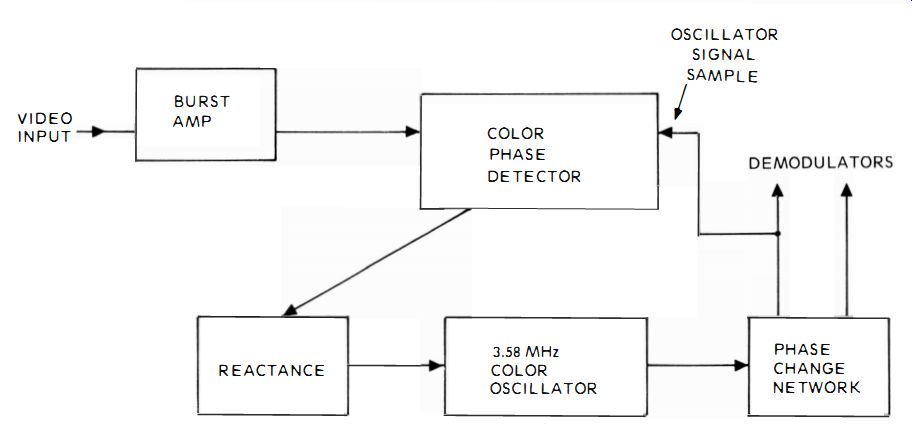
Fig. 31. The color burst has the job of locking in the frequency and phase
of the color oscillator.
Fig. 32. The AF PC alignment is easily done with a color bar generator input, jumpers and a VTVM indicator connected as shown.
The alignment is performed with a good multimeter and several jumper leads (Fig. 32 ). Tune in the color picture for best reception. Try to eliminate any sound bars that might be present. Turn the color intensity control all the way up for the greatest color intensity. Open up the color killer as far as it goes to be sure that the most color is present. Set the color tint control to the center of its range. That will be its correct set ting if the alignment goes as planned.
1. Take a couple of readings in the phase detector. Take a reading at one of the diodes on the burst transformer side. You will get either a plus or minus reading. It doesn't matter which. It should be anywhere between 20 and 40 volts. Attach the VTVM there and remember the reading.
Attach a jumper cord from the burst amplifier input to ground. Adjust the 3.58-MHz oscillator transformer for maximum VTVM voltage. If you can't get any voltage now with the jumper in place, there is a problem in the oscillator or in coupling to the detector. If you get a good voltage, the oscillator itself is eliminated as the problem and you now have the oscillator transformer correctly aligned .
2. Remove the short from the burst amplifier. As you take the short out, the voltmeter needle should jump higher. That's the burst entering the phase detector and mixing with the oscillator voltage. If the voltage does not increase, the burst amplifier is causing the trouble. When the voltage does rise, the burst amplifier is cleared. While you are there, adjust the burst transformer for maximum voltage, which correctly aligns the transformer.
3. Take a jumper cord and ground the DC input to the reactance circuit. There is usually a special test point just for this purpose. In fact, you do this step only when you want to just touch up the AFPC. When the jumper is installed, the
oscillator runs free without sync. If the colors really go wild, it means the oscillator transformer was badly mistuned and was unstable for that reason.
Adjust the reactance circuit output coil until the colors just float by. The oscillator is then running free but right on 3.58 MHz. If you can't get the colors to float by or hold still, the frequency-controlling components in the oscillator have a defect. This includes the entire reactance circuit and the 3.58 MHz crystal .
4. Once float-by is attained, remove the reactance input jumper. The colors should snap into place. If they do, the AFPC alignment is completed. If the colors do not lock, but are floating, the reactance circuit has a defect. Should the colors not only continue to drift but begin a fast whirl , there is a defect in the phase detector. This could be due to a bad diode.
The AFPC alignment can be performed in minutes once the technician with practice. It is a vital procedure in color TV servicing. Without it, the entire AFPC circuit becomes a maze of confusion and cannot be serviced intelligently. Slight differences in procedure vary from TV to TV.
No. 36 : VECTORSCOPE HOOKUP
Much confusion reigns concerning the vectorscope troubleshooting technique. It is thought of as an instant cure all for the color circuits ; therefore , special vectorscope instruments are marketed and sold. While vectorscope equipment is useful and the techniques valuable, the basic equipment is already on the service bench if you have a scope and color-bar generator. The technique does provide some valuable service information on some color TVs , but not all.
A vectorscope unit is nothing more than a scope with isolated , balanced vertical and horizontal inputs. You can use your scope. Take two high-impedance probes and attach one each to the vertical and horizontal inputs (Fig. 33 ). Switch the horizontal sweep to external. Next, inject your color-bar generator's output into the receiver antenna terminals. The color TV has to have a difference amplifier output of R-Y, B-Y and G-Y. You will not get an accurate vectorgram from a TV that has pure R, B and G color outputs.
Attach the vertical probe across the R-Y output and the horizontal probe across the B-Y output. The color-bar signal will then provide a stationary pattern showing the R-Y and B-Y outputs (Fig. 34). The R-Y sweeps the vertical component and the B-Y sweeps the horizontal component.
In a vectorscope, you will immediately have the desired "daisy" displayed. In your ordinary scope a display will appear that might resemble a daisy but could be distorted. You must carefully adjust the vertical and horizontal sweep amplitudes in order to get a good looking daisy. Once you get a daisy so what ? Well, it provides an accurate picture of the R-Y and B-Y signals. Analysis of the vectorgram tells you whether or not the bandpass amplifier is tuned properly , whether or not there is adequate color amplification, if the color frequencies are correct, as well as the color phase relationship, etc. The height of the petals gives an indication of the color amplitude. Adjust the bandpass amplifier transformer for best height and roundness of the petals. The roundness indicates the bandpass response. Petal roundness should be normal, not too fat or too thin .

Fig. 33. -A vectors cope display can be achieved with an ordinary scope, two
probes and a color-bar generator.
The positioning of the petals provides an indication of correct frequency and phase. If the petals are rotating, there is color sync trouble. If the petals are holding but the third (R-Y ) is not pointing 12 o'clock, the phase is off. Either way, short out the test point between the phase detector and reactance amplifier. The petals will whirl. Adjust the plate coil of the reactance amplifier until the petals just float by.
(Yes , same test as in the AFPC. ) Then, remove the short. The petals should lock into place.
During troubleshooting, the vectorgram will display trouble in these circuits. However, there are few set patterns and the analysis is too complex to be much help in routine color TV servicing .

Fig. 34. When you sweep a scope vertically with R-Y and horizontally with
B-Y from a color genera tor, the "daisy" display is formed .
No. 37: STAGGER-TUNED IF ALIGNMENT
In FM and TV receivers, it is usual to employ more than one IF stage in order to get enough amplification. A common design is the stagger-tuned IF strip using three or four stages. They can be either tube or solid-state. Both designs are similar. The IF band in an FM receiver has a center frequency of 10.7 MHz. The bandwidth is typically 200 kHz. The IF bandwidth in a TV receiver is usually centered at 44 MHz. The bandwidth is typically 6 MHz in order to pass the video , sound and color carriers. The three stages are "stagger tuned ," each to a slightly different frequency so each stage can pass and amplify different parts of the bandwidth. The result is an overall response equal to the desired bandwidth.
Typically, in an FM receiver, one stage amplifies at 10.7 MHz , another stage at 100 kHz above and the other 100 kHz below. A TV receiver has one stage set at 44.25 MHz, another at 45 .75 MHz, and the other at 42 .17 MHz. This staggering of the tuned frequencies enables the full 200 kHz in the FM and the full 6 MHz in the TV to pass easily.
Also, with stagger-tuned stages, there are traps to get rid of adjacent-channel signals. In a color TV there is a trap to suppress the sound carrier so it beats as little as possible with the color subcarrier and thus produce a minimum of 920-kHz beat interference , which appears as annoying interference (TVI). The alignment procedures for an FM radio and a TV are quite similar in general approach, although each has its own "quirks" of design. Various special jigs and bias voltages have to be used in order to adapt to the peculiarities of various AGC and IF designs. It would be impossible to cover these in this discussion. You must have the actual service and alignment notes to do a specific alignment job according to the factory specifications. Our purpose is to explain the object of alignment and the frequencies involved. They are universal and dictated by the FCC and station transmission standards. A TV set receives all VHF and UHF channels. They all have different carrier frequencies. However, as you know, the tuner tunes them all individually, no matter whether it's Channel 2 or 82, and applies the selected signal to the conventional 44-MHz IF. When the carriers are changed to the IF, they are reversed in order. The sound is now lower than the video ; the sound is 41 .25 MHz and video at 45.75 MHz. The color subcarrier is located between sound and picture, 920 kHz above the sound at 42.17 MHz. The center frequency is not exactly at 44 MHz but at 44 .25 MHz (Fig. 35 ). There are two other frequencies that have to be worried about. They are the adjacent-channel sound at 47.25 MHz and adjacent-channel video at 39.75 MHz.

Fig. 35. On the IF response curve the audio and adjacent channel carriers
are suppressed. Color and video signals appear at 50 percent.
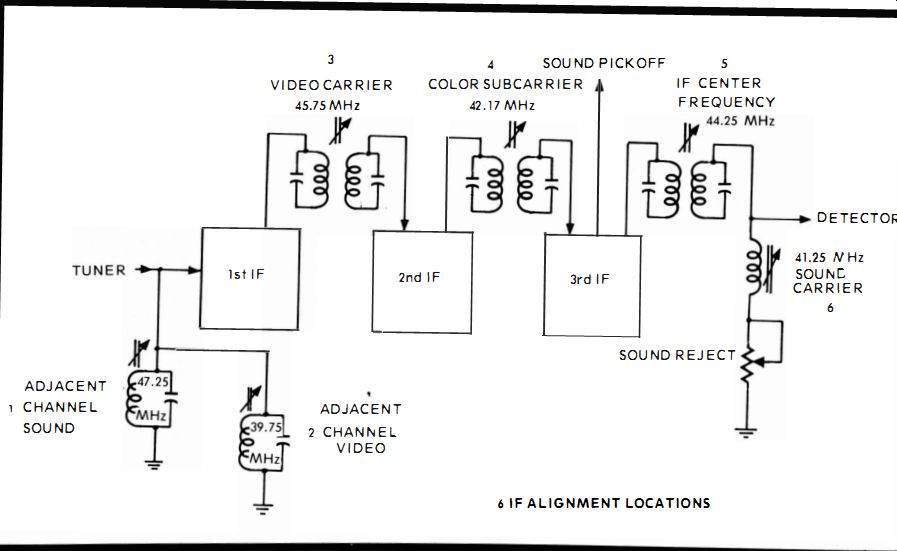
Fig. 36 They are the six frequencies that have to be considered.
Each frequency on the IF scale has to be placed at a different amplification level. In the input of the first IF is usually a trap tuned to the adjacent-channel sound at 47 .25 MHz. This trap has to be aligned so that it suppresses adjacent-channel sound as much as possible (Fig. 36). Adjacent-channel sound produces a herringbone interference on the screen if it is not suppressed. In fact, if you have excessive adjacent-channel sound, you can try eyeballing the interference out by touching up the trap.
Also , in the input of the first IF is another trap tuned to the adjacent-channel video at 39.75 MHz. (Notice that the adjacent-channel sound is from the channel below and the adjacent-channel video is from the channel above .) This trap has to be aligned so that it suppresses adjacent-channel video as much as possible. Adjacent-channel video produces a wind shield wiper interference on the screen if it is not suppressed.
In fact, if you have adjacent-channel video , you can try eyeballing it out by touching up this trap.
The coupling transformer from the first IF to the second IF is usually tuned to the video carrier at 45.75 MHz. This transformer has to be adjusted until the 45 .75-MHz video marker sits approximately 50 percent on the slope of the IF bandpass response curve.
The curve appears on the face of the scope and is produced with sweep generator and marker genera tor signals applied to the TV according to the service notes. Various bias voltages are applied to the IF to sit the desired amplification levels. The scope picture is the detected bandpass curve. (The IF frequencies around 44 MHz are not displayed on the scope , their detected resultant is. ) The coupling transformer from the second IF to the third IF is usually tuned to the color subcarrier at 42 .17 MHz. This transformer ha s to be adjusted until the 42. 17 MHz color subcarrier marker sits approximately 50 percent down on the other slope of the IF bandpass response curve. When this transformer is misadjusted, it can cause a weakness or a complete loss of color. (It is not advisable to try to eyeball the color back in by adjusting this transformer, unless it is a TV that you are familiar with and know that this transformer is a problem.) The coupling transformer from the third IF to the detector stage is usually tuned to the middle of the bandpass at 44 .25 MHz. It has to be adjusted to linearize the center of the bandpass. There needn't be a marker for this frequency.
In the output of the last IF is a trap in series with the sound-reject potentiometer. The trap is tuned to the sound carrier of the channel being received. It has to be adjusted, along with the sound reject, to suppress the sound carrier as much as possible. The sound is typically tapped off in the third IF stage. After the sound pickoff, the carrier must be suppressed, or it beats with the color subcarrier, producing a 920-kHz signal.
You can eyeball the 920-kHz beat out of the picture by adjusting the trap and sound reject. You might get more color intensity, too, since you will be adjusting the slopes of the response curve at the same time.
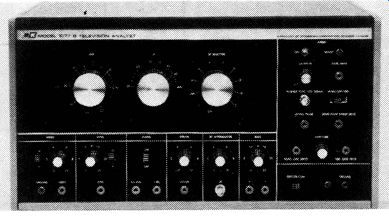
-------- B & K TV Analyst, Model 1077- B, produces a complete array
of TV test signals.
No. 38 : DC HI-VOLTAGE TEST
DC high voltage , as its known in some receivers, is used to accelerate the electron beam in a cathode ray tube. It is an RF voltage produced during the horizontal flyback interval, rectified and sent through a heavily insulated wire to the anode of the CRT. It is vital that the correct voltage level be maintained. Too little can produce dark displays , hard-to adjust displays and all kinds of distortions. Too much high voltage can produce unwanted X-ray effects , posing a potential hazard.
Any good voltmeter properly equipped with a multiplier resistor encased in a specially designed high-voltage probe can produce an accurate reading. The TV is turned on and the probe attached to the voltmeter. There are some special voltmeters mounted on probes that are built especially for this test (Fig. 37).
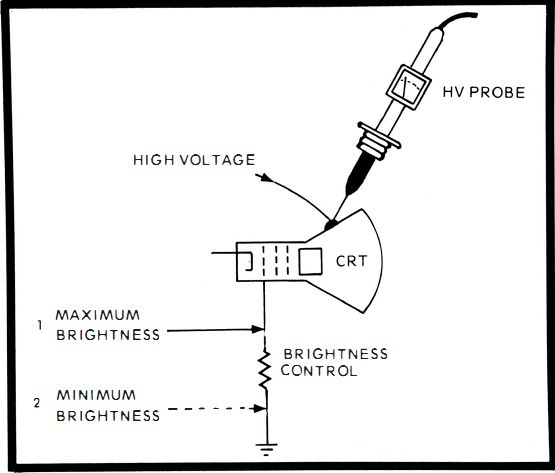
Fig. 37. The HV in a color TV is measured at maximum and minimum settings
of the brightness control.
The test is usually conducted in two ways : one, with the brightness turned all the way up and another with the brightness extinguished. With the brightness turned all the way up , a maximum electron emission occurs at the CRT gun or guns and the flyback system draws the maximum amount of current. In other words, the system is running wide open.
With the brightness turned off, there is no electron flow from the guns and the flyback system draws little or no current. A comparison between the two states gives a rough idea of the efficiency of the flyback system. Too much of a voltage difference means the system is not operating properly.
No. 39 : RF-IF SCOPE SIGNAL TRACING
As the signal passes through a radio or TV receiver, it is processed in numerous ways. At various stages the signal is amplified, heterodyned, shaped , trapped, certain frequencies extracted, and so forth. Good servicing technique dictates that the servicer knows what the signal looks like on a scope as it passes through the receiver. When the signal is tiny (in the low microvolts), it is difficult to get a good scope picture. As the signal is amplified and detected, the scope pictures get better and better.
Two main scope probes are used. One is the demodulator probe and. the other is the high-impedance or, as it can be called, a low-capacitance probe. Direct probes can sometimes be used, but in almost every case a high-impedance probe will also work. The direct probe can load down a circuit with the scope's input impedance. The high-impedance probe, as the name implies, isolates the scope from the receiver being tested and in almost all cases is more accurate than the direct probe (Fig. 38). The demodulator probe is used to look at signals while they are still modulating the carrier wave, whether it is RF or IF. The probe contains its own AM detector which detects the signal at the test point being observed. In a radio and TV receiver a demodulator probe is used when the RF-IF area is inspected. If the probe is touched at the output of the last IF , the same picture appears as would be seen if the output of the receiver's detector were observed with a high-impedance probe. In fact, the reason for the test is to see if the signal is getting to the output of the last IF and if the detector is a trouble suspect.
If' the probe is connected to the input of the last IF, the same detected display will appear, except that it is considerably less in amplitude. That's because the display shows what the signal looks like before it is passes through the last IF and amplified many times. The output of the second IF shows the same signal as the input of the third IF. The only components the signal has to pass through is the IF transformer and perhaps a blocking capacitor. These components neither amplify or attenuate the signal to any appreciable degree.
A scope picture taken at the input of the second IF shrinks in amplitude even more. Lots of inexpensive scopes will not even have enough gain to display the second IF input signal, it is so weak.
The scope picture taken at the input of the first IF is miniscule if the scope has enough power to even display it.
Scope pictures on ordinary service bench equipment taken in the mixer-oscillator or RF amplifier do not produce any display. There are more expensive industrial type scopes that will produce displays taken from the tuner. However , on most servicing jobs such large amounts of amplification are not needed.
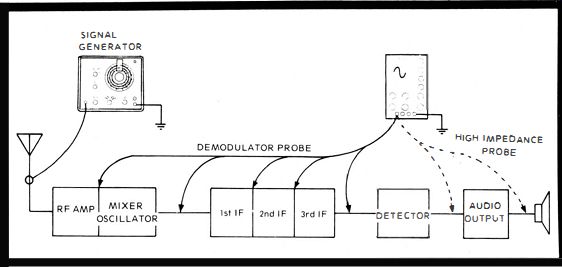
Fig. 38. Signal tracing through a receiver is easy when you have a scope,
generator and correct probes.
No. 40 : VIDEO SWEEP MODULATION TEST
The bandpass amplifier is tuned in an odd way. In addition to having to pass the color sidebands centered around 3.58 MHz on the 6-MHz TV passband, it has to amplify one side of the sidebands more than the other. This is because the color subcarrier is stationed 50 percent up on the slope of the passband and the IF, as a result, amplifies the higher part of the slope much more than the lower part of the slope. The bandpass amplifier must amplify in a way to complement the IF method of amplification and produce an equal response of the color sidebands.
The method used is called video sweep modulation. Marker and sweep generator signals are injected into an RF modulator. This produces a picture carrier at 45.75 MHz which is modulated with a video-type signal with a bandpass of zero to 5 MHz. The signal is attached to the TV receiver before the IF stages. The output of the IF is detected and the 45 .75-MHz carrier is eliminated. The video type sweep is fed to the bandpass amplifier and the color sidebands are amplified on either side of 3.58 MHz.
A scope equipped with a demodulator probe is used to detect the 3.58-MHz color subcarrier. The color sidebands are then displayed on the scope. They should be linear. If they are not, the bandpass amplifier transformer is touched up until the sidebands look good (Fig. 39 ),

Fig. 39. The color TV VSM (video sweep modulation ) is a complicated hookup
for just bandpass adjustments .
No. 41 : HIGH-IMPEDANCE PROBE TEST
While the demodulator probe permits you to look into RF-IF and color IF circuits , the high-impedance probe permits you to look into the rest of radio or TV circuits. The demodulator probe is equipped with a diode detector (Fig. 40 ), and the high-impedance probe is simply a low-value variable capacitor , typically 6-30 pf , and a high-value resistor, typically 10 meg, in parallel (Fig. 41 ). This allows you to probe a circuit and prevent the impedance of the scope from loading down the circuit under test. In other words , the two components isolate the scope from the circuits under test.
The high-impedance probe is attached to the vertical input of a scope using an internal sweep for the horizontal. The internal sweep is set near the frequency of the circuit under test. For example, if the circuit has a 60- or 120-Hz signal in it, the internal horizontal sweep is set at 60 or 120 Hz. If the internal sweep is identical to the circuit under test, there will be a single display, as the same frequencies come into view both vertically and horizontally. If you are testing a circuit and want to see a double-peaked display you set the internal sweep at half the incoming signal frequency. Then the test frequency will appear twice during each internal sweep.
The probe will accept all frequencies up to the response limit of the scope. You can use the same probe with a scope that has a frequency response of 3 MHz as a scope with a frequency of 10 MHz. The high-impedance circuit in Fig. 38 can be rigged up if you'd like and attached in series with a direct probe.
- - - - - - -

Fig. 40. A typical demodulator probe contains an isolation and detection circuit like an ordinary AM detector.

Fig. 41. A typical high-impedance probe isolates the scope from the circuit under test and reduces any loading.
Fig. 42. The typical video picture displayed on the scope has visible sync pedestals and "writing" video.

No. 42: VIDEO EXPLORATORY TEST
In black-and-white and color TVs , there is a circuit area that processes the video signal. The video signal is also called the Y signal or luminance. The video leaves the detector stage and passes through the various video amplifiers and then into a video output. At that point it is large enough to drive a CRT and is applied to the monochrome or polychrome CRT. The big problem with the video is that it contains frequencies between zero and 4.5 MHz. Where a picture element has to change from black to white, the speed with which it performs this job approaches the 4. 5-MHz frequency.
There are special components in the video strip that permit such high frequencies to pass. They are parallel and series peaking coils , low-value output resistors and large capacitance units.
A defect in the video can range from no video to smeared video or too much video. A scope equipped with a high impedance probe permits a look into the video at various test points to determine if the video is there and give you a rough idea of its quality. The input and output of the video stages are the best test points. Most factory service notes have peak-to-peak pictures of what the video waveform should look like (Figs. 42 and 43). The scope is connected at these test points and the picture analyzed. The shape of the video , the appearance of the sync and blanking pulses and the relative peak-to-peak voltages are all observed carefully. Any deviation from the normal pictures indicates a nearby defect. Fig. 43. At the vertical sync frequency, the sync pedestal does not show, since lots of lines are super imposed.

Fig. 44. The sync output at the vertical sweep rate shows bumps which are
the vertical sync pulses.
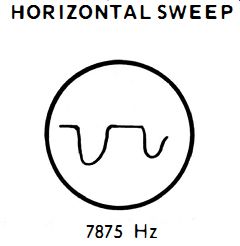
Fig. 45. The sync output at the horizontal sweep rate shows spikes -- which
are from the sync pedestal.
No. 43 : SYNC EXPLORATORY TEST
In black-and-white and color receivers , there is a circuit area that processes the sync pulses transmitted by the TV station.
There are many different types of sync circuits, but they all must do just about the same job.
A sampling of the video is taken from a junction in the video detector or video amplifier. It is passed through some series resistors and capacitors that clean up the video a bit.
Then, the video is passed into a sync separator. If the sampling is taken at the video detector, it is sometimes not strong enough to work in the separator and is passed through a sync amplifier before the separator gets it.
In the separator the bias is set so that the tube or transistor is cut off during the interval that the video is passed through it. However, when the larger peak-to-peak sync pulse is applied, the separator turns on and amplifies that pulse. In this manner only the sync pulse passes and thus is separated from the video (Figs. 44 and 45). The separated sync pulses are sent on to the vertical and horizontal oscillators through the integrator and differentia tor.
Probably the fastest way to service sync circuits is by a scope examination, using a high-impedance probe. The scope probe is touched to the various components , starting in the sync takeoff line and proceeding step by step through the sync circuit. If the peak-to-peak value or appearance of the sync pulse as it is processed is incorrect, it is an indication that the cause of the trouble is near.
No. 44 : COLOR EXPLORATORY TEST
In color receivers , the Y signal is fed to the cathodes of the color CRT and the R-Y, B-Y and G-Y color signals are fed to the control grids. The output of each gun , as the cathodes and control grids mix the signals, are pure R, B, and G. The R-Y, B-Y and G-Y signals are usually produced in the color demodulators. The color demodulators are fed color sideband signals from the color IF (bandpass amplifiers ) and properly phased signals from the color oscillator. In the demodulators the sidebands are mixed with the CW from the oscillator and the color carrier is reconstructed and appears as it did before it was suppressed at the transmitter less than a second before.
At the output of the demodulators , carrier is confronted by small capacitors to ground. The capacitors by-pass the carrier leaving the R-Y and B-Y signals intact. The R-Y is sent to the R-Y amplifier. The B-Y is sent to the B-Y amplifier. Both the R-Y and B-Y are sent to the G-Y amplifier where they combine electronically and produce G-Y. The R-Y output is applied to the red gun control grid, the B-Y to the blue gun control grid and the G-Y to the green gun control grid. The scope equipped with a high-impedance probe produces a picture of this entire process step by step. All you have to do is connect the scope probe at the various test points and observe carefully the scope display for both peak-to-peak value and quality.
The scope exploratory is best conducted if a fixed color bar signal is sent through the TV. The first place to check is the output of the demodulators. The outputs should look about the same, except that the amplitude of the bars are slightly different. It is a picture of a modulation envelope complete with CW. The next place to touch the scope probe is past the carrier by-pass capacitors , which are in the R-Y and B-Y amplifier inputs. The same scope picture should be there, except the CW is stripped off. The other test points are the outputs of the color difference amplifiers. All three scope pictures, at first glance, should look alike ; however, a closer analysis reveals that the bars are passing through the zero line at different places. In the R-Y waveform the sixth bar should be passing through zero. In the B-Y waveform the third and ninth bars should be passing through zero. And the seventh bar in the G-Y waveform should be passing through zero. The correct placement of the bars is vital to the color picture. If you should find bars not passing through zero junctures , the waveform is incorrect and the display means that the colors are not being processed properly. On the ordinary scope, pictures taken at the oscillator output will show a solid CW envelope. In order to actually see the waveform, the scope has to be set at a sweep frequency of 3.58 MHz. Most scopes cannot sweep that high.