AMAZON multi-meters discounts AMAZON oscilloscope discounts
No. 45: CALCULATING THE DECIBEL-ANTENNA SYSTEMS
The end result of a receiver is sound developed in the surrounding air by the speaker cone. This wave passes through the air, and the size of the resulting compression and rarefaction determines the amount of loudness the ear hears. Small pressure changes produce low sounds while large pressure changes are sensed by the ear as loudness. Strangely, the ear does not hear the differences in volume as a direct result of the increase in the wattage output of the speaker. If loudness is increased, the ear hears less and less of the total the higher the volume gets. The ear can pick up low volumes, but it is not overwhelmed easily as the volume is turned up. The ear responds to sound in a logarithmic manner. This makes calculations of wattage output difficult to relate to the human ear response, so a conversion figure is used. It is the decibel. It is useful to figure all signal strength in terms of decibels. This means the transmitter signal, the antenna pickup signal, the signal as it's amplified and the speaker output signal. Gains and losses in various sections of the transmitter and receiver are quite often calculated in db gain or db loss. The human ear does not actually hear the difference between two loudness levels as an exact logarithmic function.
The human ear hears the loudness change approximately the same as the value relationships in a log table. The approximation varies widely from person to person. It is quite useful, though, to be able to add the response in db rather than work out ratio problems. Therefore, the decibel is quite useful.
The db is calculated either from wattage readings, voltage readings or current readings. These are accomplished with a wattmeter, voltmeter or ohmmeter. If you want to calculate the db increase in a transmitter output change, it's done like this : The original wattage output is taken and the increase is also noted. Suppose the transmitter power has been increased from 20 watts to 80 watts. The formula is : db equals 10 log x power new power old db equals 10 log x 80 20 db equals 10 x 0.6 db equals 6 gain This says that the gdb increase was a result of multiplying the power by 4, from 20 to 80 watts. On the other hand, suppose you install an antenna system and you want to calculate the db loss in the line. This is another type of calculation. The transmitter output increase is a power ratio. The antenna line loss has to be calculated with a voltage ratio or to be exact, a microvolt ratio. The term decibel is an arbitrary characteristic and is a result of ratios. To simplify the antenna decibel figuring, the TV industry decided to set 1000 microvolts as the zero db point. The 1000 microvolts must be across 75 ohms, a value that produces a satisfactory TV picture. You'll see dbj or dbm for this figure, but it is only db.
The figure cannot be computed unless the input and output impedance is the same. This is mandatory.
The next thing is to take the microvolt readings. First a reading with a field strength, meter is taken of the lead-in output. Suppose it is 5000 microvolts. Then the reading is taken at the input. Suppose it is 10,000 microvolts. According to the formula : db equals 20 log x voltage output voltage input db equals 20 log x 5000 10,000 db equals 20 x 0.07 db equals 1.4 loss This says that there is a 1.4 db loss in the line. Notice that the actual microvolt level dropped in half, but the db loss is small.
Current db losses and gains are computed with the same formula as used for voltage. Again, the impedances must be the same if input and output readings are made. Otherwise, the ratio is incorrect.
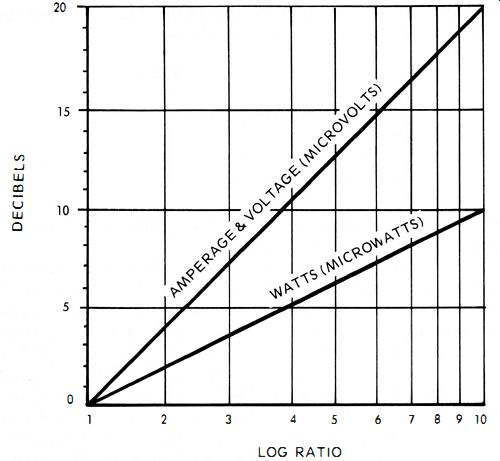
Fig. 46. The various signal parameters are difficult to handle until they
are converted into decibels.
No one in the field actually works out a formula to compute the db loss or gain. It can be taken directly off a decibel chart (Fig. 46). The decibels are the vertical axis and the spaces between zero and 20 are equidistant. The ratio, either wattage, voltage or current is the horizontal axis. The ratio numbers from 1 through 10 are not spaced equidistant. The spacing gets smaller between each succeeding number on what is called a logarithmic scale. Notice that zero on the decibel scale is one on the ratio. This corresponds to the zero level of db being set at 1,000 microvolts.
You'll notice that the power formula uses a multiplier of 10. Therefore , we can draw a characteristic line from the intersection of zero and one to the intersection of 10 and 10. This gives us all the power figures. The ratio of the powers is converted directly to decibels along the line.
You'll also notice that the voltage and current formulas use a multiplier of 20. Therefore, we can draw a line from the intersection of zero to the intersection of 20 on the decibel scale and the 10 of the log scale. All along this line, the voltage or current ratio can be converted directly to db.
The chart can be used for any power ratio by simply adding 10 db for every time the ratio is multiplied by ten. This is used for either losses or gains. A loss is a minus db and a gain is a plus db. For instance , suppose you have a power ratio of 4.
Then there is a gdb change. Suppose then the power ratio is changed to 40. Simply add 10 to the gdb charge and get 16.
Suppose the power ratio becomes 400. Add another 10 to the 16 and get 26. This is true for gains or losses. The same ratios occur and a loss is recorded as minus db.
No. 46 : TV MICROWATTS
The strength of received signals is usually thought of in microvolts or db. This is because we are always dealing with a fixed impedance of either 72 ohms or 300 ohms. Actually, microvolt reading by itself is almost meaningless. The microvolt level at 72 ohms is just about half of what is received at 300 ohms, yet they produce the same picture or sound. This is because the important figure is microwatts not microvolts. Microwatts is computed with the single formula E2R. For instance, suppose you have a 1000-microvolt signal being picked up by a 300-ohm antenna. The E2R is .0033 microwatts. Then , you install a matching transformer with no losses between the antenna and the lead-in which is 72-ohm coaxial cable. The output of the transformer would drop to 500 microvolts. Is there a loss ? No, because the microwatt level remains the same. E2R has (500)2 x 72 which is still .0033 microwatts. Even though the microvolts level drops in half, the power in microwatts remains the same. It's the power that drives the receiver circuits , not the microvolts (Fig. 47 ). Keep the relationship between the two impedances in mind. As you test for db or microvolts, realize that twice as many microvolts is needed in a 300-ohm system than in the 72 ohm system. It's the same amount of signal in the air and the same amount of power produced. When an FSM is calibrated for 72 ohms, just multiply the microvolt reading by two.
No. 47 : FIELD STRENGTH TEST
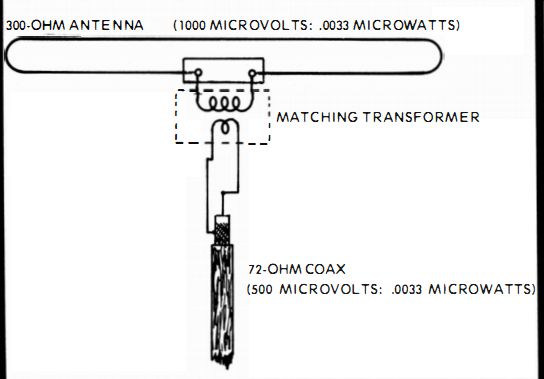
Fig. 47. When you match impedance correctly, even though the microvolts change
in number, microwatts remain the same.
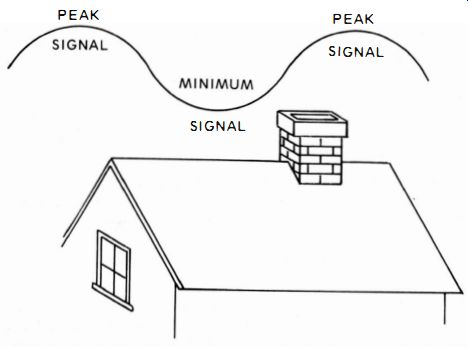
Fig. 48. A field strength meter ca n pick out exactly the peaks and minimums
of signal in the airwaves.
In weak signal areas, RF pickup is spotty. There are places in the air space above a roof where the signal is weak. Then a few feet away, the same frequency is stronger. Of course, it would be best to position the antenna system in the spot where the signal is at maximum. As the wave travels through the air it has peaks and nulls (Fig. 48). The antenna that is placed in the peak intercepts the maximum available signal. The peak can be located with the aid of an antenna and a field strength meter.
A typical fine field strength meter is the Sencore FS 134. It is battery-operated and small in size. Carry such a meter to the antenna site and attach an antenna to it. Take care that the lead-in used is the correct impedance. The usual impedance of the lead in is either 72 or 300 ohms. Provisions on the typical FSM are usually made to accept the lead-in.
The antenna is attached to the meter, the meter turned on and set at the desired frequency. Then you walk around the roof holding the antenna high and observe the meter. As the antenna is changed from spot to spot, height to height and direction to direction, the actual microvolt reading is ob
served. When the meter reads maximum, the best picture or sound will be received. It's a good idea to probe near the center of the roof or over a chimney so the actual installation is easier.
No. 48 : FIELD INTENSITY TO SIGNAL STRENGTH RELATIONSHIP
Confusion between field intensity and signal strength is common. They are both measured in microvolts but they are not at all the same. The field intensity is the number of microvolts induced in a conductor one meter long as the RF passes through the conductor at the speed of light.
Stations plot the field intensity of their allocation and publish a field intensity map. This map is useful. It typically depicts a contour of 500 microvolts (Fig. 49 ). That is, it shows the field intensity from its primary area at ground zero on out to where the signal is dissipated down to 500 microvolts. Any further than that is a deep fringe area.
On the other hand, signal strength is the number of microvolts present at the antenna system output. It is the signal "made" by the antenna. The field intensity induces a current in the antenna. The current flows down the lead-in and out into a matched impedance. The amount of signal produced is the signal strength.
You can determine what kind of antenna array you need by figuring out how much signal is necessary to drive a receiver, then calculate what kind of antenna will produce that much signal.
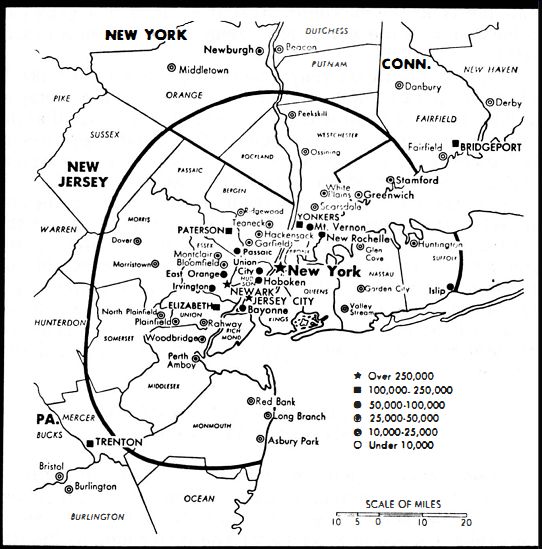
Fig. 49. Field intensity plots are calculated carefully for each transmitter.
The practical way to make your signal survey is with a set of rabbit ears and a field strength meter (Fig. 50 ). Remove the 300 ohm-ribbon lead-in from the rabbit ears and replace it with a piece of 75-ohm coaxial cable like the RG59 B-U. Adjust the rabbit ears for the exact wave length of the station you want to receive. A quarter wave length is arrived at for each arm in feet :
235 / Freq. in MHz
Then begin taking microvolt readings at the antenna site. You can mount the rabbit ears on the end of a clothes pole or other convenient piece of wood. Do not use metal because the wire is loose and will be affected by mutual coupling.
The readings you get will be the reference for your antenna installation. All antennas are rated against a straight half-wave dipole (two quarter-wave arms on the rabbit ears). If you want an antenna that will produce ten times as much signal in microvolts as your reference dipole, purchase an antenna that has a 20 db rating at the desired frequency. If you can get by with only three times as much signal, get an antenna with a 10 db rating. The db rating is logarithmic in comparison to the signal strength.
Zero db is an arbitrary figure and is set at 1000 microvolts. Minus 20 db is 100 microvolts and minus 30 db is 30 microvolts. Anything under 30 microvolts is usually too weak for use and cannot be read on the typical field strength meter. Signal strength is referred to as either db or microvolts. They both mean the same thing and are simply a microvolt number of its logarithm.

Fig. 50. To conduct a satisfactory signal strength survey test, ordinary "rabbit
ears" can be used.
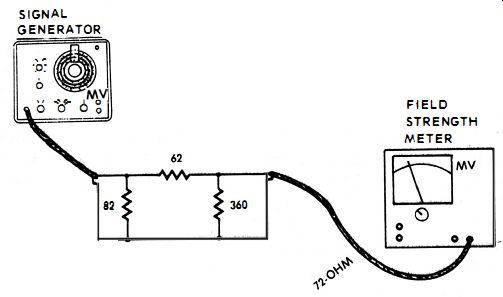
Fig. 51. A dandy way to accurately test your signal generator output is by
padding it into an FSM.
No. 49: CHECKING SIGNAL GENERATOR OUTPUT
During FM radio servicing , especially, and TV also, it is necessary to produce a sufficient microvolt level with a signal generator. This is mandatory for alignment, signal tracing and signal injection. There is usually a microvolt adjustment on the signal generator. It can read actual microvolts or simply be a scale from something like zero to ten. Either way it's a good idea to check the actual microvolt reading and calibrate the microvolt dial so you may intelligently perform the various testing procedures.
A good field strength meter provides the means to do this.
Most signal generators have an output impedance of 52 ohms.
Most field strength meters, like the Sencore FS134, have an input of 72 ohms. The generator output must be matched exactly to the FSM ; otherwise , mismatch losses will occur and the tests will be inaccurate.
A matching pad of three resistors, a 62-ohm in series , an 82-ohm in parallel from the signal generator side and a 360 ohm in parallel from the FSM side which matches 52 to 72 ohms (Fig. 51). 75-ohm coaxial cable is used on the FSM side Once the two units are hooked together, turn them on, being careful that the generator output is at minimum. Then turn the generator gain up a bit, never letting the generator output get above a readable indication. If you overload the FSM, which is easy with a signal generator , the meter can be hurt. Calibrate the dial according to the FSM readings.
No. 50 STANDING WAVE RATIO; SWR IMPEDANCE TEST
In the field during an actual antenna installation, the input and output impedances vary with equipment used. From a practical standpoint, quite a bit of mismatching is tolerable.
But the amount of mismatching is good to know in case you must improve reception. If there is a lot of mismatching, some of it can be corrected with matching gear.
The SWR is calculated easily by using the simple formula :
Load Ohmage
Line Ohmage
If a 300-ohm line is terminated in a 300-ohm folded dipole (300 divided by 300 equals 1, which is no SWR (Standing Wave Ratio ). On the other hand, if a 300-ohm line is terminated in a straight dipole with an impedance of 75 ohms, then 300 divided by 75 equals 4. This reveals a 4-to-1 mismatch (Fig. 52 ). This same type of consideration is used when figuring the line impedance as it is terminated at a receiver. Suppose a 75 ohm antenna is attached to 75-ohm coaxial cable and the cable is terminated into a 300-ohm FM receiver. Then, it is noticed that some of the multiplex signals are being received with poor separation.
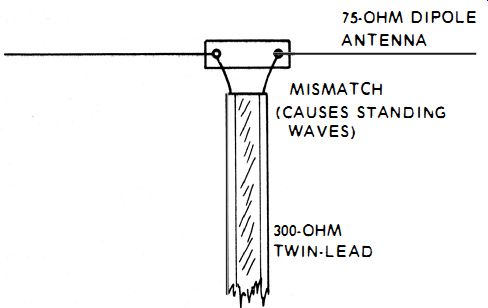
Fig. 52. Standing waves are caused by impedance "bumps" in mismatched
antenna components.
The answer to the problem could be the installation of a impedance-matching transformer at the receiver. This eliminates the line-to-receiver 4-to-l mismatch and could produce enough signal to bring the multiplex signal strength high enough for satisfactory separation.
No. 51 : UHF, VHF, &FM ANTENNAS ON SAME MAST
Quite often it is necessary to mount all three-UHF, VHF and FM-antennas on the same mast. It is certainly less expensive and more convenient to do so. A problem arises, though, since the three antennas cannot be mounted to a few wavelengths apart, but each must be within the other's sphere of influence.
This produces mutual coupling. The antennas will act as a vertical stack with random directors and reflectors for each other. It is possible to actually sit down with a slide rule and various charts to compute the distances and orientation necessary to obtain maximum reception.
At various distances the antennas will cause improved and reduced reception for individual channels. It is not practical to try and work it out mathematically. It is better to use a field strength meter and fix the antennas at specific spots indicated by maximum microvolt or db readings. Install the mast and place the UHF antenna first. Snug it down at the best compromise position for the UHF channels on the meter (Fig. 53 ). Next , mount the VHF antenna below the UHF and snug it down at the best orientation and distance from the UHF. Recheck the UHF and reposition if necessary.
Mount the FM antenna well below the VHF. Install it at the best position. Then recheck the VHF and the UHF. Find the best compromise position for all the channels. Keep switching back and forth, making touchup adjustments. Then tighten down.
No. 52 : TV MASTER AMPLIFIERS OUTPUT TESTS
When more than several TVs are fed from an antenna, a special trouble crops up. It's called cross modulation and occurs as a TVI effect called ' 'windshield wiper." The channel affected is the victim of another stronger channel. The stronger channel that is causing the problem is being received beautifully. However, it is overloading the amplifier and spilling video signal into the weaker channel.
The amplifier has specifications showing how much input in microvolts it can handle without overloading. A field strength meter is attached to the antenna lead-in in place of the amplifier (Fig. 54 ). Then, microvolt readings are taken on each of the channels. These readings are compared to the amplifier's input specifications.
It will usually be found that one or more of the clear channels is being received by the antenna at a higher strength than the amplifier is designed to process. These excessive signals must be weakened. This can be done by changing the orientation or by attaching attenuator pads between the antenna and the amplifier. If there is a gain control on the amplifier, it can be lowered to a more satisfactory level. The FSM is left in the line until the signals are balanced. It is best to have the signal strengths of all channels as nearly equal as possible. A level just 6 db more than another signal level can cause cross modulation.
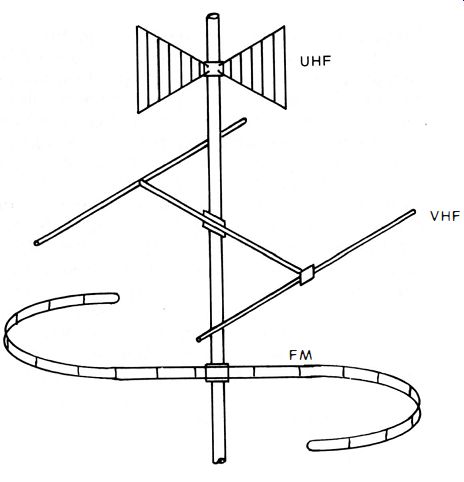
Fig. 53. If you must install UHF , VHF and FM antennas on one mast, place
the UHF on top and F M on the bottom.
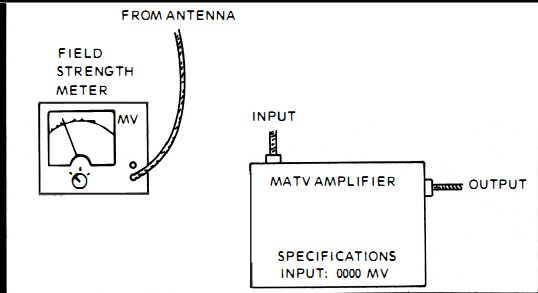
Fig. 54. By comparing the input of an MATV system to its rated output, good
quality pictures are obtained.
No. 53: IMPEDANCE MATCHING & CONVERSION
In deep fringe areas, every microvolt is valuable. The difference of a hundred microvolts can mean the difference between reception and no reception. People hesitate to purchase large color TVs or FM multiplex systems unless they are assured they will get satisfactory reception. The FSM will give accurate microvolt reading results if care is taken to use the correct impedance matched lead-in, or if it's not correct, that the lead-in is matched by a transformer.
When a transformer is used to match a 300-ohm lead-in to the 75-ohm terminal of a FSM (Fig. 55) , a rough rule of thumb used by technicians is to multiply the microvolt reading by 2.
This is far from accurate, because as the frequency being received becomes higher, the standing waves developed become more numerous and losses become greater.
Therefore, a more accurate multiplier is needed. 'It is not necessary that the multiplier be changed for every channel or FM station. A group of multipliers is quite satisfactory :
TV Channels 2 through 6: Multiply by 1.1 FM stations : Multiply by 1.1 TV Channels 7 through 13: Multiply by 1.4 TV Channels 14 through 83 : Multiply by 3.0
When you do multiply you are changing the microvolt reading with the losses to the reading of the signal that will actually be feeding the receiver.
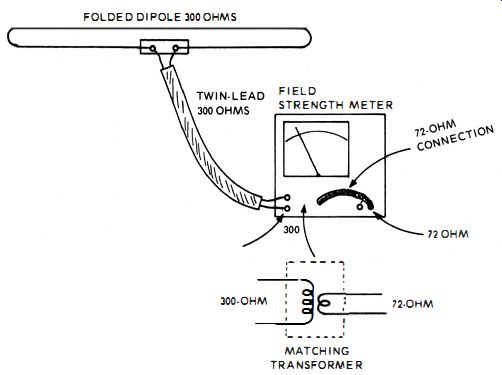
Fig. 55. To insure accurate microvolt readings, the antenna lead- in must
be matched to the meter input.

Fig. 56. A piece of 300-ohm twin- lead at TV frequencies is actually a complete
capacitance- inductance tuned circuit (cal led a "stub" ).
No. 54 : UHF CONSIDERATIONS
UHF is tricky. Good reception can be attained in one house , while next door it's non-existent. If UHF is going to be tough , it's a good idea to add a special UHF antenna to the one being installed. Also, when UHF reception is difficult, care must be taken that all lead-ins are terminated properly , all connections are snug and the UHF lead is well away from any metal objects or metal surfaces. No matter how hard you try, though, UHF signals encounter one serious problem-resistance in the line, which produces mismatches and signal loss. This can be helped considerably by attaching "stubs" either at the receiver (Fig. 56) or on the antenna. Attaching a stub is a hit-and-miss affair. At these frequencies a closed stub works best.
The FSM is attached to the lead-in and a reading taken.
Then the "stubbing" can begin. According to a particular channel frequency, a certain size stub works best. Due to the multiplicity of stations and stubs , the easiest way is to begin shorting out stubs and watching the meter at a particular tuned frequency. When a stub is shorted out and produces the maximum microvolt reading, you have the correct tuned stub.
In some cases , more than one stub is needed. You can attach one at the antenna and the other at the receiver .
No. 55 : TVI LOCATION PINPOINTING
Most TVI comes from various sources, and quite frequently the perpetrator of the disturbance is completely unaware of it.
Once the TVI producer is apprised of the fact that he is causing it, he will take care of it. If he won' t, the FCC will make sure he does. Of course, the job is locating the unwanted transmission.
This can be done with a good field strength meter and a set of rabbit ears. Take a map of the area and lay it flat (Fig. 57 ). With a compass orient the map to line up with the actual north-south position. Attach the map to the flat surface. Then, during the TVI, tune it in. If it's on Channel 3, tune the FSM to Channel 3.
The Sencore FS134 has a speaker output. You can hear the interference as you tune it in. Quite often you'll hear voice modulation and call letters which simplifies the sleuthing.

Fig. 57. Triangulation of a TV I source leads to its identification and then
to the eventual riddance of it.
When its a non-voice type, take the rabbit ears and rotate it until you get the peak amount of signal as indicated on the FSM in microvolts. Note the broadside direction of the TVI and draw a line across the map in the exact compass direction.
Then go to another location and take another broadside directional reading. Draw a second line on the map. By triangulation you can pinpoint the actual location of the unwanted transmission. Go to that location and see if the microvolt readings increase. Follow the peak of the readings and you'll locate the culprit. Then personal relations and electronic trapping can eliminate it.