AMAZON multi-meters discounts AMAZON oscilloscope discounts
The action of band-pass filters was outlined at the end of the previous section. Band-pass filters are perhaps the most commonly used type of filter. In a way they have more positive applications than low-pass or high-pass filters. As Projects 1 to 3 have illustrated, the function of low-pass or high-pass filters is usually to remove or reject some unwanted component from a signal. By contrast, a band-pass filter is usually employed to isolate a signal at a particular frequency so that it may be further processed in the absence of interference. Examples of the use of band-pass filters include the tuning circuits of radio and TV receivers, brain-wave detectors, and some of the filters used in musical synthesizers. The projects at the end of this section and later sections emphasize the usefulness of band-pass filters.
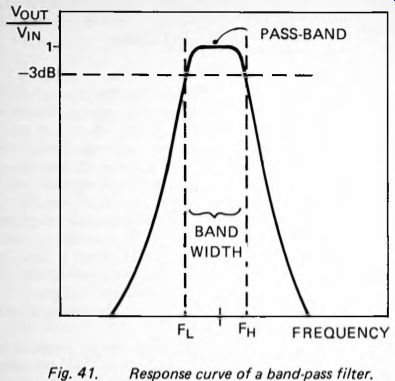
Fig. 41

Fig. 42
As Figure 41 shows, the response curve of a band-pass filter typically has a narrow pass-band with roll-off on either side. The extent of the pass-band is defined by considering that it begins at the -3dB point on the lower roll-off slope and ends at the -3dB point on the upper slope. The bandwidth is the difference in frequency of the two -3dB points.
The center frequency is loosely described as the frequency half-way between the lower and upper -3dB points, but we must be clear what we mean by 'half-way'. It all depends on the scales which we use for representing frequency on the response curve. When we refer to roll-off, we express it as so many decibels per octave. An octave is not a matter of increasing frequency by a standard amount, for example increasing it by a standard 100Hz from 400Hz to 500Hz, or from 1000Hz to 1100Hz. An octave is a doubling of frequency, from 400Hz to 800Hz or from 1000Hz to 2000Hz.
Thus, we need to work in octaves when we define what we mean by center frequency. The example illustrated in Figure 42 has the lower -3dB point at 100Hz and the upper point at 1600Hz. This is rather larger bandwidth than a band-pass filter would normally have but the discussion is clearer if we work in whole octaves. In Figure 42 there are 4 octaves between the lower and upper cut-off points (100Hz doubled 4 times brings us to 1600Hz). Putting the center frequency half-way between the two points on an octave scale, it lies 2 octaves above the lower point and 2 octaves below the upper point. Two octaves above 100Hz puts the center frequency at 400Hz. We can see that this is quite a long way from the average or arithmetic mean of the two points, which is 14(100+ 1600) = 850Hz.
As a general rule for calculation of the center frequency, we define it as the geometric mean of the upper and lower cut-off points. To calculate the geometric mean of two values we multiply them together and then take the square root. Contrast this with the arithmetic mean, in which we add them together and divide by 2. In the example of Figure 42, the geometric mean is:
V(100x 1600) = Vl 60000 = 400Hz .
This is the same result as we obtained by counting along the octaves in the figure. More often the upper and lower points are closer together and their distance is some fraction of an octave. Then the geometrical mean equation is the only way of finding the central frequency. For example, if the two points are 1200Hz and 1250Hz, the center frequency is given by V(1200 x 1250) = Vl 500000 = 1224.7Hz.
We may sometimes wish to express the bandwidth relative to the central frequency. There are two ways of doing this.
One is to express it as the fractional bandwidth, the bandwidth divided by the center frequency. In the example just quoted, the bandwidth is 50Hz and the center frequency is 1224.7Hz, so the fractional bandwidth is 50/1224.7 = 0.04. We can also express this as a percentage, i.e. multiplied by 100 to give the percentage bandwidth, in this case 4%.
Q and its Relatives
Accounts of filters and tuning circuits often refer to a factor known as Q, the quality factor. This is a measure of the 'sharpness' of the peak of the response curve. A high value of Q means that the response curve bends sharply; a low Q means that the curve is more broadly rounded.
Q does not enter into passive and first-order active sections since no resonance is involved. But, in second-order active sections of low-pass and high-pass filters, Q is a measure of the sharpness of the knee of the curve as it plunges from the pass-band into the transition region. A low Q means an over-damped flat response (Fig. 32) while a high Q means an under-damped sharp response. Instead of Q, we sometimes refer to a damping factor d, which is simply 1/Q. For example, a damping factor of 2 means that Q is 0.5.
Having two factors, one of which is simply the reciprocal of the other, is not the end of the story.
The Q of a filter or other resonating circuit is more precisely defined as the ratio of its bandwidth to its center frequency. This has a familiar sound to it! Referring to the definition of bandwidth in the section above, we sum up the situation below, with 'frequency' meaning center frequency or resonant frequency, as appropriate:
frequency 1 1 Q = bandwidth fractional bandwidth d
The factor d is usually applied only to low-pass and high-pass filters, while Q is applied to any kind of resonating circuit, including oscillators and those filters which are based on resonating elements.
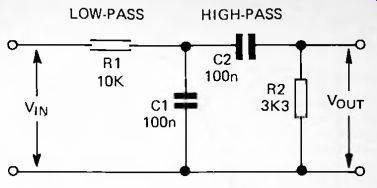
Fig. 43. A passive band-pass filter.
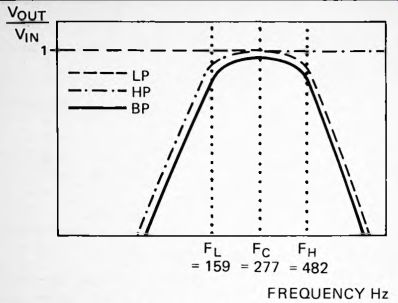
Fig. 44
Overlapping Filters
The simplest way to make a band-pass filter is to cascade a low-pass filter and high-pass filter with suitable cut-off frequencies. Figure 43 shows a passive band-pass filter. With the component values shown, the low-pass filter has its -3dB point at f_H, where:
f_H = 1/( 2 pi x 10 x 10^3 x 100 x 10^-9) = 159Hz
We refer to this cut-off frequency as f_H because it is the higher of the cut-off frequencies, even though it is produced by the low-pass part of the filter. The response curve of the low-pass filter is shown in Figure 44. The -3dB point of the high-pass filter is:
fL = 1/( 2 pi x 3.3 x 10^3 x 100 x 10 ^9) = 482Hz
Figure 44 shows how the response of the high-pass filter overlaps that of the low-pass filter, leaving a pass-band with the center frequency, f0, where:
f0 = V(159 x 482) = 277Hz
The bandwidth of this filter is 323Hz and the fractional bandwidth of this filter is 323/276 = 1.1. This gives a reasonably broad pass-band, suitable for most applications. This broadness is indicated by the value of the fractional bandwidth being greater than 1.

Fig. 45
If the components' values are changed so that fL is raised or f_H is lowered, or both such changes are made, there is less overlap between the curves (Fig. 45). Then the response peaks very sharply, and the signal strength is appreciably reduced in amplitude, a situation which is usually undesirable. The fractional bandwidth is small. As a general rule, filters constructed as in Figure 43 are suitable when the fractional bandwidth is around 1 or greater than 1, but are unsuitable for values significantly less than 1. For such filters we employ active devices in various ways.
Tuned Active Filters
One principle on which a band-pass filter may be based is to use an inverting amplifier with a tuned frequency-rejection sub-circuit in the feedback loop. Figure 46 shows an example of this type of filter. The frequency-rejection sub-circuit is known as a twin-T. This refers to the T-shaped configurations of R1, R2 and C1 and of C2, C3 and R3. At the cut-off frequency, the networks shift the phase so that the signals emerging from the twin T's are 180° out of phase and cancel out.
The result of incorporating the frequency rejection sub-circuit into the feedback loop of the amplifier is that signals of the tuned frequency are not fed back. The lack of negative feedback at that frequency results in an increase of gain.
Signals are enhanced giving increased amplitude in output at that frequency. This type of band-pass filter is often referred to as a tuned amplifier.
This is a useful type of filter but only for a fixed frequency.
If it is required to vary the frequency, it is necessary to have a triple-ganged variable resistor, a type of component that is difficult to obtain, particularly as one of the resistors (R3) has to be exactly half the value of the two others.

Fig. 46. A tuned active filter.
Multiple Feedback Filters
This is an extension of the overlapping passive filter of Figure 43. The high-pass filter (C1 and R1, Fig. 47) and the low-pass filter (C2 and R2) both receive negative feedback from the output of the amplifier, thus reducing the responses at high and low frequencies. Intermediate frequencies are boosted. VR1 adjusts the center frequency, without affecting bandwidth or gain.
The response of a typical filter of this type has high Q, sharply peaked as in Figure 45. For a flatter response band, two such filters are cascaded. They have slightly different (staggered) center frequencies and together produce a response curve like that in Figure 41. The roll-off is steepened and the peak of the curve is broader (lower Q). If the staggering is increased, that is to say the difference between frequencies is increased, the top of the curve becomes broader still, but a slight dip appears. Provided that this is not too deep, it is usually acceptable.
It is also possible to cascade three or more multiple feedback filters with staggered frequencies to give an even broader pass-band.
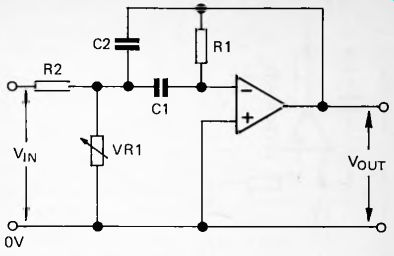
Fig. 47. Multiple feedback band-pass filter.

Fig. 48.
State-variable Filters
This is a popular type of filter consisting essentially of an oscillator which is made to oscillate strongly when it is fed with a signal containing its tuned frequency. The circuit consists of a minimum of three op amps, one wired as a summer and the other two as integrators (Fig. 48). These are two ways of using op amps that we have not described so far. First we consider the summer (Fig. 49). Its action depends upon the virtual earth property of the inverting input. When a number of currents flow toward the inverting input (-), they apparently disappear into it. What actually happens is that these currents combine and flow through the feedback resistor and into the output terminal (which is at negative potential). The op amp adjusts this output potential so that the total current flowing through the feedback resistor is equal to the sum of currents flowing toward the (-) input.
This is the only way in which the potential of that input can remain at OV, equal to that at the (+) input.
If all resistors are equal:
V_cut = -R(I i +/2 +/3)
/! = Fi/R, /2 = V2/R and I3
Vout = -RiVy/R + V2/R + V3/R) = -(Ki + F2 + F3) But V3R
So the output voltage equals minus the sum of the input voltages.
The integrating action of the circuit shown in Figure 50 depends on the fact that the capacitor stores the current flowing to it through R1. If the (-) input is to be kept as a virtual earth, the output potential must fall to accommodate the increasing p.d. between the plates of the capacitor. Thus the output falls at a rate which depends on how much charge is accumulating on the capacitor. It sums or integrates the current that has entered the capacitor during the period of time since the current first started to flow. In mathematical terms:

-----------
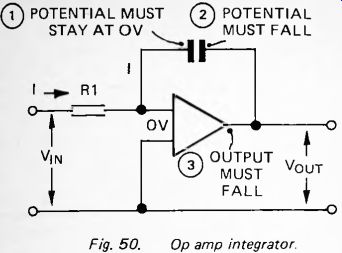
Fig. 50. Op amp integrator.
If V_in has the form of a sine wave (or a nature °f sine waves of different frequencies), V_out has the form of the integral of the sine, which is minus the cosine. This is equivalent to a sine wave with a phase lag of 90°. If this cosine wave goes to a second integrator, it is integrated again, the integral of minus cosine being minus sine. Now we have the original sine wave, but with a phase lag of 180°. All that remains to be done is to invert this and to recover the original sine wave. All of this happens in the circuit shown in Figure 48. Starting at the middle amplifier in the top row, which is connected as an integrator, any sine wave arriving at this is converted to a minus cosine wave and is then converted to a minus sine wave by the next integrator. This signal is fed back (oscillatory feedback) to the summing amplifier. This inverts the signal and sends it back to the first integrator as a sine wave. If the amount of feedback is sufficient the signal passes round and round the circuit--the circuit oscillates at a frequency dependent on the value of the resistors and capacitors.
The summer amplifier also has a resistor which receives V_in--This is added to the signal (if any) already circulating.
V_in has the same frequency as the resonant frequency of the circuit, it stimulates the circuit to greater oscillation. The signal which appears at the output of the first integrator consists of this resonant frequency--the band-pass frequency.
In this type of state-variable filter the summer amplifier also receives a signal from a fourth op amp, wired as an inverting amplifier. This inverts the band-pass signal (converts minus sine to sine) and feeds it back into the system. The effect of this is to dampen the response. By adjustment of the damping feedback the Q of the circuit is controlled. VR is adjusted so that the circuit does not oscillate unless the input signal contains frequencies in its pass-band.
One interesting property of the state-variable filter is that it also has low-pass (LP) and high-pass (HP) outputs which can be used simultaneously with the band-pass output. The signals from these outputs may be recombined in varying proportions, using an op amp summer, to produce an all-pass filter. This is one in which all frequencies are passed to a greater or lesser degree. This allows the response of, for example, an audio amplifier system to be tailored over the whole of the audio spectrum.
Another interesting property of the state-variable filter is that, once it has been made to oscillate, it continues to oscillate for a short time after the stimulating input has ceased.
The oscillations die away gradually, like the oscillations of a bell after it has been struck. The length of time depends on the Q of the circuit and may be a second or more. This property is useful when simulating the sound of bells, chimes or vibrating strings (see Project 11).
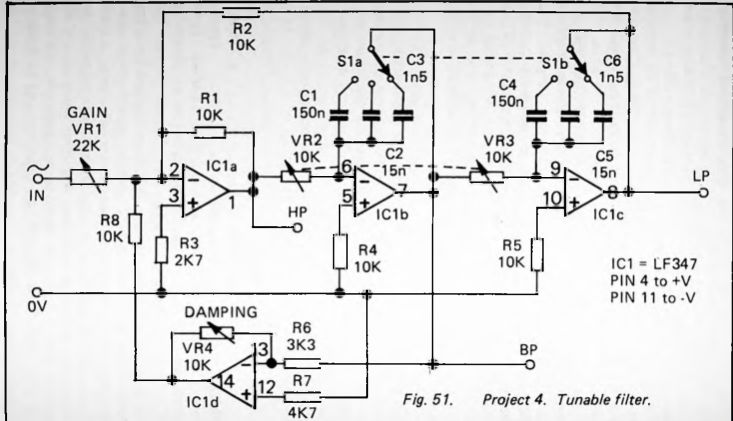
Fig. 51
Level 2
PROJECT 4--Tunable Audio Filter
This is a state-variable band-pass filter (Fig. 51) which can be tuned over a range of frequencies from about 100Hz to 100kHz. It has variable damping and gain. The filter also has low-pass and high-pass outputs. A filter such as this has many applications in the electronics workshop, particularly when designing and building synthesizer and sound effects circuits.
It provides an 'instant' filter circuit that can be used to try out sounds and effects, so as to hear what they sound like. When suitable settings have been found by trial and error, a permanent filter with fixed resistors and capacitors can be built to replace the tunable filter.
Two or more filters of this type may be cascaded to increase roll-off.
As well as the audio applications of this project there are the visual ones, as described in Project 6 below.
How It Works
The operation of this filter has been described. VR1 is a gain control, the gain ranging from 0.45 when VR1 is set to 22 k-O to 10 when it is set to 1 k-O. VR2 and VR3 are ganged variable resistors sweeping the frequency over a 1:10 range as they are varied from 10 k-O to 1 k-O. There are three ranges obtained by switching different capacitors into the feedback of the integrating op amps. The ranges are:
(1) 106Hz to 1.06kHz
(2) 1.06kHz to 10.6kHz
(3) 10.6kHz to 106kHz
VR4 controls the damping. With VR4 set to 10 k-O the damping factor is 3, or Q = 0.33. At 1 k-O the damping factor is decreased to 0.3 and Q is 3.3. Normally the circuit is in continuous oscillation at this setting.
Construction
The circuit requires a dual power supply of ±5V to ±18V, which is normally supplied from the test circuit. The project is built on a small area of strip-board and housed in a plastic case. One measuring 120mm x 65mm x 40mm was found to be large enough to provide room for the circuit board and for mounting VR1, VR2/VR3, VR4 and S1 on the lid. Compactness of the layout is an asset as this lessens the possibility of interference being picked up from outside sources. The leads for power, input, output (LP, HP and BP) are conveniently terminated with crocodile clips or sprung probe clips.
The switch and variable resistors are fitted with pointer knobs, each of which has a scale. Mark the scales as precisely as possible with the resistance values and capacitor values for each setting. For example, the scale of VR2/VR3 and VR4 is marked to indicate settings of 1, 2, 3,. , and 10 kilohm.
This is done by measuring the resistance with a test-meter and turning the knob and marking its position for each resistance setting required. These markings enable the user to read off correct resistances and capacitances needed to produce an identical response in a fixed-value equivalent filter, The scales may also be marked with approximate values to indicate frequency, gain and Q. The equations required for calculating these values are:
(R in ohms)
(R in kilohms)
(R in kilohms)
Frequency:
Gain:
I = 1/ 2 pi RC
A = 10 /R
Q = 3.3 /R
Q:
One essential point about this circuit is that the input signal must come from a source that has its own internal connection to ground. For this reason the filter can not be coupled to the signal source by a capacitor. If the signal source has no such ground connection, the signal should be fed to the filter by way of an amplifier. This can be any one of the circuits illustrated in Figures 26 to 28. The unity-gain amplifier of Figure 27 is often suitable and is the easiest to build. If it is likely that you will need such an input amplifier frequently it could be built in to the input side of the filter.
Special Components
For greatest reproducibility, fixed resistors should have 1% or 2% tolerance, though 5% tolerance is adequate for less critical purposes. Carbon-track variable resistors are generally suitable if they are calibrated as suggested above. Cermet-track variable resistors can be used for VR1 and VR4, and provide better reliability, but these are not readily available as ganged resistors.
Capacitors present more problems if precision is required.
For many purposes the inexpensive polyester capacitors may be used, though their tolerance of ±20% means that precision is very low, unless the capacitors are selected by first measuring their capacitance. Miniature layer polyester capacitors have a better tolerance, usually ±10%. For greater precision, use polystyrene (±2Vi% or ±1%), though it may not be easy to obtain these in the required values.
The integrated circuit is the LF347 quadruple JFET op amp, for which the TL-074 may be substituted. If you require an extra amplifier as input amplifier (see above), use the single-amplifier version of the LF347, the LF351. If you are using the TL-047 for the filter, use a TL-071.
PROJECT 5--Audio Signal Generator
If you do not already have such an instrument, this easily constructed circuit (Fig. 52) provides all that you need for Project 6 below and for some of the musical projects of later sections. It is also generally useful when building, designing or testing all kinds of audio circuits. The output of the generator is a signal at audio frequencies adjustable from about 50Hz to 2kHz. This does not include the whole range to which the human ear is sensitive but it covers over 5 octaves of the musical scale, from A in the 3rd octave below Middle C (55Hz) to A in the 2nd octave above Middle C (1760Hz). A special feature of this generator is that the waveform can be switched to square wave, pulsed wave, triangular wave, saw
tooth wave and sine wave. With these features, the generator is ideal as the basis of an elementary musical synthesizer.
Level 1
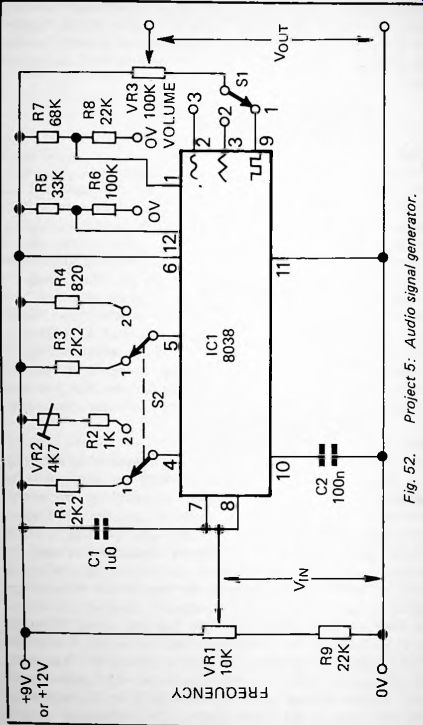
Fig. 52
How It Works
The complex parts of this circuits are contained in IC1 (Fig. 52), the 8038 function generator. This not only produces square waves and triangular waves but builds up sine waves, section by section, to a high degree of accuracy. The waveform is selected by switch S1. The frequency range is determined by the values of the timing capacitor C2, and the timing resistors switched between the positive rail and pins 4 and 5. With S2 in position 1, the two 2.2 k-O resistors are switched in. This gives the waveforms a symmetrical shape, so they are true square, sawtooth and sine waves. When S2 is in position 2, the resistance connected to pin 4 is about 5 k-O, while that connected to pin 5 is only 820 ohm. This gives an asymmetrical shape to the waveforms. The square wave now consists of long pulses, separated by short intervals about one-sixteenth of the pulse length. This is referred to as a pulsed waveform. Asymmetry of the triangular wave converts it to a sawtooth wave, one that can be subsequently filtered to simulate the sound of several different musical instruments ( Section 8). The sine wave is modified too and may produce effects that are interesting, even if unpredictable.
Construction
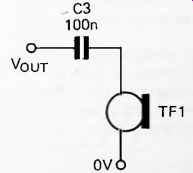
Fig. 53. Listening to the audio generator, using a crystal earphone.
The circuit requires only 6mA at 9V or 7mA at 12V so can be powered by a 9V PP3 battery and housed in a very small enclosure. Alternatively you may have plans to build it into a synthesizer project. As part of a synthesizer, the frequency control voltage is provided by keyboard circuits so VR1 and R9 will not be needed. Instead, pins 7 and 8 are simply joined together and the control voltage applied to pin 7.
To test the completed circuit, connect its output to an oscilloscope, to an audio amplifier (page 104) or to a crystal earphone (Fig. 53). It may be possible to hear only the square-wave signal when using the earphone. The function of VR2 is to adjust the total resistance of VR2 and R2 so that the frequency remains unchanged when switching from position 1 to position 2. Listen to the signal (or watch it on the oscilloscope) while switching between the two positions.
Adjust VR2 until there is no difference in frequency.
The precise shape of the sine-wave is controlled by the voltages applied to pins 1 and 12. The potential-dividers R5/R6 and R7/R8 usually provide the correct voltages. If you have an oscilloscope and find that the sine wave is not perfectly shaped, substitute resistors of slightly different values.
If you decide to calibrate VR1 for frequency, the simplest course is to use an oscilloscope and find the settings of VR1 for a range of frequencies. The scale may be marked in hertz or by the notes of the musical scale. Another method is to calibrate the generator against tones produced by a musical instrument such as a piano, or by a set of tuning forks.
Level 2
This project investigates the enchanting world of phase relationships. You need the filter of Project 4, a signal generator such as the one described in Project 5, and an oscilloscope. In addition to the signal generator, other audio sources such as the projects of some of the later sections can be used.
The project makes a good 'Open Day' display for a school or technical college laboratory. It could also make an attention-catching item for a shop window display, particularly if the equipment is switched to produce a sequence of displays automatically.

Fig. 54. Equipment connections for Project 6.
PROJECT 6--Fascinating Phases How It Works
The (low-pass) LP and (band-pass) BP outputs of the state-variable filter are 90° out of phase. This is the effect of the second integrator, which receives the '-cos' signal from the first integrator and produces a '-sin' signal. These two signals are applied to the x-input and y-input of an oscilloscope (Fig. 54). The y-input controls the vertical movement of the electron beam that produces the trace on the screen.
This is the input to which we normally connect an input signal. Horizontal movement of the beam is usually controlled automatically by a sweep generator circuit inside the instrument. This is set to sweep at different rates to produce the various time-bases. Almost all oscilloscopes have provision for switching out the sweep generator and instead controlling horizontal movement directly by an external signal.
This is the second input used in this project (Fig. 54).
The interaction between the waveforms from the BP and LP outputs of the filter cause the beam to be swept both vertically and horizontally. In the simplest instance, if the input signal is a pure sine wave, and the amplitude is equal along both axes, the figure produced is a circle. However, there are many parameters that can be independently varied, producing an almost inexhaustible range of patterns on the screen.
Investigating Phase Effects
The variables that determine the patterns are:
The signal generator: frequency amplitude (gain)
waveform (square, sine, etc.)
The filter: center frequency gain Q
which pair of outputs are used
The oscilloscope: gain of the y-amplifier.
It is best to begin by using the LP and BP outputs, with the filter center frequency set somewhat higher than the generator frequency. Set Q to a medium value. You can then investigate the effects of varying the gains of the generator, filter and oscilloscope. For some settings the pattern may be mainly off-screen, so in general it is best to work at lower gain levels. The general shape of the pattern is controlled by the ratio between the gain of the y-amplifier (vertical amplitude) and the gains of the other two instruments (horizontal amplitude).
Interesting effects are produced by varying Q, but it may be necessary to reduce gain at the same time to keep the display on the screen. For high Q, the ringing action produces a rapidly changing series of patterns. The ringing action may often be induced either by switching from one wave-form to another, or by rapidly altering the gain of the filter.
Although the combination of LP and BP inputs produces the most involved traces, interesting effects are obtainable by using BP with HP and HP with LP. The latter pair, being 180° out of phase, tend to produce diagonally oriented patterns.
As well as using a signal generator, other audio sources may be employed including the output from a tape-player. The effects are best when the music has a strong beat and when few instruments are playing. Solo guitar produces good results. It makes the display more effective if it can be arranged for the music to be heard at the same time as it is being 'seen'.