From time to time we hear references to distortion and other nonlinear effects produced by passive circuit components, such as capacitors, used in audio circuits. However, only on rare occasion can anything be found in written form which attempts to quantify or otherwise document capacitor problems, particularly as they specifically relate to audio. Yet, distortions are produced by a wide variety of basic capacitor types, and in some cases forms of this distortion are rather easily measurable. Why there hasn't been more written on this topic is truly a good question, as in many instances the audible defects produced by capacitors can easily be the Achilles' heel of a given design. If this were not a truism, why else would there be so many audiophile modifications consisting essentially of capacitor upgrades only? The implications of this will be apparent when this article is fully appreciated.
While there has been no detailed overview or discussion of these problems in print, two articles are noteworthy, because they do in fact address this specific topic. In [1], Dave Hada way gave a summary of relative quality rankings for capacitor types. More recently, John Curl [2] discussed some measured results for two capacitor types. Dick Marsh [3,4,5] has been specific in cautions against certain types, in several Audio Amateur letters.
What we hope to do in this article is cover capacitor basics, means of testing for impedance and distortion, and summarize with some selection criteria which will optimize sound quality. We will begin by discussing some simple (but deceiving, really) distortion tests. A summary of key capacitor performance defining terms is given in the sidebar entitled Capacitor Basics.
Signal Path Tests For Capacitor Distortion
One of the more frustrating aspects of the distortion problem vis-a-vis capacitors is that they do not always allow direct quantification as they typically operate in the signal path. A good example of this very point will be demonstrated below in the discussion of some THD tests on tantalum capacitors.
By these THD results, one might be led to believe that tantalum types are adequate when suitably selected. Nevertheless, they still fail to measure up in auditioning and show poor electrical quality when measured by other methods even though they may appear to be operating in a virtually distortionless fashion by THD tests.
Two series of THD tests were performed on two types of capacitors, tantalum electrolytics and ceramic discs. These tests seem to be representative, as different capacitors of the same variety produced similar results, and the results here generally correlate with Curl's [2].
[*Copyright by Walter G. Jung, Consulting Author, and Richard Marsh, Technical Specialist, Laurence Livermore Labs, Univ. of California, Berkeley, Calif.]
Tantalum Capacitor Tests
In the tantalum tests, a circuit was built in the form of a simple high-pass filter, as shown in Fig. 1. The general test circuit used is shown in Fig. 1a, and the details of various capacitor connections are in lb. The 3-V rms generator and meter is a THD oscillator/analyzer combination. The general goal of this test is to examine the distortion sensitivity of the polar tantalum capacitor in handling bipolar a.c. signals.
As the different connections of lb indicate, there are various ways that a polarized capacitor such as this can be connected. The circuit as shown in la is a simple a.c.-only circuit with no d.c. polarizing bias applied to the capacitor in test condition A. For such a mode of operation, a tantalum capacitor will generate appreciable distortion when the signal conditions
are such that there is appreciable a.c. voltage dropped across it. Or, stated another way, when its reactance becomes appreciable in relation to that of the load (here 680 ohms).
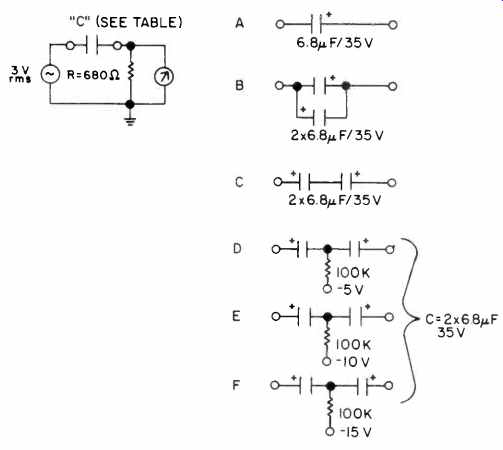
Fig. 1--Tests of tantalum capacitors. (above left) Fig. 1a--General; (above right)
Fig. 1b--Test details of test circuit. capacitor connections.
For condition A, the capacitor is a single 6.8N F unit, and its reactance equals 680 ohms at about 35 Hz. To generalize, we will talk in terms of this frequency, which is the corner frequency, fc. As will be seen, it is a key to understanding this particular pattern of distortion behavior.
THD data were taken on this and the remaining connections, as shown in Fig. 2. For condition A, it can be seen that distortion is low at frequencies above about 10 times fc, but rises as fc is approached and nears 1 percent in level below fc when the capacitor sees a large a.c. voltage.
From these data, it seems somewhat analogous to regard a polarized tantalum operated thusly as a capacitor shunted by an imperfect diode. The distortion it produces is even order, which is shown in the distortion photos in Fig. 3. Since the device's a.c. characteristic is asymmetrical, it appears that circuit means which tend to minimize the asymmetry also tend to minimize the distortion produced.
As John Curl showed [2], a simple parallel connection of like capacitors, as in B, reduces distortion appreciably. Compared to condition A, condition B reduces the distortion at fc by a factor of 2 to 3 (Fig. 2).
The series back-to-back connection of condition C can reduce .the distortion further, if the two capacitors happen to have complementing characteristics. The distortion products for condition C are also shown in Fig. 3 (at fc). However, it appears this particular connection depends strongly on the match of the specific units used. Also, unlike the connection of B, the series connection of C increases the net equivalent series resistance (ESR), which is usually not desirable as discussed later.
If the series connection is so effective, the logical question is, then, does polarizing bias applied to the junction help further? The answer is yes, with increasingly better results with more bias, as shown in conditions D, E, and F. However, even a relatively small bias, such as in D, is very effective, reducing THD at fc to 0.01 percent. This bias level is 5 V or just in excess of the greatest signal peak swing. The distortion for test condition D is shown in Fig. 3 at fc.
What this series of tests seems to say is that one should carefully control the a.c. signal developed across such a polar capacitor to minimize this distortion. If you use a simple single-capacitor connection with no d.c. bias, it appears that a just derating by a factor of about 10 times will minimize the distortion. In other words, if a given capacitor used for coupling is calculated to have an fc of 10 Hz, making it corner at 1 Hz will minimize the distortion produced by this particular mechanism. However, as alluded above, this is not the whole story, as the discussions later will show.
============
Capacitor Basics
A brief review of capacitor fundamental relationships is appropriate to a more complete understanding of the applications-oriented discussions of this article.
As can be noted from the physical diagram (Fig. B1), a capacitor consists of two plates or conductors separated by a dielectric or insulator and the whole is capable of storing electrical energy. Capacitance is determined by the area and spacing of the plates (dielectric thickness) and the dielectric constant which is symbolized by K. The K of a given material is a direct measure of its ability to store electrons as compared to air. Note that within a given size, capacitance can only be maximized by increasing K. Table BI is a short summary of some of the dielectrics used in audio work. As can be noted, all of the film dielectrics have relatively low Ks, while the remainder, such as aluminum and tantalum oxides, are quite a bit greater. This is the reason why a 10NF polycarbonate capacitor is so much larger than a 10pF aluminum or tantalum electrolytic for a comparable voltage.
All capacitors can be modeled electrically by the equivalent circuit in Fig. B2. The elements shown here are actually parasitic, with the exception of C, which is an ideal capacitor.
In practice a parallel resistance, Rp (sometimes called IR or Insulation Resistance), shunts C, causing leakage. Rp is both temperature and voltage dependent. A series resistance, R, (also often called ESR, for Equivalent Series Resistance) appears in series with C, limiting the minimum impedance. R, is composed of plate, lead, and termination resistances primarily. For high-current circuits, R, can represent a significant power loss, and it is desirably minimized. L represents the net inductance of the winding and leads. C is actually composed of C, and C2, where C2 and RDA comprise the dielectric absorption model (discussed fully in text). The losses in capacitors are described by the real and reactive impedances, as shown in the vector diagram triangle, Fig. B3, with the respective impedances as described by equations 2, 3, and 4.
In capacitor specification literature, the angles θ and δ are often seen. Both are used to represent losses, which can be described either by the term power factor (PF) or dissipation factor (DF). As equations (5) and (6) indicate, they are trigonometrically related.
An important point to be appreciated is that for very small values of R,, PF and DF are nearly the same. Note also that both PF and DF can also be expressed in percentage form, as DF (%), as noted in equations (7) and (8). Capacitor losses are also sometimes expressed in terms of Q or quality factor, a general figure of merit. Q is simply the inverse of DF, as shown in equation (9). The practical expression of this is that low DF capacitors have high Q. An appreciation for the interrelation of these various capacitor loss elements can be gained by regarding Fig. B4, a hypothetical capacitor impedance vs. frequency curve. At relatively low frequencies, the value of Z observed is equal to X, and follows the inverse relationship of equation (2). At some higher frequency, it reaches a minimum value, due to Rs. At this minimum impedance frequency, the capacitor actually acts as a series-resonant circuit, with maximum current limited only by R,. Note that only if the capacitor were truly ideal would its impedance continue to fall indefinitely with frequency. On a log-log scale, this is shown as a straight (non curved) descending line with increasing frequency (shown dotted in Fig. B4). It should also be noted that R, is both temperature and frequency dependent (although not shown here).

Fig. B1--Physical diagram of a capacitor.
C = (KA/d) (0.225 x 10^-12) farads
See reference 15 for a thorough discussion of C.

Table B1--Dielectric constants of typical materials.
Teflon through polyester are films.

Fig. B2--Equivalent circuit of a real capacitor. C = capacitance in farads,
L = inductance in Henrys, R. = equivalent series resistance in ohms, Rp
= parallel resistance in ohms, and C2 and RDA = dielectric absorption portion
of equivalent circuit.
Capacitor Terms
Capacitive reactance = Xc = ½ π fC (2)
Inductive reactance = X1 = 2 π fL (3)
(Note: equations 2 and 3 apply for sine waves-see text.)
Impedance = Z √[(R2 (XC+ XL)2] (4)
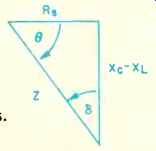
Fig. B3--Vector diagram of capacitor impedances.
Power factor = PF = cos θ = sin δ = RS/Z (5)
Dissipation factor = DF = cot θ = tan δ = RS/ (Xc-X1) (6)
Note: For relatively low values of RS, Z is approximately equal to X,-X1.Therefore, θ approaches 90 degrees and cos θ is approximately equal to cot e. As a result, PF and DF are nearly equal for low Rs values.
DF (%) = DF x 100 = 100 [Rs/(X,X1)] (7)
PF (%) = PF x 100 = 100 (Rs/Z) (8)
In practical terms, DF = PF with a discrepancy of under 1 percent for PF (%) values of 14 percent or less.
Quality factor or figure of merit = Q = (X,X1)/R = 1/DF. (9)
Example: A DF (%) of 0.1 percent in a capacitor results in a Q of 1000.

Fig. B4--Capacitor impedance vs. frequency.
A very interesting point which should be noted regarding equations (2) and (3) is that they specifically describe reactances for single-frequency, sine-wave conditions. In actual practice, music is comprised of a multiplicity of signal components simultaneously, and would be more accurately generally characterized as a transient waveform source.
As such, a transient pulse of period t is generally related to the f term more accurately, as f = 1/2t (10)
Note that for these conditions, we now must consider not only the fundamental frequency of repetition, but also all of the harmonics comprising the Fourier series with their exact phase and amplitude relationships if the waveform is to be transmitted accurately.
===========
Ceramic Capacitor Tests

Fig. 2--THD in tantalum electrolytics
as a function of corner frequency in a high-pass filter, various connections.
In a second series of tests, the distortion produced by a common ceramic disc capacitor was studied. Data in the form of the THD vs. frequency for this test are shown in Fig. 4. The first circuit used is a simple low-pass (LP) filter, with the capacitor under test as the shunt C arm. The values chosen for the test were R = 1K and C = 0.1 p F. A 100-V type was used for the capacitor.
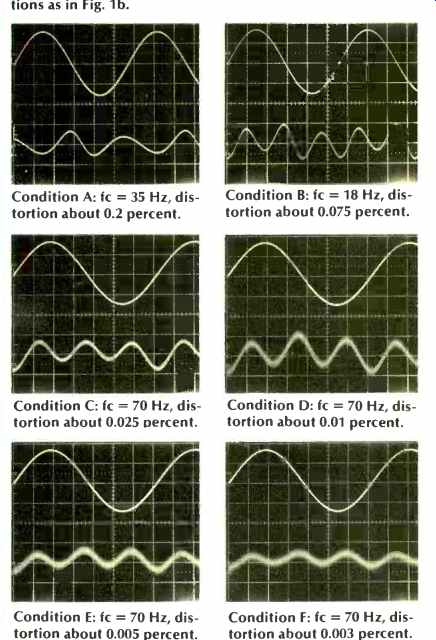
Fig. 3--Output vs. distortion photos for tantalum capacitors in a high-pass
filter, various connections. For each photo, top is filter output; bottom
is distortion products. Setup conditions as in Fig. 1b.
Condition A: fc = 35 Hz, distortion about 0.2 percent.
Condition B: fc = 18 Hz, distortion about 0.075 percent.
Condition C: fc = 70 Hz, distortion about 0.025 percent.
Condition D: fc = 70 Hz, distortion about percent.
Condition E: fc = 70 Hz, distortion about 0.005 percent.
Condition F: fc = 70 Hz, distortion about 0.003 percent.

Fig. 4--THD produced by a ceramic disc capacitor as a function of frequency
in low-pass and high-pass filters.
As the LP data show, distortion is produced well below the corner frequency, which in this case is 1800 Hz. The data shown are corrected, so the THD 100 percent set level follows the LP roll-off. Even as such, however, the higher harmonics are attenuated, and this data may be a pessimistic representation. An IM test might show even worse performance for this LP filter. Figure 5 shows the nature of distortion in 5a; as can be noted, it is third harmonic. By contrast, a polyester type inserted into the circuit shows no discernible distortion (5b). By placing the same ceramic capacitor in an HP filter circuit, the roll-off of harmonics can be circumvented. In this type of use, the voltage across the capacitor is highest at low frequencies. Thus nonlinearities will show up as higher harmonics, which are readily passed by the filter.
The data for the HP test show much stronger distortion at the lower frequencies, where the voltage is highest. We are not sure what should be interpreted as the common distortion-producing source in these two tests. One thing seems quite clear, however, and that is the simple fact that you cannot "work around" the distortion problem in ceramics.
Our feeling is that they should simply be avoided anywhere near an audio signal path and probably just avoided altogether for audio. For example, some listening tests have indicated that they can produce audible distortion when used as supply bypasses, let alone coupling! One obvious implication which emerges from the above is that a capacitor is not just a capacitor by any means. Of course, what we've discussed here are only two types of capacitors, and we really ought to make some general recommendations as to desirable types. This leads us more deeply into just what a capacitor is, and how this knowledge relates to audio.
Interpreting Capacitor Performance Data
One of the most important factors needed for a full and effective understanding of capacitor audio application criteria lies in interpreting data. Most of us have probably seen examples of impedance/frequency curves such as the one hypothesized in Fig. B4. However, considering such curves in the light of real data actually allows us to separate the men from the boys among capacitors and also shows us which ones to use for audio.
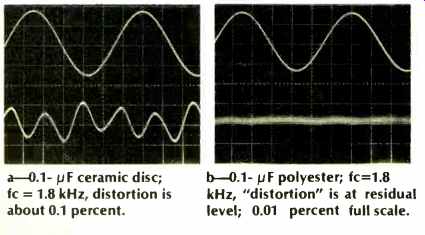
Fig. 5--Output and distortion photos for ceramic and polyester capacitors
in a low-pass filter circuit.
a--0.1pF ceramic disc; fc = 1.8 kHz, distortion is about 0.1 percent.
b--0.1pF polyester; fc=1.8 kHz, "distortion" is at residual level; 0.01 percent full scale.
Typical data of this nature for tantalum capacitors are shown in Fig. 6. Regarding this data and recalling the model of a real capacitor (Fig. B2), we see that under d.c. or low frequency conditions, Rs and L are negligible, compared to the C and Rp combination. As the frequency increases, particularly above a few kilohertz, the effects of both Rs and L increase.
In these practical cases shown here (one of which is typical of good-quality Ta units), it can easily be noted that X, does not follow the ideal capacitor--6 dB-per-octave pattern with increasing frequency.
Further examination shows that as frequency increases, X, tends to decrease, while XL increases in value. This of course means that the (X,-XL)z term of the Z formula gradually decreases until at some frequency, the term (X,-XL)2 disappears.
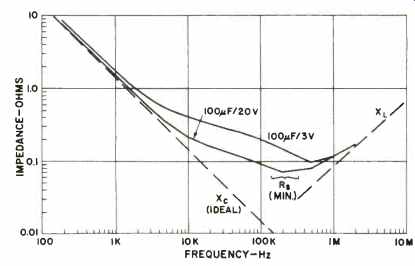
Fig. 6--Typical impedance vs. frequency curves for tantalum capacitors.
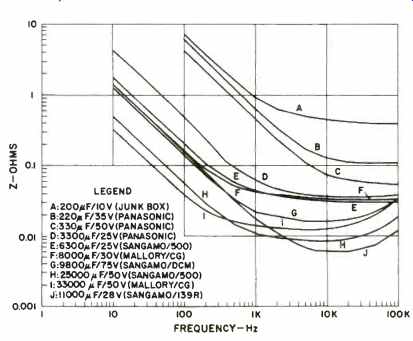
Fig. 7--Typical impedance vs. frequency curves for aluminum electrolytics.
Then the observed impedance is resistive or Z = Rs. This is the so-called series resonant frequency of the cap, which for tantalum and aluminum electrolytics will generally fall between 101kHz and 1 MHz. From this, it should be apparent that if a capacitor is operated at a higher frequency than this, it will no longer be a capacitor to the circuit.
Although the discussion thus far has treated only tantalum electrolytics, this pattern of non-ideal Z vs. frequency behavior is actually inherent to all real capacitors to some degree.
In the better quality dielectrics, Rs and L are lower and more closely controlled, and this is reflected in lower losses (DF), due to the lower parasitic parameters. This will be more apparent as we present data for other dielectrics.
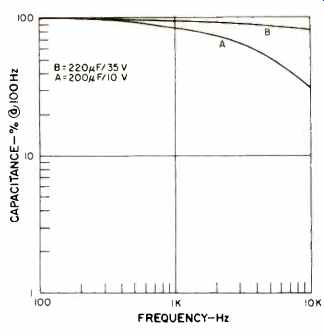
Fig. 8--Variation of effective capacity with frequency in aluminum electrolytics.
============


Fig. 9--Impedance vs. frequency for film capacitors using various dielectrics.
9a--Metalized polyester.
9b--Metalized polycarbonate. Material courtesy of Union Carbide.
9c--Metalized polypropylene.
9d--Parylene.
=============
Aluminum electrolytics show a quite similar broadly resonant frequency, where Z = Rs (or ESR). Data for a wide range of aluminum electrolytics are summarized in Fig. 7.
As can be noted from these data, the resonant frequency is typically between 10 and 100 kHz. Note, however, that the absolute level of impedance is much lower in the case of aluminum, due to the availability of much larger values. Also, many of the larger electrolytics are designed to handle large ripple currents and thus have very low values for Rs, as can be noted.
If these data are very carefully interpreted, a number of quite useful points can be drawn from it. Generally speaking, for two capacitors of similar value, the one with the higher voltage rating will show lower Rs (and DF, if viewed thusly). This can be seen, for example, between units A and B, as well as units F and G. And, it can also be seen in tantalum units (the two specific cases for comparison in Fig. 6 show this quite well). One might at this point ask what is the disadvantage of a relatively high Rs (or high DF) in a capacitor used in audio.

Fig. 10--Measuring capacitive impedance by oscillator and voltmeter method.
The answer can be had by regarding the data of Fig. 7 in a different light.
Using the capacitors A and B as illustrative examples, their actual effective capacitance values were calculated for various frequencies, using equation 4 to solve for C. The results, plotted in Fig. 8, clearly show the A unit (the higher Rs unit) to exhibit strong changes in capacitance with frequency. The B unit improves the situation relative to A, but still shows substantial capacitance change.
It is not at all hard to imagine how a capacitor whose value actually changes with frequency might distort an audio signal's integrity, particularly with regard to phase.
If we can visualize the complex frequency relationships of music passing through a capacitor (it doesn't really), while Z is simultaneously changing with the complex frequencies of the music, it is possible to appreciate how it can be relatively easy to upset the subtle harmonic/fundamental phase and amplitude relationships. Not only from the capacitance variation standpoint but also from the inductive behavior region.
Used as a coupling capacitor, the resulting effects of high DF (L or Rs) are image blurring, and instrument harmonics/overtones are less accurately reproduced, with a general overall veiling of the sound. Use in a feedback path further complicates the matter, because we are using this signal to provide error correction. For example, if we consider the general transfer relationship for an amplifier where the gain = Zf + Zin, it is easy to see that variations in Z with frequency which depart from the ideal will distort the relationship.
When we talk of film capacitor types, we find that the situation of less than ideal behavior regarding impedance vs. frequency is improved greatly. This is simply due to the fact that film dielectrics, such as polystyrene, polypropylene, polycarbonate, and polyester, have much lower dielectric losses. This is reflected in lower DF and Rs, as well as generally much more stable parameters with respect to frequency and temperature.
The impedance vs. frequency characteristics of a number of film-type capacitors are shown in Fig. 9. In general, it can be noted that they all show lower minimum impedances (lower Rs), and sharper dips around resonance. These points underscore the fact that the resistive losses can be much lower, in many cases below 10 milliohms.
Film capacitors also appear inductive above their series resonant frequency, due to inevitable parasitic inductance of the winding and/or leads. However, the inductive effects can be minimized, by suitable winding and termination techniques, which can extend the usefulness of a capacitor to substantially higher frequencies. Useful cues to look for in this regard are specified noninductive winding techniques and extended foil-welded-lead attachments.
=================

Table I--Voltage to impedance conversion chart, with notes for various test
conditions and using the circuit shown in Fig. 10.
Notes:
1) This scale applies to a separate 10-V source and a.c. voltmeter. The 1-V full-scale range is equivalent to 100-ohms full-scale range. (Multiply numerical reading X100 to get ohms.)
2) This scale applies to a Sound Technology 1700B or equivalent operated as a 3-V source. Use the "dB Volts" scale with
0.3 V rms equal to 100 percent. The 100-percent full-scale range is then equivalent to 100-ohms full-scale range and ohms are read directly.
3) The d.c. bias source, if required. Use input blocking capacitor equal to or greater than 100 NF, and OBSERVE POLARITIES!
4) On low ESR types, place the a.c. meter leads directly at the capacitor terminals for minimum lead length.
==================
Measuring Capacitor Impedance Values
Since the above points are so basic to optimum capacitor selection, it logically follows that most audio experimenters will want to have the capability to measure the various capacitor performance parameters. Since few of us have access to the necessary bridges (and if so, many of them can't measure Rs or DF), it seems necessary to devise a setup to measure these parameters. A setup we find most convenient to these purposes is shown in Fig. 10, and it was actually used to gather all of the data for Fig. 8.
This setup basically measures impedance (Z) by the voltage divider method, using a sine-wave generator and voltmeter. From the impedance data, C, Rs, L and DF can be derived. Table I and the notes describe the details of the procedure, which is written for either a bench voltmeter or an oscillator-analyzer combination. You should, of course, take appropriate precautions regarding bias voltages, polarity, and so forth. Also, be sure to use shielded leads on the voltmeter and connections direct to the terminals on low Rs units.
You will be pleased with how much power this simple little setup gives you in grading capacitors, particularly electrolytics. For example, you can use it to quickly weed out poor-quality units, such as A (a junkbox special). Given a few units of similar value, it is quite easy to select the lowest Rs unit, such as H versus I. If you use an audio oscillator and meter, you will most probably be limited to upper frequencies below 100 kHz or 200 kHz. However, you can use the same basic technique with a wide-range function generator as a sine-wave source and a high-gain scope as the readout device. This will allow testing of the smaller value film capacitors, which typically are series resonant at appreciably higher frequencies.
References
1. Hadaway, D., "Sources of Distortion in Preamps," BAS Speaker, Feb., 1977.
2. Curl, J., "Omitted Factors in Audio Circuit Design," 1978 IEEE Conference on Acoustics, Speech, and Signal Processing, April, 1978. Also published in Audio, Sept., 1979, p. 20.
3. Marsh, D., "Capacitor Fidelity," (letter) The Audio Amateur, 4/77.
4. Marsh, D., "Capacitor Caveats," (letter) The Audio Amateur, 2/78.
5. Marsh, D., and N. Pass, "Tantalum Capacitors: Yes or No?" (letter) The Audio Amateur, 2/79.
6. Bowling, E., "Look Out! All Electrolytic Capacitors Are Not Alike," Electronic Design, Jan. 4, 1974.
7. Cowdell, R., "Bypass Filters Extend to the GHz Range," Electronic Design, July 19,1977.
8. Belcak, S., "Specifying Electrolytics," Electronic Products, Dec., 1978.
9. Doubrava, L., "Proper Handling of Voltage Spikes Safeguards Circuit Designs," EDN, Mar. 5, 1979.
10. Von Kampen, T., and P. Reeves, "Consider Polypropylene Capacitors," Electronic Design, Sept. 17,1977.
11. Brokaw, P., "An IC Amplifier User's Guide to Decoupling and Grounding," Electronic Products, Dec., 1977.
12. Epand, D., and K. Liddane, "Selecting Capacitors Properly," Electronic Design, June 21, 1977.
13. Eimar, B., "Stretch Electrolytic Capacitor Life," Electronic Design, April, 1975.
14. Forssander, P., "Aluminum Electrolytics Are Hard to Beat," Electronic Design, Oct. 11, 1974.
15. Harper, C.A., Handbook of Components for Electronics, Chapter 8, McGraw-Hill, 1977.
16. "Parylene Film Capacitor Performance Data," Union Carbide Form F-2755.
17. "Film Capacitors," F-Dyne Electronics catalog.
18. "Precision Film Capacitors," PFC, Inc. catalog.
19. "Film Capacitors," Union Carbide catalog F-2871.
20. "Film Capacitors," Midwec catalog.
21. "X363UW Metalized Polypropylene Capacitor Technical Summary," TRW Capacitors.
22. Johnson, F.L., "Capacitors-What Are They?" Electro-Cube Technical Bulletin No. 1.
23. Johnson, F.L., "Capacitors-Capacitance Changes-Why?" Electro-Cube Technical Bulletin No. 3.
24. Johnson, F.L., "Capacitors-PF? DF? Q?" Electro-Cube Technical Bulletin No. 5.
25. Johnson, F.L., "Capacitors-Dissipation Factor," Electro-Cube Technical Bulletin No. 6.
26. Johnson, F.L., "Capacitors-The Metalized Dielectric-Friend or Foe?" Electro-Cube Technical Bulletin No. 9.
27. Johnson, F.L., "Capacitors-Dielectric Absorption," Electro-Cube Technical Bulletin No. 10.
28. Military Specification MIL-C-19978D. Capacitor, Fixed Plastic (or Paper Plastic) Dielectric, General Specification for.
29. Johnson, F.L., "Which Capacitor?" Marshall Industries, Capacitor Div., 1%5.
30. Buchanan, J.E., "Dielectric Absorption It Can Be a Problem in Timing Circuits," EDN, Jan. 20, 1977.
31. Buchanan, J.E., "Recovery Voltage Measurements with Emphasis Below One Second for Class I NPO Ceramic Capacitors," IEEE Transactions on Components, Hybrids, and Manufacturing Technology, Vol. CHMT-1, No. 1, March, 1978.
32. Dow, P.C., "An Analysis of Certain Errors in Electronic Differential Analyzers, Part II Capacitor Dielectric Absorption," IRE Transactions on Electronic Computers, Vol. EC7, March, 1958.
by Walter G. Jung and Richard Marsh* (adapted from Audio magazine, Feb 1980)
= = = =