By Richard J. Kaufman
The brain uses three major cues to determine the direction of sound. Relative loudness and phase (including arrival-time) differences between the sounds heard by the left and right ears are well known; they were mentioned in Blumlein's stereo patents of 1931. Stereo as we now know it depends on these two effects, but loudness predominates. Recording engineers generally use relative loudness alone to mix a "stereo" recording from multiple mono tracks, and some "image-enhancement" devices use phase differences to give a wider stereo image.
Frequency response is less well-known than phase or level differences in this regard, and has never, to my knowledge, been used by recording engineers to intentionally enhance the stereo effect. It was first brought to my attention by Denis Vaughan's article, "How We Hear Direction," in the December 1983 issue of Audio. Perhaps the effects of frequency response are more obscure than the other perceptual cues because the scientific work exploring this aspect of audio perception is relatively recent.
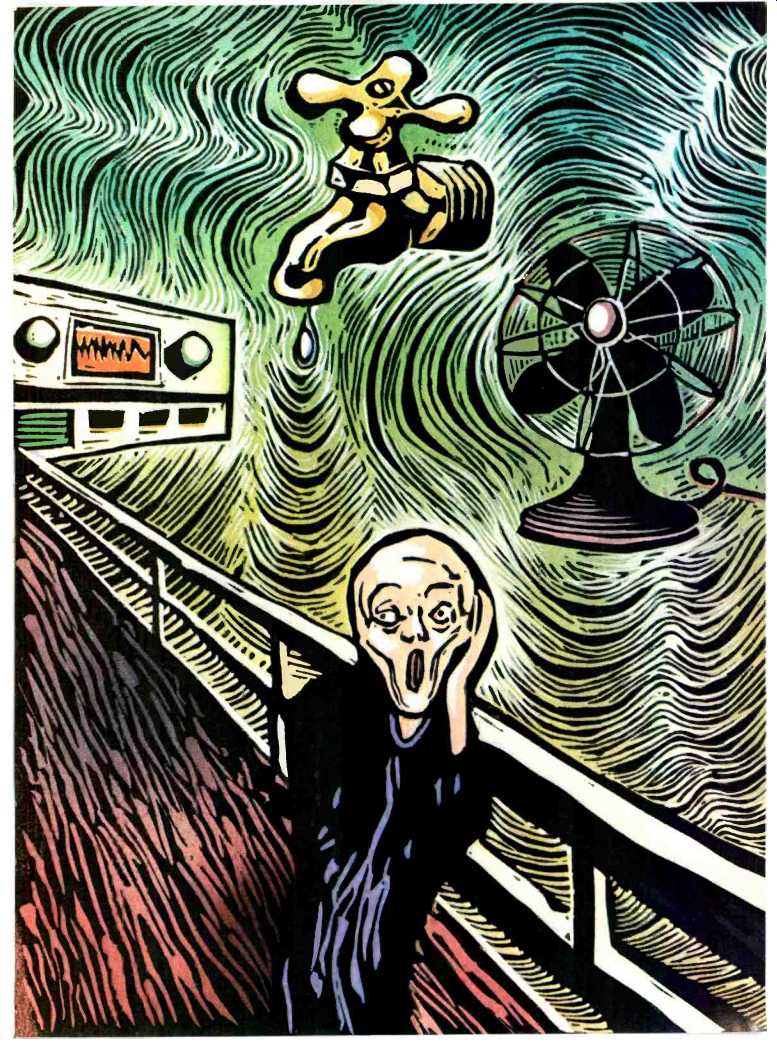
The fact is, the human ear's frequency response varies, depending on the direction of a sound's arrival. You can confirm this easily; listen to a source of random noise, such as a fan, a running faucet or interstation hiss on an FM receiver. Block one ear, and listen with the other as you turn your head. The tonal quality of the noise will change, depending on the direction from ear to sound source. The implication of this effect suggests a definite limitation in the ability of two loudspeakers to give a realistic illusion of an acoustic event.
However, it promises better sound reproduction if the principles behind the ear's localization of sound by frequency response can be refined and incorporated into the recording art.
My experiments along these lines indicate that not only is this possible, but that existing stereo recordings can be enhanced by the use of a relatively simple matrixing device and a 10-band graphic equalizer. This article will describe how to use frequency contouring to change the perceived source of a sound when played through a stereo system, and will show how to build the matrix.
Table I, reprinted from Denis Vaughan's article, shows how the ears' response varies at different frequencies, depending on the angle of arrival.
(In front of your nose is 0°, directly to the side is 90°.) These response curves are said to vary little between individuals.
The usual angle subtended by a pair of stereo speakers in a normal listening configuration is ± 18°, or slightly greater. (This means that if the speakers are separated by 6 feet, the listener is about 9 feet from the plane defined by the speakers. A ±36° angle would place the listener closer to the speakers than the distance between them, a situation that should be avoided. Although most setups place the listener somewhat closer than a 6-to-9 ratio, the difference does not appear to be significant in this context.) With the standard speaker setup, the stereo image is usually confined to the space between the loudspeakers, and it is most accurate for instruments whose apparent location is at the speakers themselves (i.e., monophonic information in one channel). With centered, or two-channel, monophonic information, amplitude clues tell you that the sound source is centered, but you are still constantly aware of where the loudspeakers are.
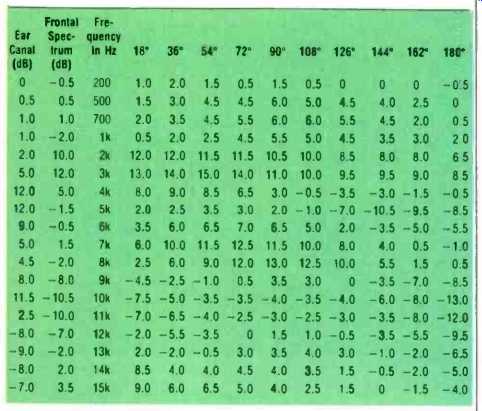
Table I--How the outer ear's response varies at different frequencies and
sound-source azimuth angles. (After Mehrgardt and Mellert.)
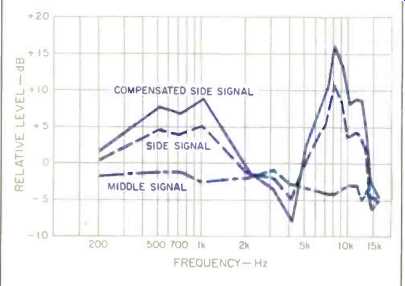
Fig. 1--Frequency contours for improved imaging with loudspeaker signals (see
text and Table II).

Fig. 2--Principles of the M-S (middle-side) matrix.
Therefore, my first experiment with frequency contouring involved altering the frequency response of a mono signal to make it appear to come from dead center, with no sense of speaker position, when played through a pair of speakers. (The same equalization can be applied in a studio mix-down, as when a vocal solo is mixed equally into he right and left channels. A vocal so mixed and equalized will seem to come from dead center.) For these experiments, I used the equalization settings shown in the "Middle" column of Table II. As Fig. 1 (a graphic representation of the information in Table II) shows, a four-band parametric equalizer might correct the response exactly. A third-octave equalizer would also be very good.
Pioneer was kind enough to lend me a 2/3-octave unit, the SG-90. It was almost as effective as a third-octave equalizer, and its controls were accurately calibrated. But even a 10-band graphic equalizer can give a fairly good fit to the desired approximation all you need do is set its bands to the levels indicated for those (or the nearest listed) frequencies in the "Middle" column of Table II. Your equalizer may well require different settings than shown in Table II or correct results. There are two reasons for this: First, you will have to take into account the degree of interaction between adjacent equalizer bands; your equalizer's manual should tell you the degree of interaction (if not, write the manufacturer and ask). Also, the dB scales on many inexpensive graphic equalizers are not accurately marked; corrections for this are shown in Table Ill. The relationship between indicated and actual response shown here is typical, and is caused by the common use of linear potentiometers for what is actually a logarithmic function. Note that the discrepancy is greatest at the center of the range, with indications becoming more accurate at the more extreme settings. For this reason, if your equalizer provides a maximum adjustment of ± 15 dB, it will still be fairly close to the figures shown, over much of its range. Using a spectrum analyzer would make these adjustments easier.
Again following Vaughan's data, I tried to contour a single-channel signal so it would seem to come from the listener's side, rather than from the speaker position, using the equalizer settings in the "Side" column of Table II. This also worked, though the apparent sound position was not a true 90°, probably due to either sound reflections in the room, arrival-time differences at each ear because of the 18° speaker placement, or both. At a friend's house, with Sonex acoustic foam behind the speakers, the sound did seem to be coming from the wall at my side, rather than from the front speaker wall. (The center image was already good without the Sonex.) This same equalization, applied to both channels of a stereo recording, gives a more spacious feeling to some material. With monophonic and some other stereo material, however, the "Middle" EQ settings give the best results you'll have to experiment.
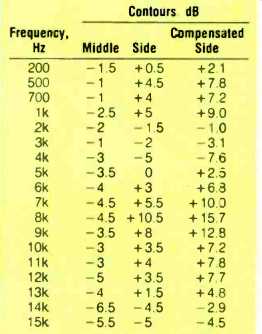
Table II--Frequency contouring equalizations for shifting apparent positions
of signals from normally placed speakers (± 18° from listener).
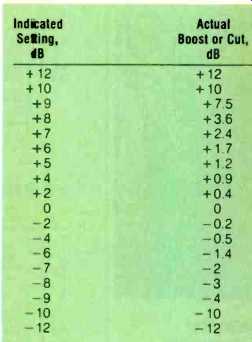
Table III--Indicated vs. actual settings of a typical home graphic equalizer.
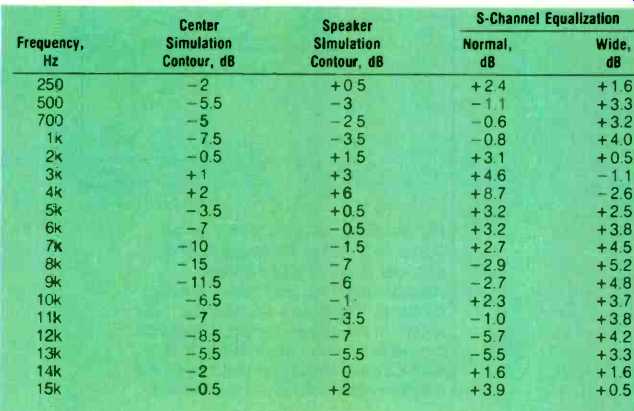
Table IV--Frequency contouring to prevent "in-your-head" effects
in headphone listening, with and without M-S matrixing (see text).
When mixing down multi-track recordings, apply the "Side" equalization to signals such as ambience or special effects to make them sound as if they originated at the extreme right or left. (This suggests that recording engineers will have a broad range of special effects available if they explore the uses of frequency contouring. It is even possible to make sounds seem to come from overhead, or behind the listener, by using the proper response contouring.) These effects are even better with headphones, although a different equalization is required (more on that shortly). Without room reflections or interaural interference, it should be possible to mix some stunning tapes for playback on headphone-equipped personal portables.
Most audiophiles do not mix their own music; a way to use frequency response contouring to enhance existing recordings is also desirable. This can be accomplished with a technique known as M-S (middle-side) matrixing (Fig. 2); Fig. 3 shows schematics for building such a matrix, for which a Parts List is also provided.
In M-S matrixing, the right and left signals are summed to give a middle (M) signal, the one we wish to contour to give the illusion of true center origination. Subtracting one channel from the other gives a side (S) signal, which we wish to shape so that it will appear to come at 90° from the sides. By properly remixing the M and S signals, separate right- and left-channel signals are again attained, but with a frequency response which provides more realistic ambience and wider imaging when played through a typical stereo system.
To do this, we apply Table II's "Middle" equalization to the M signal, and either the "Side" or "Compensated Side" contour to the S signal. Using the "Side" equalization will emphasize hall ambience but narrow the sound stage, while the "Compensated Side" contour will widen the sound stage.
What is being compensated for, in the latter case, is the interaction of the "Middle" and "Side" curves when the M and S channels are matrixed back into left and right stereo signals. Since each matrix channel includes both left and right information (M = L + R, S = L - R), the left-only and right-only signals are acted upon by both the M and S contours.
When the signals are added back together, the results are not as desired.
The "Compensated Side" contour includes a correction so that, when the M and S signals are added, side signals will have the proper contour for 90° localization.
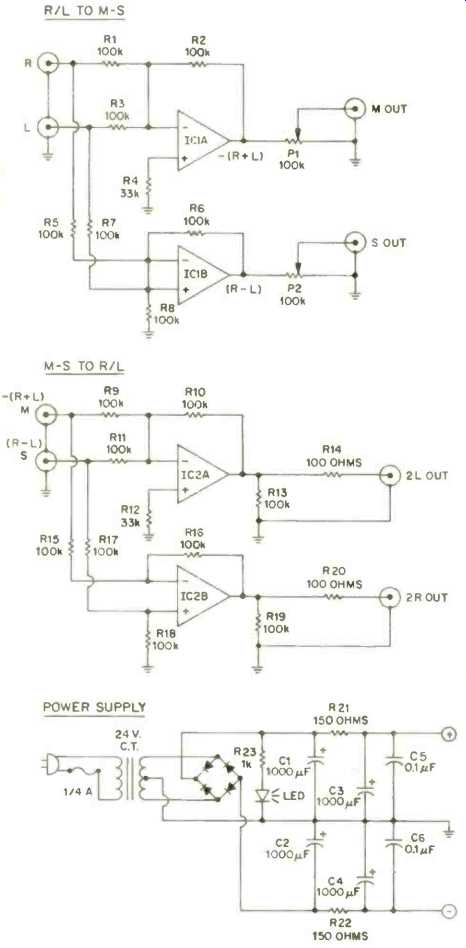
Fig. 3--Schematic diagrams for an active M-S matrix: Right-left to M-S encoder
(top), M-S to right-left decoder (center), and power supply (bottom). Capacitors
C5 and C6, shown in the power supply, should be mounted as close as possible
to IC1 and IC2 and should be used even if a different power supply is connected.
If any required adjustment is beyond the range of an ordinary equalizer, use the maximum cut possible at that frequency.
Contouring for Headphones
Frequency contouring is even more effective with headphones and provides more normal sound perspective, without the typical "in-your-head" imaging problems. But headphones require different contouring than speakers, since the actual sound sources are at ±90° rather than ± 18° relative to the listener. Table IV shows the contours for use with headphones to give the illusion of sounds originating from different angles.
One might expect that, due to the phones' contact with the outer ear, these figures might not be strictly accurate, because the sound is no longer acting on the entire pinna of the ear.
However, for both over-the-ear and on the-ear headphones, they work. In-the ear phones are a different matter; a sound source in the ear would not interact with the contours of the outer ear (pinna), and would probably require a different sort of correction. (I've had no opportunity to experiment with these devices.) For use without an M-S matrix, the "Center Simulation Contour" settings will make signals sound as if dead ahead (though with some loss of high frequency information), while the "Speaker Simulation Contour" will place sounds as if coming from the normal ± 18° loudspeaker setup. To make recordings specifically for headphone use (an attractive idea, now that headphone portables are so common), apply the "Center Simulation Contour" to both channels.
With an M-S matrix, use the "Center Simulation Contour" on the M channel and the " Normal" equalization on the S channel. Contouring the S channel with the "Wide" equalization will produce a wider sound stage; information that appears only in one stereo channel will then sound all the way to the listener's side.
Results in all cases, for both headphone and speaker listening, will depend greatly on the microphone and mixing techniques used in the original recording. When listening through speakers, results will depend upon your speakers and your room acoustics as well.
====================
Parts List:
R1 through R3, R5 through R11, R13, R15 through R19-100-kilohm resistors (exact value not critical, but must be matched within 1%). R4, R12-33-kilohm resistors.
R14, R20-100-ohm resistors.
R21, R22-150-ohm, 1/2-watt resistors.
R23-1-kilohm, 1/2-watt resistor.
P1, P2-100-kilohm potentiometers.
C1 through C4-1000-µF, 25-V electrolytic capacitors.
C5, C6-0.1 µF, plastic-film (Mylar) capacitors. (Mount on same board as IC1 and IC2, as near to them as possible.)
IC1, IC2-TL072CP. D1-Bridge rectifier.
T1-24-V, center-tapped transformer, 85 mA or more.
Miscellaneous: 1/4-A fuse and holder; eight phono jacks, general-purpose p.c. board, LED, mounting hardware, and wire.
A kit of the required, 1%-matched resistors and op-amps is available from Brunswick Tape Media, 580 Eighth Ave., New York, N.Y. 10018 for $8 (plus New York sales tax, where applicable). All other parts are easily purchased locally.
====================
Building and Using the M-S Matrix
Figure 3 is a schematic diagram of the M-S matrix. Construction is relatively simple, and the parts count is low.
Anyone who has built one of the old Dynakits or anything similar should have no difficulty assembling the device on a general-purpose p.c. board.
The hardware is available at Radio Shack. The resistors, however, must be 1% tolerance, to maintain the frequency response within 1 dB of that desired. (See Parts List for availability.) You may add 4.7-µF decoupling capacitors at the outputs if you wish; I have not found the small amount of d.c. offset produced by this circuit to cause a problem with any equipment I've used.
I installed my first prototype in the chassis of a graphic equalizer, hooking into its power supply. You can do the sane, or you can use any suitable power supply that gives between ±6 and ±8 V instead of using the power supply shown in Fig. 3.
An added bonus of the matrix is that it allows you to change the relative amounts of middle and side signals, and so change the balance and perspective of a recording, improving some material where the original miking was not ideal.
Another use for the M-S matrix is for noise reduction on FM stereo broadcasts. The M-S matrix is identical to that used for encoding FM signals; most of the noise due to multipath interference is in the R L, or side, signal By attenuating the frequencies above 4 or 8 kHz on the side signal only, it is possible to significantly reduce noise while maintaining stereo separation in the midrange, and preserving high-frequency information in the middle signal.
M-S frequency response contouring gives broader and more localized imaging with many recordings. Center information is less blurred, more sharply focused. Side information can be so sharpy defined that one thinks there are extra speakers in use; some listeners have searched my listening room, attempting to find them. With headphones, the music no longer sounds as if it were inside your head, but moves out and toward the front where it belongs, while still retaining the detail and intimacy characteristic of headphone listening. While it may not be suitable for all material, the matrix was very effective with popular and rock recordings.
Perhaps the most exciting use for frequency response contouring is not enhancing existing music, but in creating new works. I have used a computer to develop an extensive series of tables and graphs to aid in such efforts.
The results are available, together with a demonstration tape, from Brunswick Tape Media, 590 Eighth Ave., New York, N.Y. 10008. Please enclose a check for $15 (plus sales tax in New York) to cover the cost of materials and handling.
(adapted from Audio magazine, Feb. 1985)
= = = =
Also see: The DNR Noise Reducer: How it Works and How to Build it. (Feb. 1985)