
Some years ago, when Joan Sutherland had recently burst upon the musical scene
and Grand Opera was new to television, I had just settled back to watch and
hear a TV network broadcast of an opera starring the aforementioned lady. The
credits were run and the opera was started-whereupon my enjoyment was rudely
marred by an unusual occurrence: each time just before Miss Sutherland began,
her actual line was preceded by an echo, fainter but very clear, of what she
was about to sing. After she stopped, the echo was also to be heard, but it
was much less audible and almost unobtrusive. Some of the instruments had audible
echoes, but not all of them, and the male singers were not appreciably affected.
My professional curiosity temporarily overcame my desire to enjoy the opera, and I moved closer to the set to examine the picture in detail. No disturbance in the stability of the picture could be seen, indicating that the TV synchronization signals were not affected. Also, there was no trace of "ghosting" at all, indicating that the video was totally unaffected. The tape, however, had about the worst case of audio print-through which I had ever observed in a professional setting, but since the whole tape had gone through the same conditions, why were certain parts of the signals disturbed and not the others?
Print-Through or the Printing Effect
All these things are not as mysterious as they may seem at first. In this article I hope to relieve some of the mystery about this effect, and show how tapes can be stored so as to keep the problem below the annoyance level of audibility.
Contact transfer of signals from layer to layer occurs in wound magnetic tapes mostly as a result of temperature cycling or exposure to external magnetic fields. The transferred signal is a function of the original signal wavelength and strength, the temperatures and magnetic fields to which the tape is exposed, the time of exposure, and the time since exposure. It happens to all tapes in storage, and since the storage conditions can be controlled, the amount of printing can be controlled as well. Printed signals are an annoyance in audio tapes, but contact printing is the basis of a growing video tape duplication business.
Printed signals can be partly erased without disturbing the original signals to any great extent. Two companies showed how this could be done with an altered tape machine. At least one company made a print-through eraser for sale, and another had such a device designed in the laboratory. None of them were in existence very long. One problem was that recordists-both professionals and amateurs-were wary of doing anything which had even a slight possibility of erasing even a tiny part of their valuable recordings! Another was that tape materials underwent improvement and better storage conditions were employed, thus relieving the problem to some extent. Even with the improvements, it can certainly still occur, and the magnitude of annoyance depends strongly on how your tapes are stored.
Two Kinds of Printed Signals
There is a decided difference between the printed signals created by thermal effects and those caused by the impression of external magnetic fields (or other causes). The thermally-caused print is unstable with time and is easily erased, while the magnetically-caused print is almost as stable as a recording made on a machine and does not erase much more easily. It is thus much more important to keep magnetic fields away from your tapes than to keep them thermally comfortable. It requires only a fraction of the magnetic field to cause magnetic transfer that it does to erase signals already on the tape, so preventing magnetic transfer of signals will also ensure that you will have no other problems caused by stray magnetic fields.
Time and Temperature are the Enemy
Figure 1 is a plot of the print -through vs. time of a tape at constant ambient temperature (solid line). The dotted lines are the time plot of the printed signal amplitude after the original signal (master) is removed from the vicinity of the part of the tape having the signal printed on it (slave). The information for this figure is taken from several of the first papers on print-through--the tapes were of 1950 vintage, and the numbers may be somewhat exaggerated for the present day. In addition, different tapes will have different slopes and positions of the lines, so the numbers should be taken as indicative of the effect and not to apply to any particular tape or situation.
Print is Log -Linear vs. Time
In Fig. 1 and all other plots of the printed signal, the printed signal level is referred to the master signal level in dB. The reason that we can do this without stating the master signal level is that print -through is dB -linear, i.e., it doesn't matter what the master signal level is, under the same conditions the printed signal level will be the same number of dB below it. A dB (decibel) is a logarithm, and you will note that the time is also plotted logarithmically. Such a log -log plot is a very powerful method of simplifying things so that laws or rules of behavior can be perceived in a glance. One must use caution in interpreting such a plot, however, since there is a strong temptation to simplify things too far.
Masters and Slaves
Two tapes are placed in contact. The master has a signal on it, while the slave has been erased. The master could simply be one turn of tape wound on a reel, and the slave is the adjacent turn (either outside or inside). After they have been in contact for five minutes, they are taken out of contact (point "A" on Fig. 1). The printed signal is then measured at intervals, and the curve dropping down from "A" is plotted. Note that the time is not restarted at zero when the slave is removed from the master, but it keeps increasing. If the experiment is repeated, but printing process is allowed to go for a week before it is interrupted, the change is made at point "B." The shape of the resulting decay curve is nearly the same, but there is a large practical difference. In each case, there is an immediate drop of 2 dB or so, and then the rate slows. In the decay curve starting at "A," there is a 6 -dB drop in about three minutes, but it requires nearly a week for the decay curve starting at "B" to drop by 6 dB. The reason for this is that time is changing about 2000 times as fast at "A" as it is at "B." If those decay curves are re-plotted starting at zero (or near zero) when the slave is removed from the master, the shape of the curves is so different that they hardly resemble each other. In each case, the final rate of decay (after separation) is about the negative of the rate of print signal increase (before separation). There is some advice about print -through on tapes which says that one should rewind tapes about 10 to 15 minutes before they are to be played, the purpose being to let the print signals decay previous to playing. This has an element of truth to it, but only for printed signals which are just a few hours old. If printing has been in progress a long time, decay also takes a long time. If tapes are to be in extended storage, they should be rewound once every few months (or once a year) to allow the printed signals to decay. It is better to wind just once, so that the old inside end is now the outside end. This prevents the tapes from being wound back into exactly the same geometrical arrangement as before (actually, there is not much chance of this when both ends are free from attachment to the reel). When rewinding, fast wind is satisfactory insofar as print -through prevention is concerned, but the pack will be smoother, with less distortion to the tape, if the wind is done under normal playing conditions.
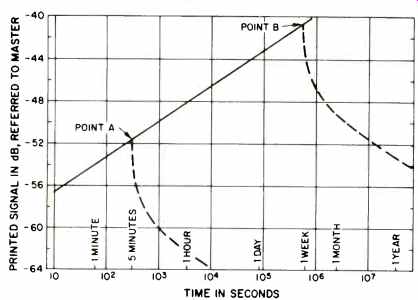
Fig. 1--Print-through vs. time at a constant ambient temperature (solid line).
Dotted lines show the time decay of the printed signal after contact is lost
between slave and master tapes. (Data from Lippert', Daniel and Axon', and
Westmijze'.)
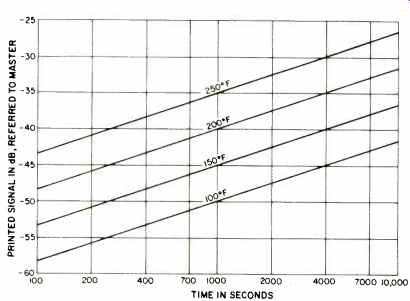
Fig. 2--Increase of printed signal with time, with curves shown for four different
temperatures. Data from Daniel and Axon, Westmijze, and Johnson.
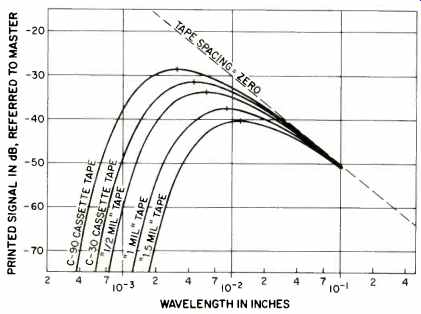
Fig. 3--Printed signal vs. wavelength for a number of different tape thicknesses.
Data from Daniel and Axon.
Log-Linear vs. Temperature
Figure 2 illustrates the simple relationship of printed signals vs. time, with temperature as a parameters, 71 8. For any given set of temporal conditions, the logarithm of the printed signal is a linear function of the temperature. This particular tape has print -through which increases about 5 dB for every 50° F. The slope vs. time is somewhat different from the tape whose characteristics are shown in Fig. 1. Different tapes have different slopes and also different spacing between the isothermal lines (lines of constant temperature), but most are not too far away from the one whose characteristics are shown.
Thus, another rule: Letting your tapes get hot is a definite detriment. The practice of letting cartridges and cassettes stay in a car in the hot summer sun is especially bad. I keep mine in a carry -case and remove them when I leave the car for any length of time during hot days. The print -through caused by exposure to heat remains when the tape is brought down to room temperature, and it is considerably more stable than print obtained near room temperature.
Geometry
There are some geometrical effects which are quite important. It seems logical that the printed signal would be strongest in the adjacent layer of tape, and this is true. However, not obvious at all and difficult to explain is the fact that the printed signal which comes off the reel in the layer before the master signal (pre-print) is stronger than the printed signal which comes off the layer after the master signal (post -print). Since the printed signal is strongest in the closest layers, one might also guess that a thin tape would have more print -through than a thick tape (since the nearest slaves are closer), and this is true. Lastly, since everything concerned with tape recording seems to be a function of the wavelength of the signal on the tape, we are not really surprised to find a strong functional relationship of the print to the wavelength. The signal wavelength (A) and the head to -tape speed (S) are related by the signal frequency (f):
lambda=S / f (1)
so, given any two of the three, we can find the other.
Figure 3 shows the wavelength effects on the printed signal for a number of different tapes. The position of the curve on the plot is controlled by the overall thickness of the tape, which is taken as follows:
Individual tapes will differ somewhat from these values, but this will not alter the conclusions to be drawn. The peak of each of these curves occurs at a wavelength of:
lambda = 2 pi d (2)
where X is the wavelength, as before, and d is the overall thickness. The tick on each of the curves indicates this peak value.
Ear, Ear
As far as the tapes are concerned, this is about the whole story on the wavelength response of the printed signal, but as far as the ear is concerned, we're not finished. The ear hears frequencies, not wavelengths. Using equation (1), we can construct a table of frequencies where the maximum print -through occurs as a function of the various tape speeds used (Table I). The ear normally hears print at a moderately low level. At such a level, the loudness response of the ear is approximately ± 3 dB from 500 Hz to 6000 Hz, and the most sensitive at about 3000 Hz. With this in mind, one can look at Table I and see just where the problems are. Obviously, no one should ever use "1f2 mil" tape at 15 ips.
Equally obvious is the fact that "1 1/2 mil" tape at 1.875 ips will not cause trouble. Commercially recorded tapes are usually on 1 mil base, with reel-to-reel tapes usually running at 7.5 ips and cartridges at 3.75 ips. Note that all but one (2632 Hz) of the frequencies listed are within the fundamental range of the singing voice and also many of the orchestral instruments.

Table I--Maximum print-through frequencies as a function of tape speed.
Working from the 40 phon loudness contour of the Fletcher-Munson curves, I have calculated the actual loudness level of the peak printed signal for each of the cases in Table 1I, and they are listed in Table II. The least objectionable case is used as a reference, so the larger the number, the worse the print -through (for any set condition of the time and temperature cycling). With the levels in dB, they can be compared to each other by subtraction. For instance, a "1 mil" tape cartridge at 3.75 ips is 4 dB better than a "1 mil" recorded tape at 7.5 ips.

Table II--Loudness levels for the cases in Table I, calculated from the 40-phon
loudness contour of Fletcher & Munson.
Pre-Print and Post-Print
Some old reel-to-reel tape machines wind their tapes with the magnetic material to the outside of the reel. This is known as an "A" wind. Almost all modern machines wind their tapes with the magnetic material to the inside of the reel, and this is known as a "B" wind. All cassettes and cartridges use an "A" wind so as to expose the magnetic material to the heads (which are on the outside). All of the material here concerning pre-print and post -print assumes a "B" wind. The effect of having an "A" wind is to exchange everything said about the pre-print with that said about the post-print.
Figure 4A shows some of the magnetic field lines coming from a bar magnet which is fairly wide (in the direction perpendicular to the page). This bar magnet resembles a long wavelength signal on a piece of magnetic tape ("long" is with respect to the coating thickness of the tape). The two arrows, labeled "H" and "V," designate the "horizontal" and "vertical" directions. In general, each field line at any point, consists of both horizontal and vertical components.
The horizontal and vertical components of the magnetic field lines are shown separately, and this separation is crucial to understanding the pre-print and post-print differences.
Note that the lines nearest to the center of the magnet are mostly horizontal, while those nearest the ends of the magnet tend to have stronger vertical components.
In Figure 4-B, three of the outer layers of tape wound on a reel are shown. The middle layer (the master) is the only one containing a recorded signal. It has the bar magnets (long wavelength signal) laid end -to -end, and this accentuates the effect of the vertical field lines being near the ends, and the horizontal field lines being near the magnet centers. Only the strongest parts of the vertical lines are shown. If the conditions are such as to cause printing, note that the front or playing side of the outer slave is printed from the back side of the master, while the back side of the inner slave is printed from the front of the master. Since the front side of the master was nearer the head when the signal was recorded, and thus has a stronger signal, a difference in the two printed signals is introduced, which should depend on the shape of the field from the record head. This difference turns out to be small, on the order of a dB [10,12] and is obviously not the cause of the difference between the preprint and the post print, which sometimes is as large as 12 dB [11, 12].
Figure 4-C shows the same situation, but with the strongest part of the horizontal field lines shown. Again, the field lines in the slaves can be caused to print a signal there.
We assume now that the signals have been printed on the slaves, and in 4-D we remove the master and show the printed signals, along with the field lines they produce. The field lines from the horizontal printed signals are shown separately from the field lines coming from the vertical printed signals. Actually, at any point the field lines add (or subtract) vectorially. The shape of the field lines from both H and V signals are similar. Mostly subtraction occurs near the playing side of the inner slave, and mostly addition occurs near the playing side of the outer slave. Thus, the pre-print, which comes off the outer slave, is stronger than the post-print.
The above is modified by several things. For one, some tapes are made so that vertical signals are printed poorly, if at all. In this case, the two printed signals are nearly equal. If the printing can be done equally in both H and V directions, the post -print nearly disappears, and the pre-print increases by about 6 dB. Another is that the actual master signal is not as simple as drawn-real recorded signals change direction and amplitude along their length. A third goes back to something previously stated: In case the tape is wound with an "A" wind, everything is reversed, and the post -print is stronger than the preprint.
I have used primarily the explanation given by Daniel [11] for this pre-print/post-print explanation. Greiner [10] was substantially correct in his explanation, but his diagrams were quite complicated. Apparently, neither Daniel nor Rhodes [12] were aware of Greiner's somewhat obscure paper when they wrote their reports.
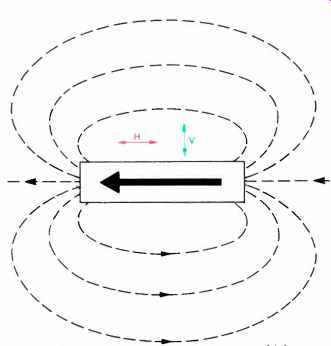
Fig. 4A--Field lines coming from a bar magnet which is wide in the direction
perpendicular to the page.
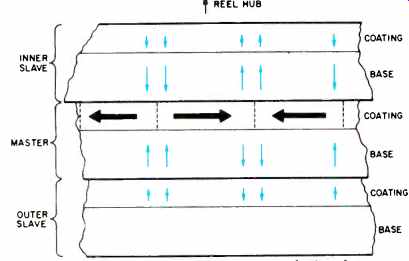
Fig. 4B--Master tape with long-wavelength signal, showing vertical field
components in two adjacent slave tapes. After Daniel.
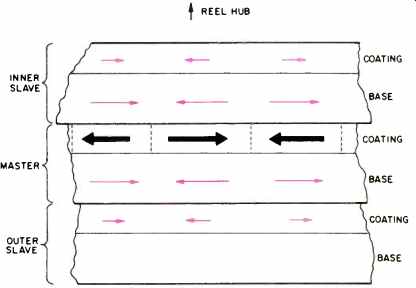
Fig. 4C--Master tape with long-wavelength signal, showing horizontal field
components in two adjacent slave tapes. After Daniel.
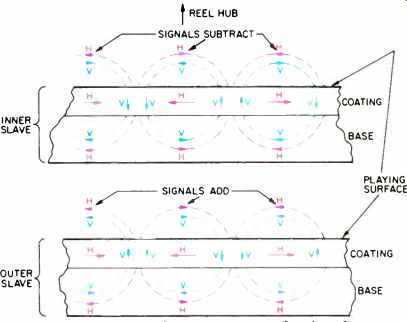
Fig. 4D--Slave tapes with master removed. Printed vertical and horizontal
signals are shown, with field lines from the vertical and horizontal signals
shown separately. Note how signals add on the sides closest to the master and
subtract on the sides away from the master. After Daniel.
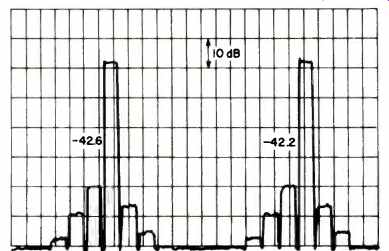
Fig. 5--Typical chart recording of a print-through measurement. Vertical
scale is in dB, and horizontal scale is time.
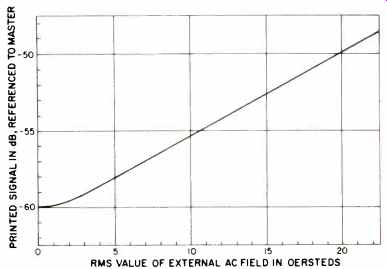
Fig. 6--Printed signal due to a superimposed a.c. field. (Data from Daniel
and Axon.)
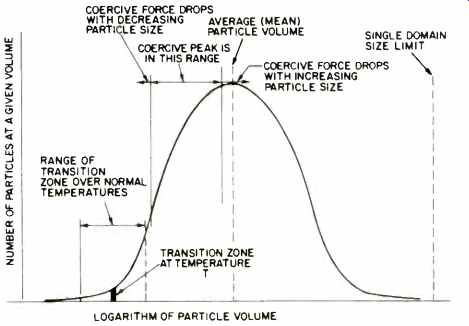
Fig. 7--Typical size distribution curve of fine particles as used in magnetic
recording tape , showing position of transition zone for normal operating temperatures.
Winding Tension
One might wonder whether the tape winding tension has any effect. Daniel and Axon6 reported that the tension increased the short-term print -through, but when the printing took place as long as overnight, there was essentially no difference between high and low tension.
The time decrease of the printed signal after the slave was removed from the master was also affected, with the higher tension winds taking longer to fade, and fading away stops at a higher level, thus showing more stability.
This tells us that print -through caused by strain is different from that caused by thermal effects. Rhodes was able to cause print -through, by pressing master and slave between rollers brought together by an hydraulic press. The time of contact was a small fraction of a second. Essentially, high tension or high pressure in the tape pack will cause a small increment of print -through, but this is overwhelmed by thermally -caused print in a matter of a few hours. Nevertheless, the strain -caused printed signal is more stable than the thermally -caused print, and some remnant of it can be observed as the thermally -caused signal fades away.
Standard Print -Through Measurements
Print-through measurement is normally done on a few feet of tape wound on a 4 1/2 in. diameter precision (metal) hub. The tape is thoroughly erased before starting. The "worst case" frequency is calculated by:
f=S+gird (3)
which is a combination of equations (1) and (2); the letters represent the same quantities as before. The tape speed S is normally kept high (7 1/2 or 15 ips), so that the decay time before measurement is kept to a minimum. A few turns of tape are wound on the hub, then a signal of a frequency given by (3) is applied for a time slightly less than that required for the hub to turn one revolution.
About 15 or 20 more turns of tape are put on, and the procedure is repeated once or twice more. The tape is then cut, and the piece on the hub carefully wound onto another hub, so that the tape coming off will be going in the same direction as when it was originally recorded.
The signal is normally at the 1 percent (nominal) distortion level, and it is a sine wave. The standard heat treatment is for four hours at a temperature of 150° F, and the treated hub is cooled to room temperature before measurement. The signal from the tape is run through a bandpass filter to improve the signal-to-noise ratio, and the tape is played back at the original recording speed.
The output from the filter, which is set at the proper frequency for the tape under test, is sent to a chart recorder with a logarithmic scale. The chart recorder normally has a dynamic range of at least 80 dB, so that all signals, including the master signal and three or four post -print and pre-print signals, can be seen on the same scale. Repeatability of measurements is normally about ± 1 dB. Figure 5 shows a typical measurement from my lab. The pre-print, which is the one usually quantified, is a mediocre -42.4 dB (average for two measurements) for this tape, and the post -print is some 6 dB less than that. The tape noise caused that wiggly line just below the bottom line of the chart.
Printing by External Magnetic Fields
Exposure to magnetic fields can cause some relatively enormous print -through. Fortunately, the fields required to produce such printed signals are large compared to the fields in which a reel of tape is likely to be immersed. In contrast to the temperature-caused print-through, which uses a mode of magnetization called thermo-remanent magnetization, the print-through caused by a.c. magnetic fields uses a type of magnetization called an hysteretic magnetization. This is also the type of magnetization used by most audio recorders. There are a number of descriptions of this type of magnetization in the literature, but one written specifically for hobbyists was published in 1976 [13]. Figure 6 shows how print is influenced by the presence of an a.c. magnetic field. The figure is redrawn from the paper by Daniel and Axon [6].
They stored the tape for a total of five minutes, during two minutes of which it was rotated in an a.c. field of the value shown. The numbers are the rms values, the peak fields being higher by a factor of 2. After a field of about 5 oersted is reached, the level of the printed signal in dB is nearly a straight-line function of the applied a.c. field, with a fairly high slope. The field required to produce audible print -through is greater than will normally be found in the home, and can easily be avoided. Table Ill gives typical fields from various sources, and shows that a little care is all that is necessary to avoid problems from magnetic fields.
D.C. fields can give print -through too, but are not nearly so effective as a.c. fields. The earth's field is about half an oersted in intensity, negligible where magnetic recording tape is concerned. In giving values for magnetic fields, gauss and oersted are interchangeable if the field is in air or vacuum. Gauss is the name for the unit of magnetic flux density, and oersted is the name for the unit of magnetic field strength. Both these terms are outmoded by the newer international units, but both are still in commercial use in the U.S.
Unpuzzling the Print Effect
What causes print-through? This was a considerable puzzle for a while. It was well-known that a magnetic material could be magnetized by heating it above its Curie temperature (the temperature above which it is not ferro-magnetic) and cooling it in a magnetic field. The only trouble was that the Curie temperature (Tc) of iron oxide was known to be so high that the tape would have been destroyed. A number of magnetic "after-effects" had been described for bulk materials, but they didn't seem applicable to the fine particles used in tapes. Then, in 1959, two researchers from the General Electric Research Laboratory wrote a paper about fine magnetic particles which gave the essential clues to what was going on [14].
They were working on permanent magnet materials, and did not mention magnetic tape print through in the paper, but gradually all the magneticians working in magnetic tape recording realized that the answer was here.
The explanation goes something like the following. All bulk ferromagnetic materials have their magnetism arranged in small volumes called domains, all about the same size. If the material is completely magnetized, all the magnetic vectors from all the domains point in the same direction and add together. If the material is demagnetized, the magnetism is not removed, but the directions of the domains are randomized, so that they add up vectorially to zero for the whole piece of material. In fine particle magnetics, the particles are so small that there can be only one domain per particle. These particles are known, interestingly enough, as single -domain particles. A single -domain (S.D.) particle cannot be demagnetized, though a collection of them can. The collection is demagnetized by randomizing the magnetic vector directions (the directions can be changed, or "flipped," in the particles). Single-domain particles are normally used in magnetic recording tapes.
The temperature scale for this discussion is the Kelvin or absolute temperature scale. A degree Kelvin is the same size as a Celsius degree, but the zero point is at absolute zero, which places the freezing point of water at about 273° K, and room temperature at about 293° K. There is a quantum of energy associated with the Kelvin temperature by the following equation:
E = kT (4)
where E is the energy quantum, T is the Kelvin temperature, and k is Boltzmann's constant (k = 1.38 x 10 16 erg per degree). An erg is a very small amount of energy-it takes about 2000 ergs to lift a penny one centimeter! Equation (4) defines an amount of energy which is the average amount of energy possessed by a single gas molecule when the gas is at temperature T (in degrees K). In a solid, the energy causes vibrations in the crystal lattices; in a suspension of colloidal particles in a liquid, it causes Brownian motion of the particles. In a resistor in an electronic circuit, the noise voltage ("Johnson Noise") is related to kT in a simple way. As you can see, kT is a very fundamental quantity of energy.
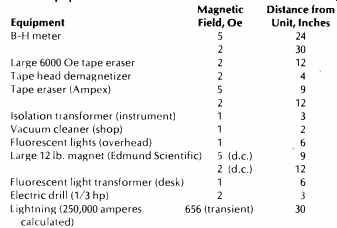
Table III--Measured fields from various magnetic and electronic equipment.
Getting back to our S.D. particles, each one of the particles has a magnetic energy associated with it which is easily calculated and which depends on the material and the volume of the particle. As the particles get smaller, the magnetic energy gets smaller, going down with the volume. At some point where the magnetic energy is in the same range as the thermal energy, the particle becomes magnetically unstable, and its magnetic vector begins to wander around randomly. Bean and Livingston [14] say that this instability transition occurs at about the point where the magnetic energy is about 25 times the thermal energy. If the particles are much larger than the transition size, they are stable and will not respond to small applied fields. If they are much smaller than transition size, the magnetic vector, is moving at random and a small applied field will only influence them in a statistical manner. In the transition size range, most will follow a small applied field. If the temperature then drops, some of the particles will become stable with their magnetization vectors pointing in the same direction as any applied field.
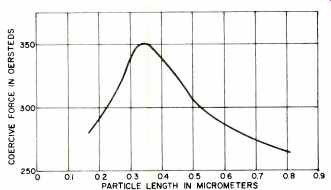
Fig. 8A--Coercive force of gamma ferric oxide particles as a function of average
particle length. (Data from Tochihara, et al.)
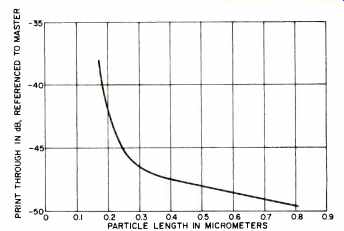
Fig. 8B--Printed signal of gamma ferric oxide particle magnetic recording
tapes, as a function of the average particle length. (Data from Tochihara,
et al [15].)
This last is what happens in thermally -caused print through. At any average temperature, there are microscopic random temperature variations. Some of the particles are always moving into the transition range, and some are always moving out of it. With a constant applied field, as would occur in a signal -containing tape wound on a reel, more and more of the particles become aligned with the field as time goes on. Most of them be come aligned at first, then fewer and fewer as time goes on. The ones that become aligned later result from extreme temperature fluctuations and are thus farther into the stable range than those aligned at first. Thus, the initial print is easier to get rid of than the later print, and this is exactly what is observed and plotted in Fig. 1. In print -through testing, the average temperature is deliberately raised, and many more particles are passed through the transition range. As the temperature drops, the moving transition range leaves behind a trail of particles magnetized according to the applied field.
Please note that in this explanation I have used several words which give a picture of physical movement.
Very little actual movement takes place. Only the magnetization vectors rotate-not the particles, and the transition range is moving through the particle size distribution-not the volume of the tape coating.
Nature's Own Tape Recorder
It is interesting that (with thermo-remanent magnetization) a record of the earth's magnetic field over the ages has been left in rocks as they cooled down after being formed from the melt. In the center of the Atlantic Ocean, the rocks are formed in a trench from molten slag coming up from the center of the earth, and they spread out in both directions (east and west). There is a recorded signal left on the ocean floor extending hundreds of miles, showing that the earth's field has reversed itself many times. Nature actually invented the tape recorder!
Printed Signal Amplitude
Now let's look at why the signals are the size they are. Figure 7 shows a typical size distribution curve of particles used in magnetic tape. This type of distribution is called log-normal, and most small particle distributions are like this, no matter how they are made. The particle length corresponding to the mean particle volume is, for most oxides, from 10 millionths of an inch to 40 millionths of an inch. The actual width of the transition zone is very small, and only a few particles are involved at any given time. The transition zone moves over a larger area during normal temperature variations, but for most materials, the total volume of particles involved (the area covered by the moving transition zone) is only about 1% or less of the total particle volume (the total area under the curve). A -40 dB print -through would indicate that 1% of the particle volumes were involved, and a -60 dB print would indicate that 0.1% of the particle volumes were involved. It is now obvious how to make a low -print tape: (1) Use a material with a narrow particle size distribution; (2) Remove most of the small particles; (3) Use a material with a transition zone located far to the left; (4) Use a material with a larger mean particle size, or (5) any combination of these. As with any engineering decision, there are tradeoffs to make in any case chosen.
Coercing Particles to Flip
The coercive force of a magnetic material is a measure of the size of the applied field that it takes to cause the material to change its magnetization. For a particle, the coercive force is the field just required to cause the particle to "flip" its magnetization vector from one direction to another. All else being equal (such as the particle shape), the coercive force goes up as the size of the particle goes down, until just before the transition zone is reached when the coercive force goes through a peak and drops to zero inside the transition zone. Some of the tiny particles near transition-zone size are influenced by small fields, as is apparent from Fig. 6 (fields so much smaller than the material coercive force theoretically should not change the magnetization of the material). A small number of larger particles may be influenced by their neighbors in the coating so that they are just about ready to flip, and all it takes is an additional push from a small field to make them go. If this happens, the magnetically caused printed signal will be difficult to erase, because the larger particle has a coercive force near the average of the material, and a small field now has no help in pushing it back the other way. Because of this effect, and the fact that the magnetic fields are flipping particles farther and farther away from the transition zone with increasing applied a.c. field strength, one should not expect to find strong fading of the magnetically printed signal after contact with the master is lost, and this is just what Daniel and Axon [6] reported.
Figure 8-A shows how the coercive force of iron oxide particles go through a peak as the particle size is changed, and Figure 8-B shows the rapid increase in print -through as the average particle size goes below the value for peak coercive force [15]. The length given is the average length, and the particle size distribution extends down into the transition zone in each case. These results are more recent than those previously given. The particles were acicular (needle -like), with a ratio of length to width of about 7:1. The 0.3 micrometer (a micro-meter, or micron, is about 40 microinches) particles are about the size used for modern low -noise tapes. It is a triumph of the particle manufacturer's art to be able to make gamma ferric oxide particles this small without unduly compromising the print-through characteristics. The reason that "smaller is better" for audio tapes is that the background noise ("tape hiss") is less the smaller the particles.
Print is Noise Too
Wideband noise, on a good audio tape recorder, is generally 45 dB or better below the 1 percent distortion level. When a tape is stored properly, the printed signals are likely to be down 55 to 60 dB, and thus inaudible under most circumstances. Even so, a loud transient signal could be recorded as much as 10 dB above the nominal 1 percent distortion level, and its pre-print signal might become audible when no other signal was present. It is wise to record at such a level that these heavy transients do not approach the saturation level of the tape (which is 10 to 15 dB above the minimal 1 percent distortion level). A compromise must be sought in the recording level of the tape, since too low a level will get rid of the print, but bring in a lot of hiss. Cassette machines usually have about 10 dB less wideband S/N than do open -reel units, but a good cassette deck will have Dolby, and this equalizes the situation to a large extent and makes them comparable. In fact, Dolby should improve the print -through situation for cassettes by about the same amount that it improves the S/N ratio.
Storage for Low Print
One might think that audiophiles should rent space in a meat locker to store their tapes. This would probably avoid print -through, but would cause other problems.
The wound tape pack does not change dimension with temperature change at the same rate as does the reel or hub the tape is wound on, so tapes that have changed temperature drastically will probably not be wound well, and the pack will slip, possibly damaging the tape.
Another possibility is that moisture could condense on a cold tape brought into a warm room. Modern tapes are not really very sensitive to moisture, but it would make a mess and likely bring on an attack of fungus. Best storage conditions are about 60°F to 75°F and about 35 percent to 50 percent RH (Relative humidity). Too dry an atmosphere will give rise to static electricity problems, especially if the tape is wound or unwound. Temperature cycling during storage is especially bad. Tapes should be periodically rewound.
---------------
Printing effect has many names. Here is a list of the major ones:
Accidental Printing-* An-hysteretic Contact Duplication-Deliberate duplication of tapes using magnetic fields.
Anhysteretic Contact Printing-See last definition Contact Duplication-Either type of deliberate duplication of tapes.
Contact Printing-See last definition Cross -Talk, Magnetic Tape-* (This is not a good definition, as "cross -talk" usually refers to interference from the adjacent channel). Kopiereffekt (copy -effect)-* Layer -to -layer Signal Transfer-* Magnetic Transfer-* Nachecho (Post-echo)-Synonymous with "Post print" Print-* Print Effect-*
Print -Through, Magnetic-All with an asterisk (*) are synonymous with this.
Post-Print-The echo after the signal.
Pre-Print-The echo before the signal.
Spurious Printing-* Thermal Contact Duplication-Deliberate duplication of tapes by thermal methods.
Thermal Contact Printing-See definition above.
Thermal Transfer-Usually used to mean deliberate duplication.
Thermomagnetic Recording-Deliberate duplication.
Thermo-remanent Magnetization-* (Usually used with deliberate duplication). Vorecho (Pre-echo)-Synonymous with "pre-print."
*Synonymous with print-through.
---------------
Ambient Magnetic Fields
There shouldn't be much of a problem storing the tapes in a magnetic-field-free environment. Remembering that a.c. fields less than about 5 oersteds really don't cause much trouble, and that d.c. fields are less harmful than a.c. fields, look at Table Ill. Several instruments and devices found in my lab and at home were measured for their stray fields. All were 60 Hz a.c. except as labeled differently. The most offensive item was the B -H Meter (magnetic hysteresis loop tracer) in my lab. This instrument, used for making measurements on magnetic materials, has an unshielded coil of some 6000 turns of #12 wire. The coil weighs over 100 pounds and has an inductance of 1 Henry. The field is very nearly a pure dipole field (more about this later). This beast will disturb electronic instruments and tape recorder circuits several feet away, and I make no other measurements when it is being used. Still, my valuable standard alignment tapes are stored only about 10 feet away, and I have had no problems with them. The large tape eraser is also unshielded and consists of two coils about 14 inches in diameter, connected with a C -shaped core, 4x4 -inches in cross-section, which weighs 650 pounds. The field in the gap goes to 6000 oersteds. The tape head eraser is a standard type, and the Ampex tape eraser is also a standard unit.
Compared to the B -H meter and the tape erasers, the other things are not very impressive. The point is, it is very difficult to obtain the field magnitudes which would cause any trouble with print-through. All the old tales everyone has heard about tape problems with floor polishers and vacuum cleaners are just so much nonsense. I can say this without measuring every appliance around, and I can also state that no conceivable state of disrepair could cause large fields to emanate from such appliances.
The reason is that any magnetic field can be described as a combination of dipole fields, quadrupole fields, octupole fields, etc. The higher the order of the field, the faster the field falls off with increasing distance from the source. Only a simple geometry, such as a solenoid coil, can produce a dipole field. Other sources produce higher order fields and thus have fields which don't extend very far. An exception to this is the field produced by a wire extending to infinity in both directions. This produces a cylindrical field around the wire, but the model is unreal.
Close to a long straight wire, the cylindrical approximation holds quite well. Two wires with currents traveling in opposite directions, such as power leads, produce fields which cancel out except in between the wires.
The last entry in Table III is calculated, not measured, and it uses the cylindrical field approximation. The current is taken from the article on lightning in my encyclopedia. Two and a half feet away is extremely close to a lightning bolt of that maximum size, and the field is quite large; it would erase most audio tapes made from iron oxide, and the field is only falling off as the inverse of the distance (twice the distance gives half the field, etc.). Dipole fields fall off as the inverse cube of the distance, and quadrupole fields as the inverse distance to the fifth power! Such an occurrence as this king-size lightning bolt would be a disaster, but it's very unlikely.
Yet ... perhaps it might be a mistake to run the ground wire from your antenna mast down the other side of the wall from your tape storage shelves!
Differences in Materials
There are distinct differences in the various types of particles which are used to make magnetic tapes. The worst particle for print -through effects in commercial use is cobalt -doped gamma ferric oxide. Tapes made with magnetite or ferrite materials are somewhat better.
Standard gamma ferric oxide tapes span a range from only fair to very good. Most chromium dioxide tapes are very good due to their narrow particle-size distribution.
Metal -particle tapes, not yet available to the audio recordist, are generally excellent, because their transition zone is located so far down in the tail of the particle size distribution. All the commercial tapes which I have tested that are labeled "Low Print" seem to be just that (these are all from well-known and reputable manufacturers).
Contact Recording
It is possible to use both the themomagnetic and the anhysteretic methods to duplicate magnetic tapes by contact recording. Sugaya and Kobayashi's have published a comprehensive review which points out that these methods are old, though their first commercial use is recent.
Camras [7] and Herr's were the first to suggest commercial tape duplication (of audio tapes) using contact duplication. Both their processes used the -- anhysteretic copy method invented by Muller-Ernesti [19]. Both processes used a high -frequency a.c. field applied when master and slave tapes were in contact. Both failed to be commercialized, for several reasons. The transfer efficiency was poor (the slave signal was quite low, compared to the master signal), the long and short wavelengths rolled off badly (similar to Fig. 3), and the signal-to-noise ratio was not very good. Also, the market for duplicated tapes was not developed at that time's. The difficulty with the efficiency was that both tapes were of the same type. Any field that tended to magnetize the slave would tend to demagnetize the master. What was needed was a high coercivity master and a much lower coercivity slave.
The same problem occurs in thermo-remanent magnetization. If the tapes are of the same type, the efficiency will be poor. With gamma ferric oxide, temperatures to get usable efficiency will be high enough to destroy the tape. Even if high temperature tapes were used, bringing the transition zone up into the large part of the normal curve (see Fig. 7) would tend to destroy the magnetization of the master. In 1959 the idea arose [20] that tapes made of chromium dioxide be used as slaves, since the Curie temperature of this material is only slightly above the boiling point of water, a temperature which most modern tape materials can stand. If the master (made of iron oxide) is placed in contact with the slave (made of chromium dioxide), the two are heated above the T c of the chromium dioxide, then cooled to room temperature while in contact, the signal from the master is impressed on the slave. The transfer efficiencies of this process can exceed 100 percent; the slave coming out with more signal than the master.
With the availability of chromium dioxide tapes in the 1960s, the thermo-remanent process became commercially feasible, and many companies began work on it. At about the same time, high coercive force tapes made of cobalt -doped gamma ferric oxide also became available, and the anhysteretic method is also now used commercially. Neither of these contact recording methods is used for duplication of audio tapes. Audio tapes are duplicated using a master tape player driving a bank of satellite recorders, all running at 120 ips, and the industry is not likely to scrap all that machinery to replace it with a process which would cost more and give poorer results.
All the contact duplication equipment is now used for duplication of various types of video recordings. Video recordings, surprisingly enough, do not require such a wide wavelength bandwidth as do audio tapes! The standard audio band of 20 to 20,000 Hz is four decades of frequency (or wavelength), while most high quality video recorders get by with only one decade of frequency (or wavelength). Thus, even though there is a loss at both short and long wavelengths, it is easy to fit the video signal into a region of little loss, but almost impossible to do this with audio. The control (or servo) signals and the audio track on video tapes are recorded in the usual way, with only the video signals being transferred by contact duplication. The reason that this expensive and complicated process is so attractive to video tape duplicators is that it is even more expensive and time-consuming to copy video tapes machine to machine. Video tape machines must always be operated in "real time" (at standard speeds) and cannot be run at many times normal speeds as are the audio tape duplicators.
Resolving the Mysteries
Now to pick up some loose ends. One should explain why there are a few complaints of printing on 8-track cartridges, which lie in automobiles under the hot sun for hours; or on cassettes, which use the thinnest of base films and are also used in automobiles. Part of the answer is in the type of tape pack. Both use a very loose wind, and the cartridge pack is designed to slip. The worst heat exposure is in automobiles, which also have a lot of vibration. When a tape undergoing print -through slips its relative slave-to-master position, the printing process has to start all over again, as the fields are changed. As the tapes ride around in the automobile, this slipping is constantly happening, and the result is the same as if the tapes were being constantly rewound.
Cassettes or cartridges used in the home are not normally exposed to such heat as those in automobiles. There may not be much of a problem, but I think I'll still take mine out when my car is sitting under this hot Texas sun! There are some other mitigating circumstances for cassettes and cartridges. I've mentioned the suppressing effect that Dolby should have on the printed signals, since it should treat them like the rest of the noise. In addition, the dynamic range in a car is very limited, and printed signals probably get lost in the background noise.
Also, because of the "A" wind, the post-print is worse in cassettes and cartridges. Lastly, a post -echo is less irritating than a pre -echo and may not be heard in many cases.
We can now explain all of the effects which occurred on that operatic broadcast. Video tape of that era was all about 1.4 mils thick and ran at a speed of 15 ips. This is still a widely-used standard. Miss Sutherland's high notes were well within the print -through peak range at this tape speed, and the pre-print is worse, so her lines would always have the pre-echo. The instruments in the same pitch range had the same problem. The bass instruments and male singers were out of it on the low end and did not show any print effects. Since this was normal face -to -back print through, and not face-to-face as it is in deliberate copying, the video signals were of too short a wavelength to print at all, and the FM video system would not have been sensitive to them anyway. The synchronization signals were of very long wavelength and did not print. It wasn't much of a mystery after all, especially when you understand what's going on!
References
1. Lyman J. Wiggin (Reeves Sound Studios), "Magnetic Print-Through--Its Measurement and Reduction," Journal of the SMPTE, 58(5), May 1952, pages 410-414.
2. Robert Herr and Robert A. von Behren (3M Co.), "Selective Erasure of Magnetic Tape Cross -Talk," Electronics 25(8), August 1952, pages 114-115.
3. Frank Radocy (Audio Devices Inc.), "A New Device for the Reduction of Print -Through," Journal of the Audio Engineering Society, 7(3), July 1959, pages 129-132.
4. J.G. McKnight, "Tape Print -Through Reduction," Ampex Research Department Report 106, November 1957, 12 pages.
5. Werner Lippert, "Der Kopiereffekt der Magnetophonbänder-ein Beispiel für eine Verallgemeinerung des Esponentialgesetzes" (Print -Through on Magnetic Recording Tape-An Example Considered as a Generalization of an Exponential Law), Elektrotechnik 1(1), Part I, July 1947, pages 3-7; and 1(2), Part II, August 1947, pages 57-62.
6. E.D. Daniel and P.E. Axon, "Accidental Printing in Magnetic Recording," BBC Quarterly, 5(Winter), 1950, pages 241-256.
7. W.K. Westmijze, "Studies on Magnetic Recording. VI Change in the Recording with Time," Philips Research Reports 8, October 1953, pages 354366.
8. Ray Smith, "Storage of Master Tapes to Minimize Print," 3M Sound Talk, Bulletin #38, August 15, 1969, 2 pages.
9. S.W. Johnson, "Factors Affecting Spurious Printing in Magnetic Tapes," Journal of the SMPE, 52, June 1949, pages 619-628.
10. Joachim Greiner, "Der Untershied zwischen Vorand Nachecho beim Kopiereffekt" (The Difference between Beforeand After -echo in the Copy Effect), Nachrichtentechnik, 3(11), November 1953, pages 506-509; and 3(12), December 1953, pages 543-545.
11. E.D. Daniel, "The Relative Magnitudes of Preand Post -Prints," Ampex Research Department Report, 1961.
12. J. Elmer Rhodes Jr., "On Geometrical Factors, Printing Field, and Print Through," Report to Ampex Corporation, January 4, 1961. Ampex Library Accession Number 02363.
13. William A. Manly, "Magnetic Recording for Computers," Byte, #7, March 1976, pages 18-28.
14. C.P. Bean and J.W. Livingston, "Superparamagnetism," Journal of Applied Physics, 30(Supplement to 4), April 1959, pages 120S -129S. 15. Shigezo Tochihara, Yasuo Imoaka, and Mamoru Namikawa, "Accidential Printing Effect of Magnetic Recording Tapes Using Ultrafine Particles of Acicular 1,-Fe203," IEEE Transactions on Magnetics, MAG -6(4), December 1970, pages 808-811.
16. Hiroshi Sugaya and Fukashi Kobayashi, "Magnetic Tape Duplication by Contact Printing," Annals of the NY Academy of Sciences 189, Advances in Magnetic Recording, January 3, 1972. (Proceedings of a conference held January 21-22, 1971)
17. Marvin Camras, "A New Magnetic Record Duplicating Process," National Electronics Conference Proceedings 5, September 1949, pages 258-261.
18. Robert Herr, "Duplication of Magnetic Tape Recordings by Contact Printing," Tele -Tech, November 1949, pages 28-30 and 57. (See also U.S. Patent 2,738,383). 19. Rblf Muller-Ernesti, German Patent 910602, May 3, 1954. (The invention was made in 1941.) 20. G. Akashi, Japanese Patent S 39-4259, April 1964.
(Source: Audio magazine, Sept. 1977; Author: William A. Manly [Director, Product Development -- The Cobaloy Company. Arlington, Texas 76011, USA] )
= = = =
