|
|
Let's take a detailed look at some damping techniques and their effects.
For a rather long time I was convinced that the low output impedance of the modern solid-state amplifiers did a good job of control ling loudspeaker resonance and associated impedance variations. Some rather heated discussions on the advantage of super cables and ultra-high damping factors led to speaker models and speaker/amplifier interface models that cast a shadow on those assumptions. In order to resolve the preceding, the following questions should be answered.
1. What are the audible effects of resonance?
2. How effective is the electrical damping provided by the amplifier?
3. What additional forms of damping are available?
4. What is achievable in the real world?
RESONANCE AND DAMPING
All cone-type loudspeakers exhibit a resonant point in the frequency response of the unit. The resonance is normally at the low end of the speaker frequency response. Resonance effects of mid-range drivers and tweeters are usually hidden by well-designed cross over networks so that listeners are subjected to only the bass effects. Resonance occurs when a system stores energy at a particular frequency and loses energy at a slow rate after the exciting frequency is removed, allowing the frequency to remain when it should have ceased when the exciting frequency was removed.
You can control the effect to a good extent by inserting a fixed resistance into the system dissipating those lurking frequencies, damping the resonance. The loudspeaker is a mechanical system with a cone/voice coil combination suspended by the spider and surround. The mass of the cone/voice coil and the spring action of the suspension form a resonant system; friction in the suspension components determines the system losses. If the losses are small compared to the mass of the cone/voice coil, the ratio of stored energy per cycle to energy lost per cycle will be large; this ratio is the quality (Q) of the system.
The audible effects of a relatively high Q speaker resonance are:
1. Notes near the resonant frequency tend to be pulled to the resonant frequency, one note bass.
2. Bass transients tend to be smeared in time and are not well defined, as a result of overhang or ringing combined with a slow at tack time due to energy build-up in the resonating components.
3. Bass sounds loose and flabby, overhang prevents speaker from following amplitude variations, and high 0 tends to mask small tonal variations.
Table I illustrates the number of cycles required for the stored energy to decay by 20dB after the energizing signal is removed. Also shown is the loss after one half cycle. The energizing signal is at the resonant frequency.
Typically bass drivers have Os of four or more and, if undamped, will exhibit these sonic problems. Reducing the 0 to 1.5 will improve things considerably. At a Q of 1.0 the sound will be good and at 0.75 or lower will result in an outstanding bass sound. In order to lower the Q of a bass driver, losses must be introduced into the resonating structure, which is not necessarily a trivial task.
CONE SPEAKER ELEMENTS
A cone speaker consists of an electrical component—voice coil and magnetic gap—a mechanical component—the cone voice coil assembly—and the suspension components (surround and spider). The air load of the moving cone is also considered a mechanical component. Figures 1 and 2 are equivalent circuits for electrical and mechanical components of a loudspeaker as shown in Olson’s Elements of Acoustical Engineering. Figure 1 is the voice coil consisting of Rvc (the DC resistance of the coil), Lvc (the voice coil inductance), and Zem (the motional electrical impedance).
For a 4-ohm voice coil, Rvc will be about 3-ohm. Zem may be replaced with the voltage generator, E = NBLV, which rep resents the back emf generated by the motion of the voice coil for clarity. Figure 2 is the electrical equivalent of the mechanical structure of the speaker. Note that the resistive (friction), inductive (mass), and capacitive (compliance) elements form a series resonant circuit at Fs.
TABLE 1: Decay Rate vs. Q.

In a series resonance the current is at a maximum and is determined by the DC resistance. Current in an electrical circuit corresponds to velocity in a mechanical structure, in this case the cone and attached voice coil. This velocity is the driving force for the generation of the back emf represented by E = NBLV of Fig. 1.
Damping the speaker is accomplished by reducing the resonant velocity of the cone. One possibility is by applying an electrical braking force by shorting the voice coil with an amplifier with a very low output impedance or, as the manufacturers suggest, a high damping factor. While this is effective to a degree, it is limited by the DC resistance of the voice coil, Rvc, which is in series with the output impedance of the amplifier. Rvc limits the electrical damping effects so that the resonant Q is reduced to a value of three or more (Table 2).
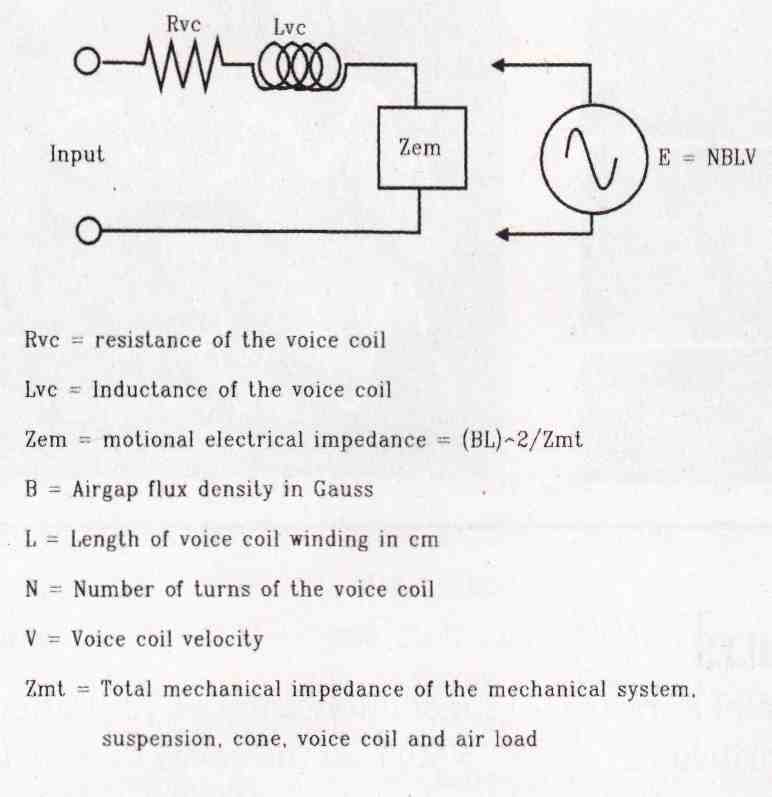
FIGURE 1: Voice coil equivalent circuit.
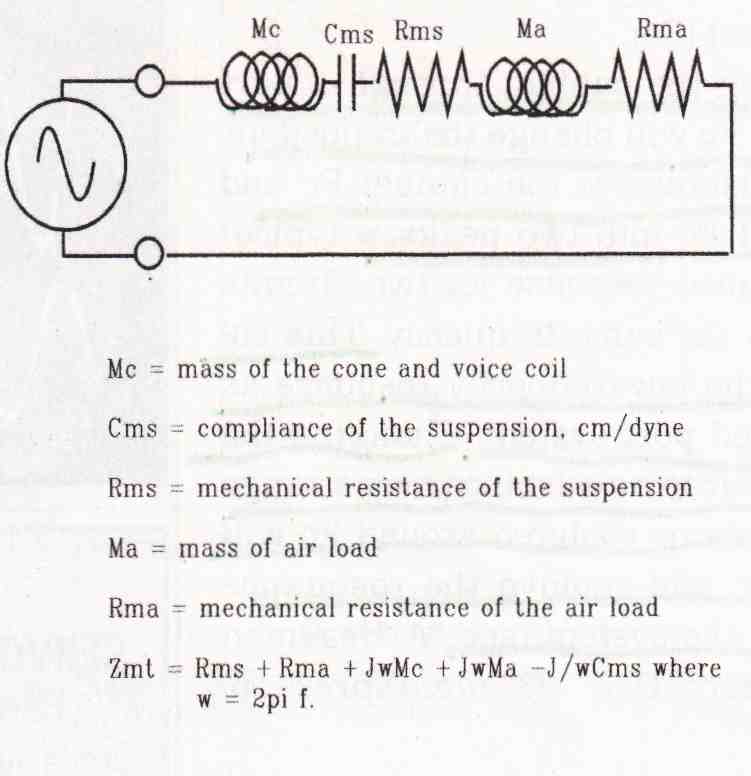
FIGURE 2: Electrical equivalent of speaker’s mechanical structure.
Examining Fig. 2 reveals an additional damping possibility. The air load provides a mass, Ma, and a resistance, Rma, that may be tweaked. Installing the speaker in a sealed cabinet causes the air mass within the cabinet to act as a spring compliance, thus reducing the mass equivalent inductance and adding series capacitance—compliance of the air within the cabinet—to Cms, which results in the increase of the speaker resonance in the cabinet (Fc).
Venting the cabinet through a port tuned to Fc will change the trapped air to a resistance at the cabinet Fc and will split Pc into two peaks, a typical over-coupled response for two circuits tuned to the same frequency. This enhances the low-frequency response as in a tuned port system. Changing the trapped air to a resistance over a range of frequencies centered around Fc will damp Fc and remove the resonance effect of the system.
ELECTRICAL DAMPING
Figure 3 details the test configurations used to obtain the data for Table 2. A series resistor is placed in one leg of the cable between the amplifier and the driver. Setting the resistance to 1k emulates an open circuit across the driver terminals for the constant current test used to measure undamped Q.
- - -
SERVO CONTROL RESULTS
I have just finished Daniel Ferguson’s servo amplifier described in the September 2004 issue of audio Xpress. Testing was done using the Acoustat subwoofer (Photo 1); it has dual voice coils, with the following results. Photo 4 was taken under the same conditions as Photo 1 except that the servo was incorporated, there was no frequency filtering included so a direct comparison may be made. Excellent control of ringing is shown with an apparent Q of about 0.5 compared to a Q of 1.5 for the unit without the servo. The attack response with the servo shows some improvement at 30Hz, the resonant frequency of the unit, and is almost perfect at 38Hz. The bass is tight, well defined and easy to listen to. Due to the control of the servo it is easy to reach for a volume level that is beyond the system limits causing the servo to lose control. This results in a sonic protest that immediately catches your attention. Note that the servo does not change the real Q of the system nor does it prevent energy storage in the system. In reality during the attack period the servo attempts to make the sonic output keep up with the input signal by increasing the applied energy resulting in a greater energy storage and when the stored energy would normally result in output amplitude variations or ring, the servo applies driver energy of an opposing phase to cancel these undesired variations. This is apparent when comparing the decay of the servo output to the decay that is shown in the output waveform of Photo 3. The servo decay is blocky; resembling a half cycle of a low level square wave while that of Photo 3 is a exponential decay. These artifacts are low level and in general do not affect the listening ability of the servo bass which as noted is very good.
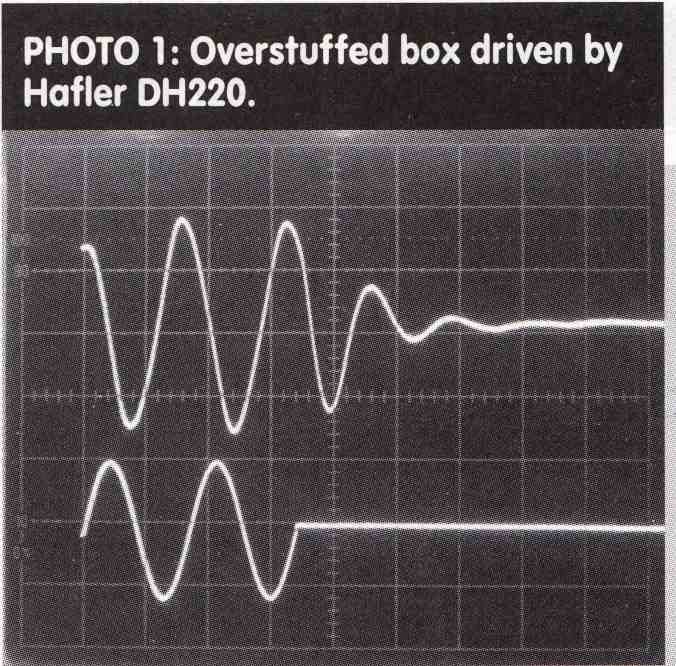
PHOTO 1
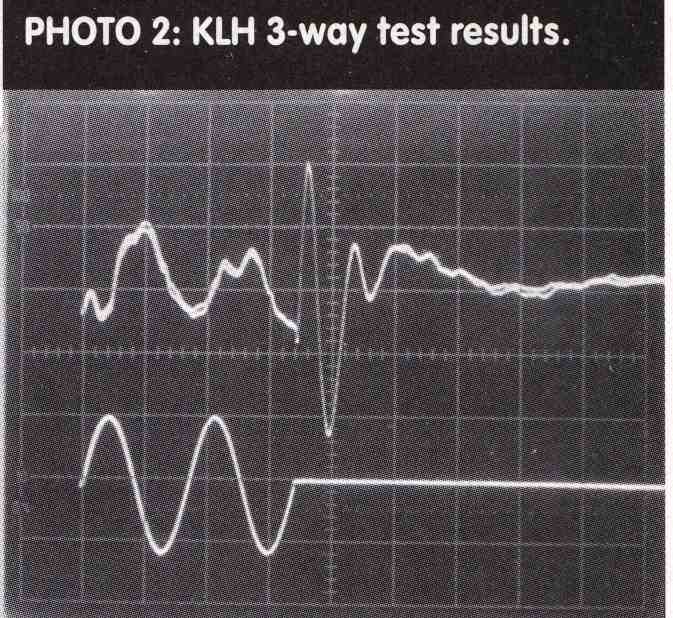
PHOTO 2
 PHOTO 3; PHOTO 4
-- ---
Placing the AC voltmeter across the driver terminals allows you to read the impedance peak at Fs as a voltage peak and determine Fs and the bandwidth. Replacing the 1-k Ohm resistor with a 0.24 ohm resistor emulates a constant voltage drive for the tests used to measure the damped Q. Connecting a voltmeter across the 0.24 ohm resistor lets you read the impedance peak at Fs as a current null and determine the value of Fs and the bandwidth.
In each case Q = Fs/bandwidth. As expected, the damped Q is significantly lower than the undamped Q. As the damping efficiency of a shorted voice coil is determined by the current generated by the voice coil, and the current is limited by the voice-coil DC resistance, then the change or delta from undamped Q to damped Q should be inversely proportional to the voice- coil DC resistance, Rvc. The apparent challenge to this argument is the 6” midrange, but starting with a Q of 19.7 very little electrical damping is required to reduce the Q to 17.4. The remainder of the group follows nicely, with the JBL leading with a delta of 3.5 and the RFD 1208 trailing with a delta of 1.2.
The RFD 1208 ends with the lowest damped Q of 3.7, but it started with the lowest undamped Q of 4.9 due to high frictional losses in the surround and spider. Clearly the electrical damping provided by an amplifier results in a significant reduction in driver Q, but only down to a value of three or so and not down to the magic area below one. Several methods to decrease the value of driver Q and extend bass response follow:
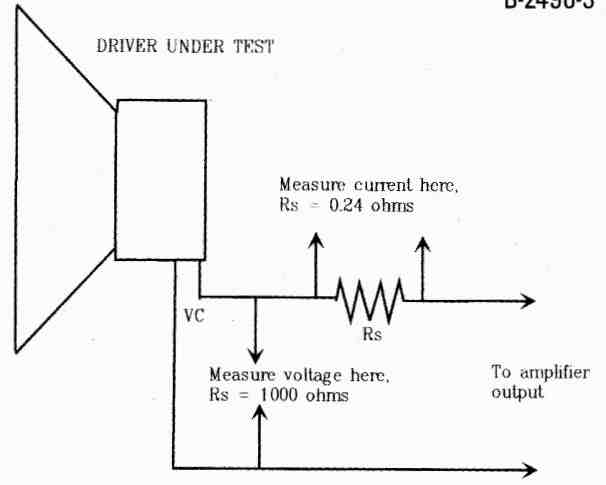
FIGURE 3: Test setup to measure resonant frequency, Fr,, and bandwidth.
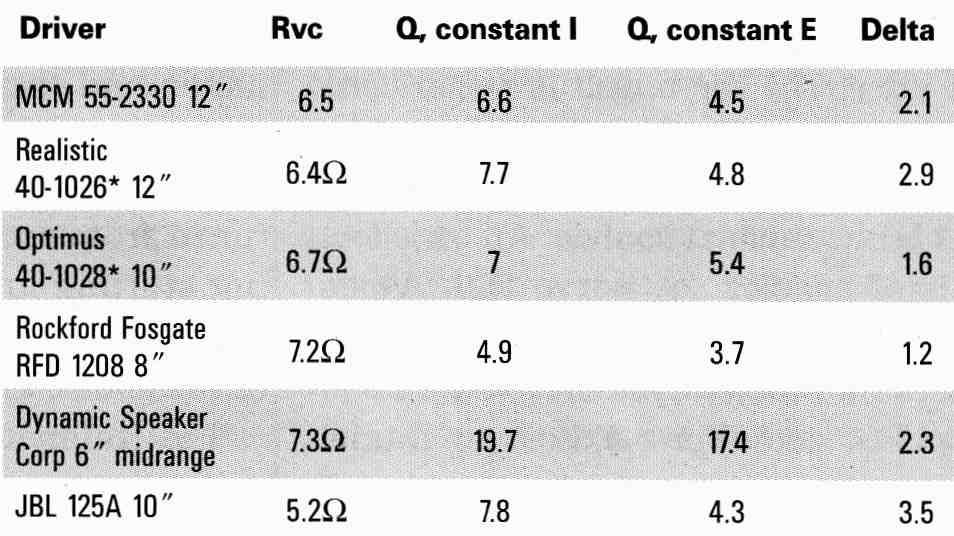
TABLE 2: Electrical Control of Driver Q.
HIDE IT
The car audio people go for small sealed enclosures with volumes of ½ to ¼ Vas. The small enclosure volume causes the driver resonance to increase by a factor of 1.7 to 2.2 above Fs and, you hope, above the operating range of the subwoofer. The extreme stiffness of the small trapped air volume also tends to swamp some of the resonance peak and makes the unit very hard to drive. They are power hungry.
The ultra long-throw woofers that make reasonably sized subwoofers possible were developed for car audio, so thanks, guys.
SERVO CONTROL
Controlling the cone motion by a separate feedback loop servo has been a Holy Grail of speaker builders since the early thirties. There exist several that provide excellent control at a stellar price. The servo unit is rather complicated and when driven to the driver limits may lose control, which results in highly unusual sounds. An excellent pair of articles, “A Servo Dual Voice Coil Subwoofer” and “A Dual Voice Coil Servo Subwoofer System”, both by Daniel L. Ferguson, give a good discussion of the ins and outs* of servo control and present design and construction detail to enable the home builder to try this for him or herself.
RESISTIVE LOADING
Using the air load as a resistive element has been tried in several forms. Transmission-line speakers use a quarter-wave line tuned to the resonant frequency of the driver when in stalled in a box of the same volume as the transmission line. The cross-sectional area of the line is equal to the piston area of the driver. As the air in the line becomes more resistive and less of a spring at resonance, the actual driver resonance is lowered.
The line is typically stuffed with fiber to reduce higher-order line resonance and increase resistance. This results in slowing the sound through the line by 10% to 20%, lowering the tuned frequency of the line. Fine-tuning stuffing and possibly line length will result in an alignment of the driver resonance and the line resonance.
The finished product should have a very smooth impedance curve with very small resonant peaks and a rather gentle rolloff in bass response below the line resonance resulting in a well-controlled low-end response. Transmission-line speakers generally use wide-range 6” to 8” drivers with limited pumping volume, which limits their low end to 50Hz or higher. To achieve a sound pressure of 90dbi at one meter at 50Hz requires the displacement of 214cm of air per stroke and at 25Hz, 856cm is required.
Overstuffing a closed box will increase the resistance of the air load and reduce the driver Q to some extent. Photo I illustrates an overstuffed box driven by a Hafler DH220 operating in the bridged mode. The Q is approximately 1.5 as illustrated by the ringing of the driver after the drive signal was turned off.
The bottom trace is the 30Hz drive and the top trace is from a microphone pickup located 2” above the driver cone. This speaker is an older 10” Acoustat bass unit used with their electrostatic sticks. The sound is not bad but slightly muddy.
The tuned port systems result in a resistive air load at the tuned frequency of the port, matched to the driver, but over-coupling results in two resonant peaks. One peak is below the tuned frequency of the port and one above it. The lower peak will result in a bass extension; however, controlling the resonance is difficult, as illustrated by Photo 2.
The conditions are the same as for Photo 1—note that both resonant peaks have been energized and appear in the output. Also close examination shows an intermodulation sum. The speaker is loud but very muddy and undefined in bass. The speaker tested was a popular KLH 3-way using a 12” bass driver with a crossover at 900Hz, well above the 30Hz test frequency.
In 1968 A. Stewart Hegeman introduced his model 1, which included a point source launch and quarter-wave tuned pipes to control the resonance of the bass/midrange driver. He used six quarter-wave length tuned pipes opening into a small plenum below the driver with the opposing ends closed. At resonance each pipe presented the driver a resistive air load whose magnitude was dependent upon the Q of the pipe. By tuning the pipes around the resonant frequency of the driver, they formed a bandpass resistive load to the driver.
Because the open ends of the pipes were at the point of highest particle velocity, they were easily adjusted in Q to provide a smooth resistive load to the driver that easily went from one- half octave or so below to one octave above the driver resonance, resulting in a well-defined and articulate bass presentation. Since the pipes are of a higher Q and are situated so that the open end loads the driver, they require a total pipe cross-section area of only 50% to 80% of the cone piston area, compared to 100% of the transmission line, which results in a smaller box size.
Photo 3 shows the output of a 10”subwoofer using four tuned pipes. Again the conditions are those of Photo 1. Note that the small half cycle of ring is about 10dB down from the peak, indicating a Q of about 0.5. Also note that the peak of the first half cycle is approximately 90% of the second peak, as opposed to Photo 1, where the first peak is only 80% of the second.
The Q of this unit when driven by a constant-current source is 0.8; the low output impedance of the amplifier reduces the Q to the 0.5 level.
Have the initial questions been answered? I believe so.
1. Bass clarity depends upon a low Q bass driver system.
2. The effect of the electrical damping provided by the amplifier is dependent upon the DC resistance of the voice coil and cannot fully damp resonance effects; a final Q of about 3 seems to be the limit.
3. Several methods of providing additional damping are available.
4. Near perfect damping characteristics may be achieved, but they are expensive and/or labor-intensive.
PHOTOS
The output signals of Photos I and 3 exhibit a 90° phase lead compared to the input signal. This is not a microphone artifact, using the same microphone it has been measured on drivers with resonance frequencies of 30Hz, 42Hz, 78Hz, and 134Hz. In all cases it disappears when the signal frequency is increased by one to one-and-one-half octaves above resonance. It seems to be a characteristic of cone drivers, even in a well-damped system.
Now where do I put that subwoofer?
- - --
TEST EQUIPMENT
B&K 3020 Sweep/Function Generator
HP 6518 Audio Oscillator
B&K 2831 Digital VOM
Hitachi V550B Dual Channel Oscilloscope. 50mHz
Realistic Sound Level Meter with LF poles moved to 2Hz
Proton AA1150 power amplifier
Hafler OH 220 power amplifier, bridged
Canon Digital Camera / iPhone
0.24-ohm resistor, 2 ea. 0.47-ohm resistors in parallel 1k-ohm resistor, carbon film
- - --
============