|
|
A closer look at room correction and loudspeaker response in this four-part DSP preamp project. [Note: Part 1, 2 and 4 coming soon. Part 2 works fine as a standalone article.]
With the advent of the DSP processor, it is now possible to correct defects in the loudspeaker response. To some degree it is also possible to correct deficiencies that the room adds to the loudspeaker response. The goal of a correction system should be to improve the perceived sound of the stereo system.
I started to use some correction curves and pre-filter wave-files, and soon realized that making a DSP filter that works well is a challenge. I needed to consider psychoacoustic properties as well as technical limitations to what a DSP processor can do.
One important property of stereo is the Haas-effect. The balance of loudness of two sources is perceived as directional info within the first 5—20ms. Because of this, amplitude matching of the direct sound from a pair of sound sources is important in order to get a good stereo perspective. This is what DSP is good at. You can match frequency response of a pair of loudspeakers within fractions of a dB with the amplitude corrected to a flat response.
At first, you would think that correcting — for a flat frequency response and perfect impulse response at the listener’s position would be the solution. But there are several problems with this approach:
Psychoacoustic re search has deter mined that peaks are more objectionable than notches in a frequency response If I make a filter that fills in all the tiny notches in a frequency response, this filter will sound horrible. The notches will be removed at the measured position only, with peaks occurring when you move your head just a little bit. Smoothing the measured response helps a lot.
Quality of the stereo image is very de pendent on the ratio of direct sound to diffuse sound. The ratio depends greatly on dispersion patterns of the loudspeaker since more directive designs have a better ratio. You can improve the ratio by using digital signal processing for optimizing the direct sound and removing early reflections.
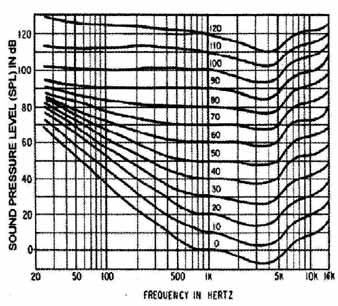
FIG. 17: Fletcher-Munson curves.
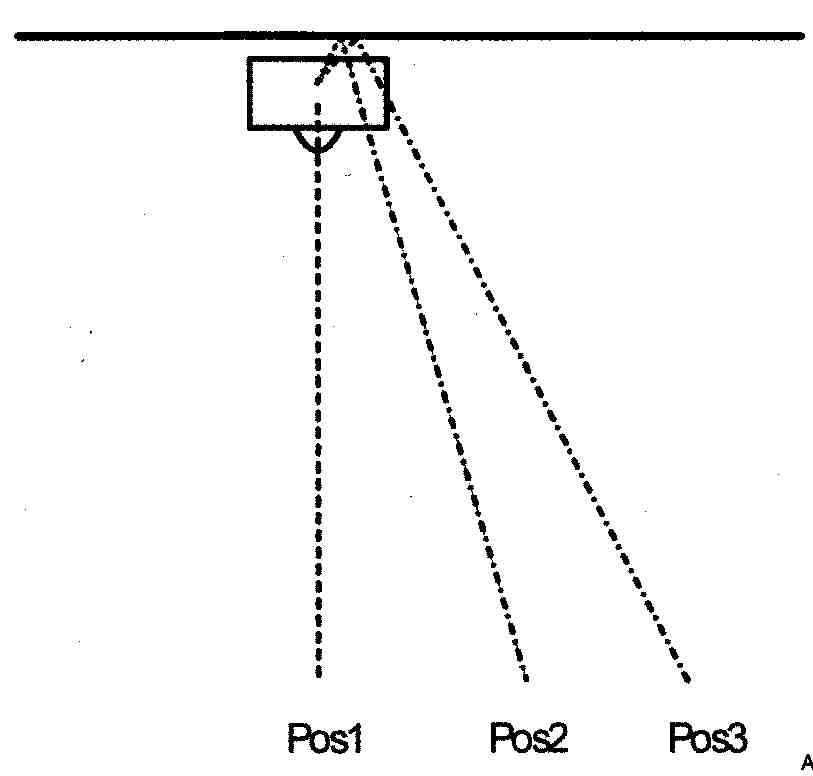
FIG. 18: Back wall reflections path for three positions with speakers close
to wall.
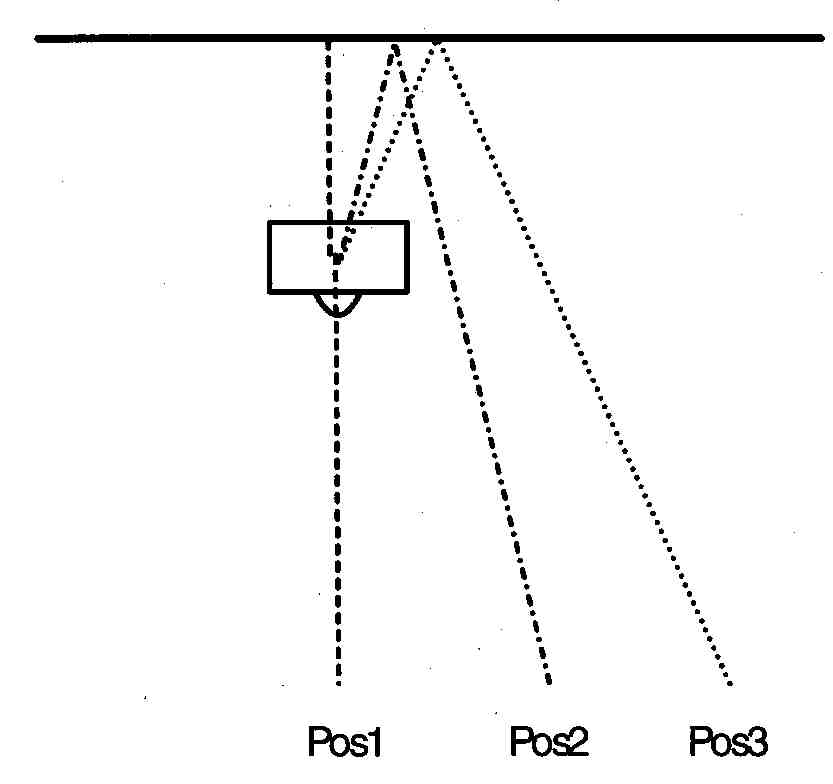
FIG. 19: Back wall reflections path for three positions with speakers away
from wall.
The diffuse sound is important to perceived spectral balance and the reverb added to the sound coming from the loudspeakers. This diffuse sound field varies with the directional proper ties of the loudspeakers as well as the shape and size of the room and listener’s position. There will be varying degrees of absorption of high and low frequencies depending on construction materials used in the room. Since there is always absorption of the high frequencies, attempting to equalize the in- room response flat will fail, leading to a too-bright sound.
The human ear is not linear, as you can see in the Fletcher-Munson curve (Fig. 17). The perceived balance of low and high frequencies depends on the playback level. When playing back music at low levels, the bass and treble weaken. (this is the reason for inventing the loudness button.) While at higher levels, the bass and treble are perceived stronger compared to the midrange. Target curves used in the high- and low-frequency ranges might help in balancing the playback to the room and the listening levels to be used.
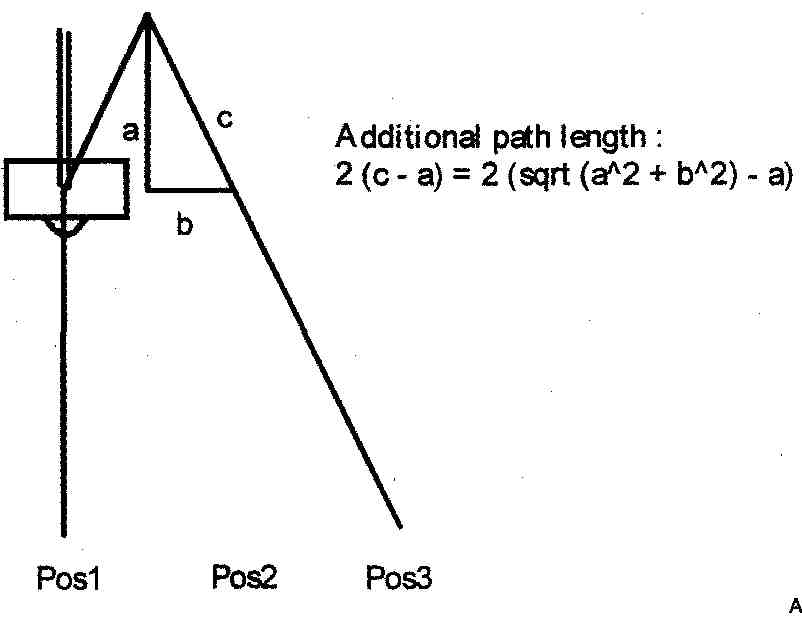
FIG. 20: Geometry for added path length.
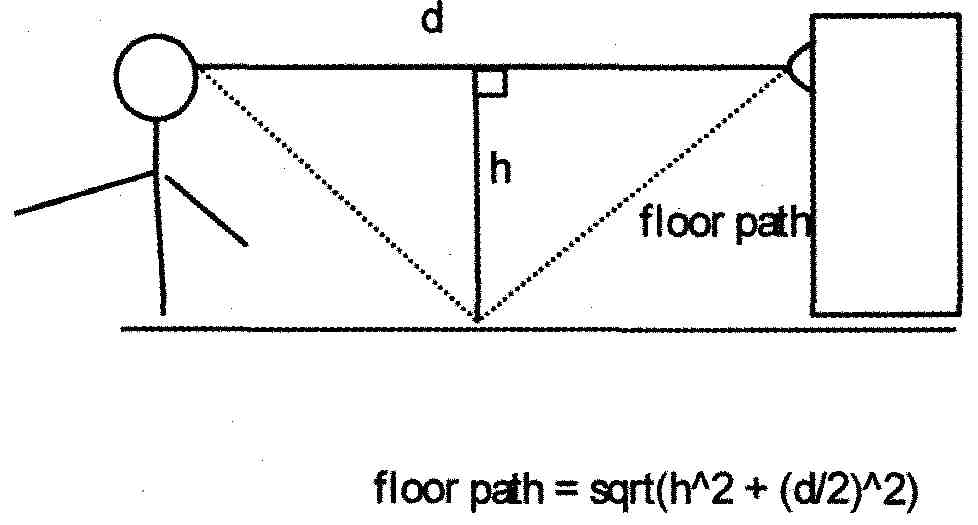
FIG. 21: Floor reflection geometry, assuming listener in height with loudspeaker.
Low frequencies, meaning frequencies below the Schroeder frequency (150 are mainly influenced by room modes. Because wavelengths are similar to room dimensions, in some spots there will be amplification; other spots will be sucked out. Because of this, loudspeaker placement has much influence on response for the very low frequencies. In this band, there will typically also be room gain of 3—6dB to wards the low end. Low frequency peaking is annoying and should prefer ably be removed if possible.
In trying to figure out a practical approach to loudspeaker and room correction, I will discuss different methods in the following groups:
1. Direct sound (including early reflections)
2. Diffuse sound and spectral balance
3. Low frequencies
DIRECT SOUND
The direct sound is of primary importance to image localization, stereo perspective, and perceived coloration. The following factors influence the direct sound:
• driver response
• loudspeaker box shape and construction
• edge diffraction
• nearby objects
• nearby walls, floor, and ceiling
About 150 years ago, Lord Rayleigh developed his Duplex Theory. Image localization is a combination of two processes in the horizontal plane: a time-domain process that is called Inter-aural Time Difference (ITD) and a frequency domain Inter-aural Intensity Difference (IID). Basically, the mind measures both the time differences between our ears as well as the intensity difference for determining direction. For frequencies below about 1.5kHz the ITD is dominant, while above this frequency, IID is most important.
Perceived coloration of the direct sound is found to be up to 25ms after the initial sound, and the directional lo cation information is mostly in the 0ms to 3-5ms range. New research has also shown that the first millisecond after the direct sound arrives is the most important for determining which direction the sound came from.
A single reflection produces a comb-filtering effect in the frequency domain. The audibility depends greatly on the delay of the reflection as well as the loudness. Audible comb-filtering should be corrected if possible. Listener-position dependent comb-filtering might not be possible to correct successfully. Correction of reflection spikes is interesting and challenging. If not done properly, this can lead to sharp resonances in the frequency domain that are unpleasant to the ear.
I think measuring methods for obtaining a correction curve is crucial to getting good results. Since our ears operate both in the time and frequency domains, I will try to analyze the measured data in both domains. I’ve taken a look at two mainly different ways of placing the loudspeakers—near the wail and away from the wall.
The trigonometry in Fig. 18 shows that placement near the wall adds little to the path length for the three illustrated listener positions. The differences in path lengths (Fig. 19) with a speaker placed well away from the wall are much greater and will cause listener positional dependency. Since DSP corrections are performed in the time domain, the reflections need to be placed at the same spots in the time domain for all listener positions to be most effective.
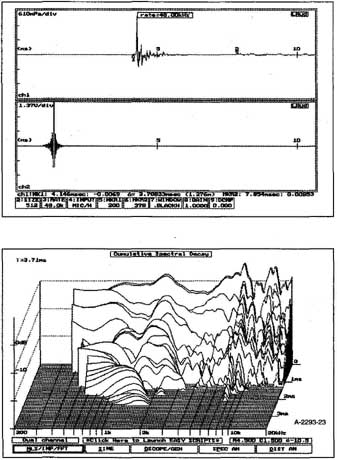
FIG. 22: 1 m semi-anechoic response. FIG. 23: Waterfall of 1 m semi-anechoic
response.
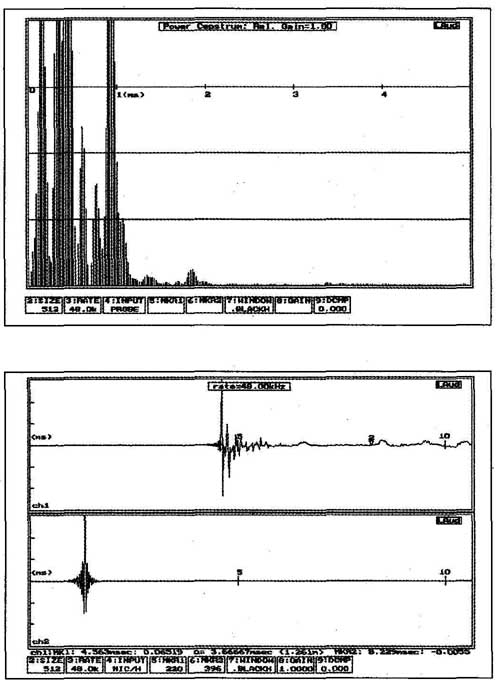
FIG. 24: Cepstrum of the 1 m semi-anechoic response. FIG. 25: 1 m response placing
speaker near the back wall.
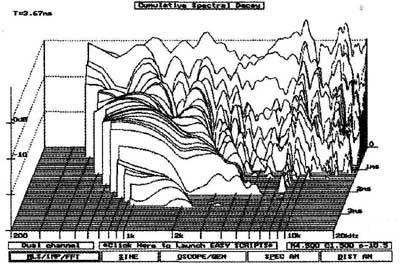
FIG. 26: Waterfall of 1m response placing speaker near the back wall.

FIG. 27: Cepstrum of 1m response, speaker next to wall.
Geometry demonstrating what adds to the path for a distance a from the back wall and the listener position is shown in Fig. 20. As the distance to the back wail increases, the more position- ally sensitive (the value of b has more significance) the path length becomes.
Assuming the same height for the listener and the speaker, the geometry is shown in Fig. 21. The floor path is highly dependent on listener distance, which might make floor and roof reflections difficult to correct.
The reflections from the back wall cause significant ghost images and coloring comb-filter effects. Moving the speakers well away from the walls reduces the energy of the direct sound compared to the reflected sound. This is the traditional way of placing speakers, which I think has a major short coming: The center image becomes weak and stereo perspective does not seem real, lacking weight for images that are in between the speakers.
By placing the loudspeakers close to the back wail and angling them strongly inwards, there is more coloration due to the back wall reflections. Also, ghost images appear. On the positive side, there is a nice feel of wholeness and 3D effect to the image as well as the illusion of the loudspeakers disappearing.
Subjectively, this makes a stronger stereo perspective; images in the center especially are more in focus. I think that coloration and ghost images can be greatly reduced by using DSP techniques and deploying more directional speaker patterns. There should be several advantages to doing correction with loudspeakers placed close to the back wall:
• Position-dependent comb-filtering effects from the back wall can, you hope, be cancelled out.
• Room gain allows for less driver excursion at low frequencies, improving and giving less distortion.
• More precise and natural stereo image.
Figures 22 and 23 show the semi anechoic impulse response and water fall plot for the loudspeaker. Checking the geometry closer, I made some measurements with the speakers close to a 2x3m mirror wall. Compared to the near wall measurements of Figs. 25 and 26, I observed that there was a back wall reflection occurring after 2ms. I saw this reflection in the waterfall plot as a ridge from the lower limit of the measurement up to around 2—3kHz. This ridge of approximately -10dB will appear as coloration to the listener.
Coloration might be checked using the cepstrum transform as shown for the anechoic response. This transform basically tells something about the wiggles of the frequency response or echoes in the time domain that translates into coloration to our ears. It can also be seen as a measure of reflections or diffraction effects that are present. All cepstrum plots are done with the frequency mid-band response set to 0dB level.
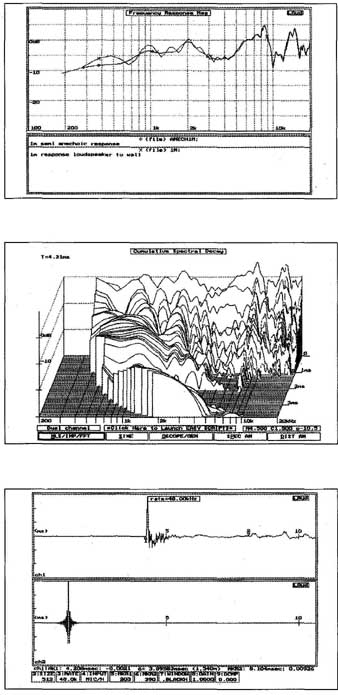
FIG. 28: Comb-filtering effect on amplitude of single back wall reflection.
FIG. 29: Waterfall of 1 m response placing speaker near the back wall, including
the floor reflection. FIG. 30: 1 m off-axis response placing speaker near
the back wall.
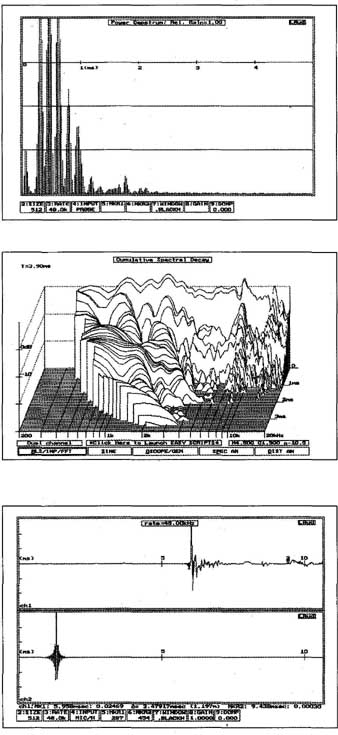
FIG. 31.; FIG. 32: Waterfall of 1 m off-axis response placing speaker near
the back wall; FIG. 33: 1 .6m response placing speaker near the back wall.
Figure 28 shows the comb-filtering effect comparing the 1-m anechoic response with a response including the back wall reflection. You can see a comb-like frequency response in a broad frequency span from 300Hz to around 4kHz. This comb-filtering is similar for all the measured positions. The cepstrum plot of Fig. 27, including the back wall reflection, is very similar to the semi-anechoic response cepstrum plot.
The floor reflection is included in Fig. 29. The energy of the signal has al most died —30dB, and now starts to rise again.
From Table 2, you can see that the back wail reflection is rather constant in time. The small variation is caused mainly by the off-axis measurement angle. Floor and roof reflection placements are dependent on listener distance. In Figs. 34 and 36, the floor and roof reflections overlap!
The longer the distance that is measured (Fig 33), the shorter the distance from the initial wave front to the floor and roof reflection will be. If I measure too far away from the speaker, the impulse response will include the floor and roof reflections in the time window of interest. I must avoid this, since those reflections obviously are listener-position dependent. For a time window up to around 3.5ms there are no floor reflections present, and this includes the back wall reflection. Therefore I will use a measurement with this time window when making correction filters.
Cepstrum of the longer distances (Figs. 35 and 38) seem to have some what less reflective energy present for the longer measurement distance. Longer distances are of such a geometry that reflected energy becomes stronger compared to the direct sound. I think you can see this in the cepstrum of the off-axis responses. There is a small energy peak around 2ms, being the back wall reflection.

TABLE 2 POSITION OF REFLECTIONS ACCORDING TO LISTENER POSITION
DIFFUSE SOUND AND SPECTRAL BALANCE
The diffuse sound (or reverberant sound) is the sound occurring 20ms and longer after the direct sound. It is composed of reflected sound that comes from all kinds of directions not having any valuable phase information. Perceived timbre or spectral balance is the complex aural summation of direct and reverberant sound.
The axial response of a loudspeaker is not sufficient for determining this timbre. The whole system of loudspeaker, room, and listener all influence it. Reflected sounds from floor, roof, and side walls depend on the building construction materials. Loudspeaker directivity is also important. A directive speaker will have less reflected energy from the surroundings than an omnidirectional design.
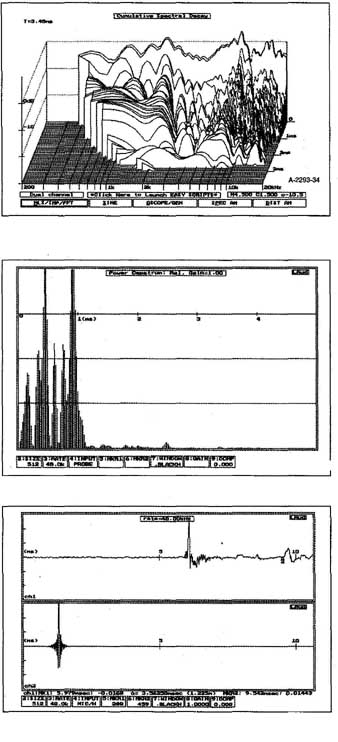
FIG. 34: Waterfall of 1 .6m response placing speaker near the back wall.
FIG. 35: Cepstrum of 1 .6m response.FIG. 36: 1 .6m off-axis response placing
speaker near the back wall.
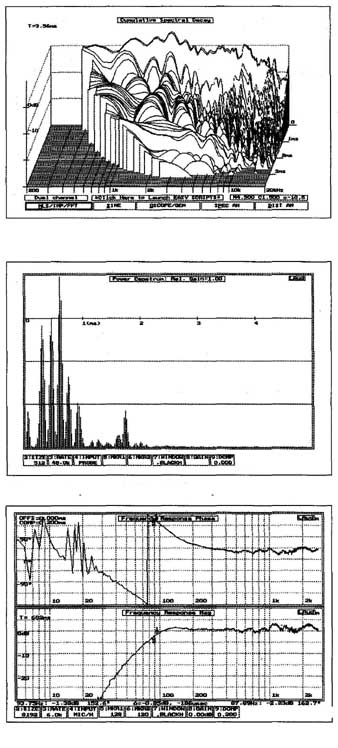 FIG. 37: Waterfall
of 1.6m off-axis response placing speaker near the back wall. FIG. 38: Cepstrum
of 1 .6m off-axis response. FIG. 39: Near-field response of 1X92 driver.
The reverberation on the recording and in the room adds up to the listener experience. A dead room, such as an anechoic chamber, is a terrible listening room, as is a concrete apartment with no furniture in it. Reverberation response times of around 0.4 seconds seem very good, and are commonly found in recording studios. The reverberant field in a recording might be the sound captured at the recording venue, or artificial reverb added by the recording engineer.
How to handle the reverb is an interesting question. There seem to be several approaches. The two outer extremes could be:
• The recording has all reverb recorded and needs no sound from the room.
• The reverbant field should reproduce the recording venue.
These two cases might be handled or solved like this:
• Remove the sound of the room—either by acoustic damping, reflection handling, or by DSP techniques.
• Make a reverbant sound in the room, possibly by adding surround speakers or artificial reverb.
Removing the reverbant field of the room is difficult, since the response will differ greatly from listening positions in the room. DSP FIR filters are easy to implement but do not handle reverbant fields well. IIR filters might be better suited to this task, especially in the low-frequency region.
The room absorbs much of the high frequencies radiated by the loudspeaker. You can easily see this by measuring in-room response and in RTA measurements. Response in the lower part of the spectrum has similar challenges. Too much power added in the low- frequency region might cause the sound to be strained, approaching the X. of the driver.
Using a target or tilting correction curve is a good way to finely adjust the loudspeaker spectral balance in the room to subjective taste. This method of adjusting spectral balance is implemented in many of the commercial loudspeaker and room correction systems.
How much to add or subtract using target curves depends on several factors, such as the audibility curve. Music played loudly has more bass and highs in it because of this. (The loudness button was invented to compensate when listening at low levels by boosting highs and lows.)
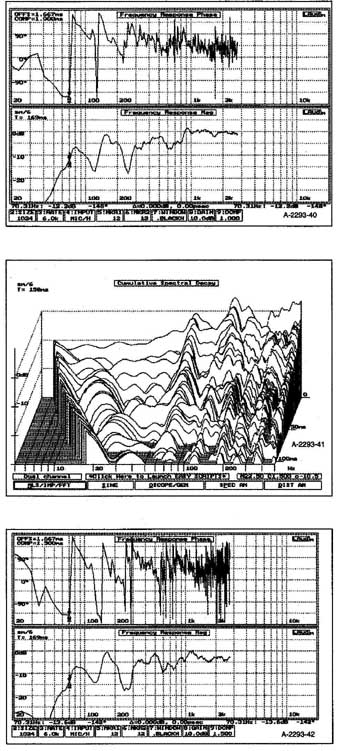
FIG. 40: Room response of JX92 studio monitor. FIG. 41: Waterfall response of
room response. FIG. 42: Frequency response of another room position.
Measuring the spectral balance is typically done using an RTA analyzer. Usually, the measurements are done averaging over /3 or ¼ octave. From such measurements, you can see that loudspeaker response falls off above 4—6kHz. The rate of this falloff influences the perceived brightness of the loudspeaker.
It might be tempting to correct the response so the RTA response be comes all flat up to 20kHz. However, this does not sound good. The speaker will sound too bright. Because of this, I think it is a good idea to establish a target curve that you can set up your self. In this way, you can adjust the brightness.
LOW FREQUENCIES
Wavelengths longer than the dimensions of the room will induce room modes. This results in amplification at certain frequencies and cancellation of others. You can see an example of this in Fig. 40 showing the room response for one listener position of the JX92S studio monitor. Other listening positions will give other responses. Another response a meter away is shown in Fig 42.
These frequencies below the Schroeder frequency, around 100-200Hz of most rooms, depend on the listener’s position. Traditionally, the method of correction for the frequencies in this range is the use of absorbers, which can be Helmholtz resonators matched to the frequency to absorb and placed at mode maxims.
Peaks are more audible and offending than the dips in the frequency response. Since response differs from listener positions, the measured data should be processed in some way. It could be averaged, which can help to identity common peaks and dips at the desired listening positions. Reducing peaks that occur in several places in the room might be a good idea. Dips are more challenging to cope with. Boosting dips in the response can cause annoying peaks elsewhere in the room.
There will always be a phase rolloff in the low-frequency region. This is because the phase of moving coil drivers turns near the driver rolloff region. Also, the box causes additional phase turning. Phase rolloff adds group delay and affects the impulse response. The phase response of the JX92S driver is shown in Fig. 39. (I have seen some research that has pointed out that correcting the phase turning at low frequencies is worth while. However, I have not been able to re-find this reference.)
Correcting phase response can only be done using an active filter compensation circuit or DSP techniques. FIR filters easily correct the abnormalities in the phase response of a loudspeaker while keeping the amplitude the same.
The room will always induce some room gain. For an ordinary room, this can typically be 3dB per octave below 200Hz. I would think this room gain is not a minimum phase function. In this case the phase response should not depend on this gain in amplitude.
Resolution of FIR fitters is a big challenge when correcting for low frequencies. The spacing of the filter is linear with frequency, while our ear is more to a logarithmic scale. This makes it impossible to use a 48kHz sampling rate FIR filter for low-frequency correction be cause the computing power required is too formidable, requiring filter lengths of 10-20 thousand taps. There are several possible solutions:
• Use a warped FIR filter (does not correct phase)
• Use FIR filters with multi-rate sampling techniques
• Use frequency domain filtering
Frequency domain filtering is available on the Internet with the Aurora software plug-in for CoolEdit. Other packages implementing a correction engine on the PC are the Linux-based NWFIR and the Windows program Sinc Audio RCS Common to all this software, the response is FTred to the frequency domain first. Then the amplitude and phase is corrected. This is an easy operation in this domain. Afterwards, the IFFP is used to transfer the corrected signal back to the time domain.
Multi-rate techniques use down-sampling for the low-frequency filters to improve resolution. High resolution is required in the low-frequency area, which typically translates to 1-2Hz. This can be solved with an FIR filter of some hundred coefficients at a rather low sampling rate of some hundred hertz.
Combining a low-frequency corrector with a steep low-pass filter seems at tractive. If I were to implement a steep loudspeaker filter at 500Hz, the minimum sampling rate for this filter according to Nyquist should be above 1khz. (The reason that it must be higher is the requirement for a transition into the stopband of the filter.)
In the next part of this article I will explore different correction strategies for direct sound correction, diffuse sound correction, and low-frequency room correction.
2. Helmut Haas. On the Influence of a Single Echo on the Intelligibility of Speech in German Acustica 1 No 1 49(1951)
3. R Bucklein Horbarkeit von Unregelrnassigkeiten in Frekvenzgangen bei Akustischer Uber-tragung Frequenz, 16 103—108 1962
4. Floyd E bole and Sean E Olive. The Modification of Timbre by Resonances Perception
5. Sean E Olive, et al. The Detection Thresholds of Resonances at Low Frequencies Preprint of the 93rd Convention of the AES October 1992.
6. H D Harwood Some Aspects of Loudspeaker Quality Wireless World 1976.
7. Martin C. High Performance Loudspeakers 4th edition Pentech Press 1991.
8. Per Rubak and Lars G Johansen. Design and Evaluation of Digital Filters Applied to Loudspeaker/Room Equalization DSP. Research Group, Aalborg University.
9. Richard O. Duda sound localization web page.
10. George Christopher Stecker Observer weighting in sound localization. Ph D Dissertation. University of California Berkeley 2000.
11. Aki Makiwirta et al. Low Frequency Modal Equalization of Loudspeaker Room Responses. Helsinki University t Technology 2001.
12. Malcolm Omar Hawksford. Matlab Program for Loudspeaker Equalization and Crossover Design JAES Vol 47 No 9 Sept 1999
13. Linkwitz Transform Circuit Speaker Builder 2/80 3/80 4/80.
14. Angelo Farina Aurora software
15. Anders Torger NWFIR software
16. Sinc Audio Room correction software for Windows sincaudio.com
============