In the process of building a fast and safe way to test mains quality, the author discovers some dirty secrets of the mains supply you take for granted.
This project started out as a simple need to know how much current was being drawn from a particular electrical outlet by a client's equipment rack, together with an innocent curiosity as to whether there was any detectable noise on the electrical supply in general. What I learned along the way has radically changed my opinion of the quality of daily power use. While the project may be a bit over the top for one-time use, the various electronic blocks should be useful to many in a multitude of applications. The measurements I present should be required reading for anyone designing mains powered equipment.
STOCKING UP
I wanted to measure the line current being drawn from a particular outlet in a safe and convenient way. Not having a mains plug to banana adaptor or other suicidal device in my toolkit, measuring mains voltage and current was difficult, to say the least. I could have purchased a current clamp, but even these need a special mains cord or pigtail, so the live or neutral can be separated out for the clamp to loop around. You also still need a galvanic connection to measure voltage. A search on the Internet failed to find what I had in mind-a simple in-line device-so I decided to build my own special box.
In true engineering fashion I started by taking a step back to see the big picture; a simple ammeter was just a wasted opportunity I figured that while I was at it, I should measure line voltage. And why not ground leakage current to highlight any dangerous fault conditions? Detection of outlet wiring faults would be useful, as would a Ground Fault Circuit Breaker (GFCB) tester.
As an aid to debug any problems uncovered, an isolated monitor output for connection to a scope or spectrum analyzer would be essential. To know when to use the monitor, you need to know whether there's noise or hash on the line, so let's add a glitch detector to increase the cool factor.
At the end of this brainstorming session, my behemoth ammeter included the following:
- Line voltage display
- Line current display
- Ground leakage current display
- Indication of outlet wiring faults
- Indication of glitches or noise on line
- GFCB test capability
- Isolated line monitor output
- 20A load capability
POTENTIAL PROBLEM
As usual, I started by sketching a block diagram on a handy napkin and quickly made a few realizations. The first was that there is no obvious common "zero volt" reference. I wanted to pick a common reference point for the two current measurements (line and leakage), but concluded that the earth leakage circuit needed to be completely isolated from the line current and voltage circuits. If I referenced the line current circuit to neutral and the leakage current circuit to ground, and then connected to a faulty outlet that had neutral swapped with live, then I'd have 120V AC between the two input amplifiers, which is enough to cause any IC to go bang in a big way.
The next realization was that it would be very bad if some thing went wrong with this test box and interrupted the neutral and ground wires, causing all the attached equipment to float off the live wire. The use of wimpy wire, low power rating components, or fuses was unacceptable; this would need to be an exercise in overkill. I ended up with the block diagram in Fig. 1.
POWER CIRCUIT DESIGN
Looking on the Internet, I found some heavy-duty shunts rated at 50mV for 25A (i.e., 2m-ohm). At rated current these shunts would dissipate 1.25W, and with their whopping 5"x1" dimensions, I was confident that any residential circuit breaker would pop before these would. 14-gauge copper has a fusing current of around 160A so this is an appropriate cabling choice. I used the plug end of a damaged extension cord (from the last time the high school lad next door trimmed my hedge!) and quality outlet sockets to complete the power section.
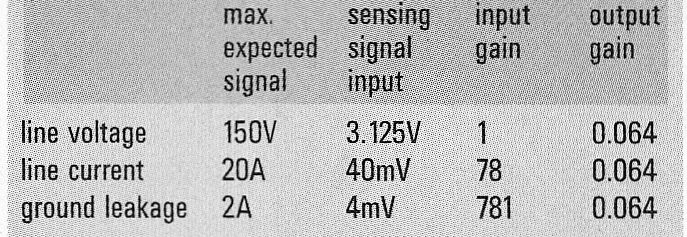
TABLE 1 Input and output gains for RMS
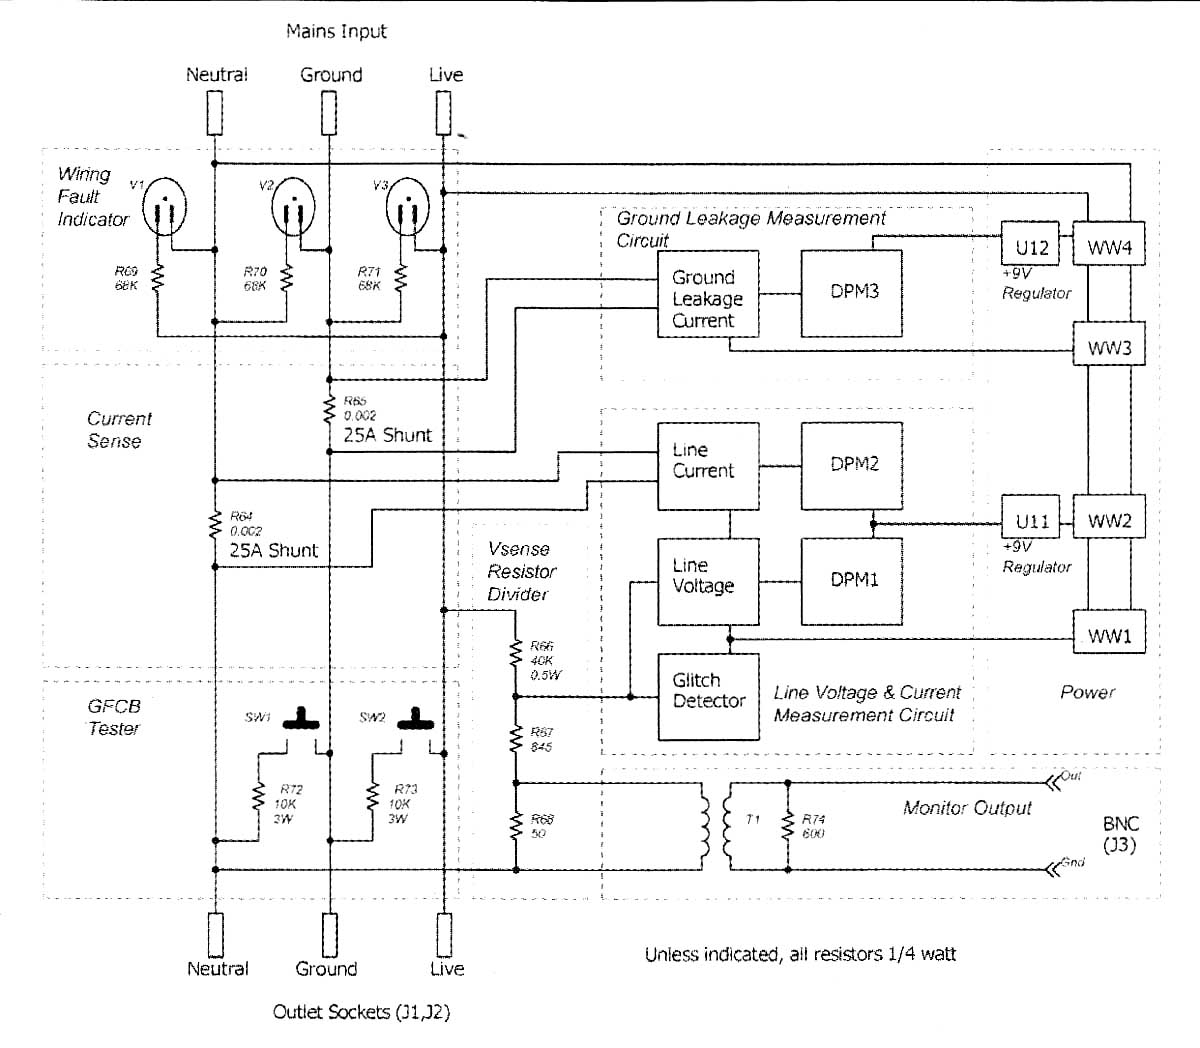
FIGURE 1: Top level diagram of the mains tester.
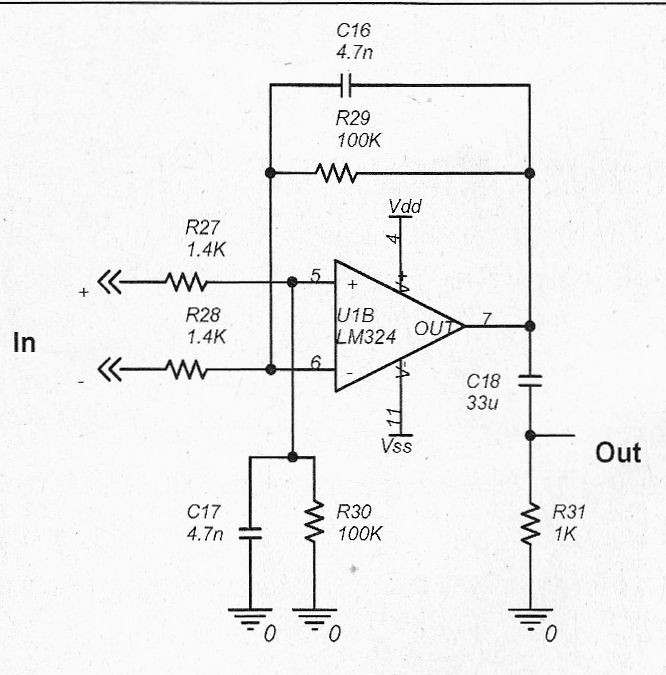
FIGURE 2: Line current input amp.
METERS
I wanted digital panel meters to display the voltage and current measurements, and I found some 3 1/2 digit LCD modules with ½" high numerals for under $8 each at my usual surplus stores. I bought three. The meters had a frill-scale input of 200mV, so I was going to need some amplifiers. I produced Table 1 as a de sign aid.
The sensing signal input is the signal from the power circuit corresponding to the maximum expected voltage or current to be measured, in the case of the current, it is the signal from the 25A shunts at 2m-ohm. This is a pretty small signal requiring rather large input gains. The voltage sense signal is from a resistor divider, and I chose the resistor values to yield the ideal amplitude signal, hence the input gain requirement is 1. I wanted the biggest signal through the precision rectifier to minimize errors.
Because I was working with ±5V supply rails, I needed to allow for peak versus RMS levels and also a hundred millivolts or so because the op amps can't quite hit the rails. I picked 3.1V as the optimum full-scale amplitude. The voltage sense circuit needs to cater to a mains supply 20% above nominal, so I chose the resistor divider to provide the 3.1V RMS for an input of 144V RMS.
This all means that to bring this 3.1V full-scale signal down to the 200mV the displays expect, I need an output attenuator, which can most easily be obtained with another resistor divider around a calibration pot. With the system level planning complete, I could get down to the fun part.
CURRENT METERS
The current sense signal from the 25A shunts is 2mV per amp, so significant gain is required: 78 or about 38dB for the line current and 781 or about 58dB for the ground leakage current. 38dB is achievable in a single op amp stage, but 58dB is best split into two stages to en sure sufficient bandwidth and minimize offset voltage problems. For the line current sense amplifier, I used a standard differential stage with a Kelvin connection to the 25A shunt; the amplifier is shown in Fig. 2.
I DC-coupled the amplifier to ensure that I had good common-mode rejection at 60Hz and because the low source impedance of the shunt mitigated any input offset or bias problems. To ensure stability and to reduce noise, I rolled off the high frequency with C16 and C17 at 340Hz, so there was less than 1dB rolloff at 150Hz. Low-frequency rolloff is provided by C18 with a -3dB point at 5Hz.
For the ground leakage current sense amplifier, I needed 10 the resolution, so I chose a two-stage instrumentation amp (Fig. 3).
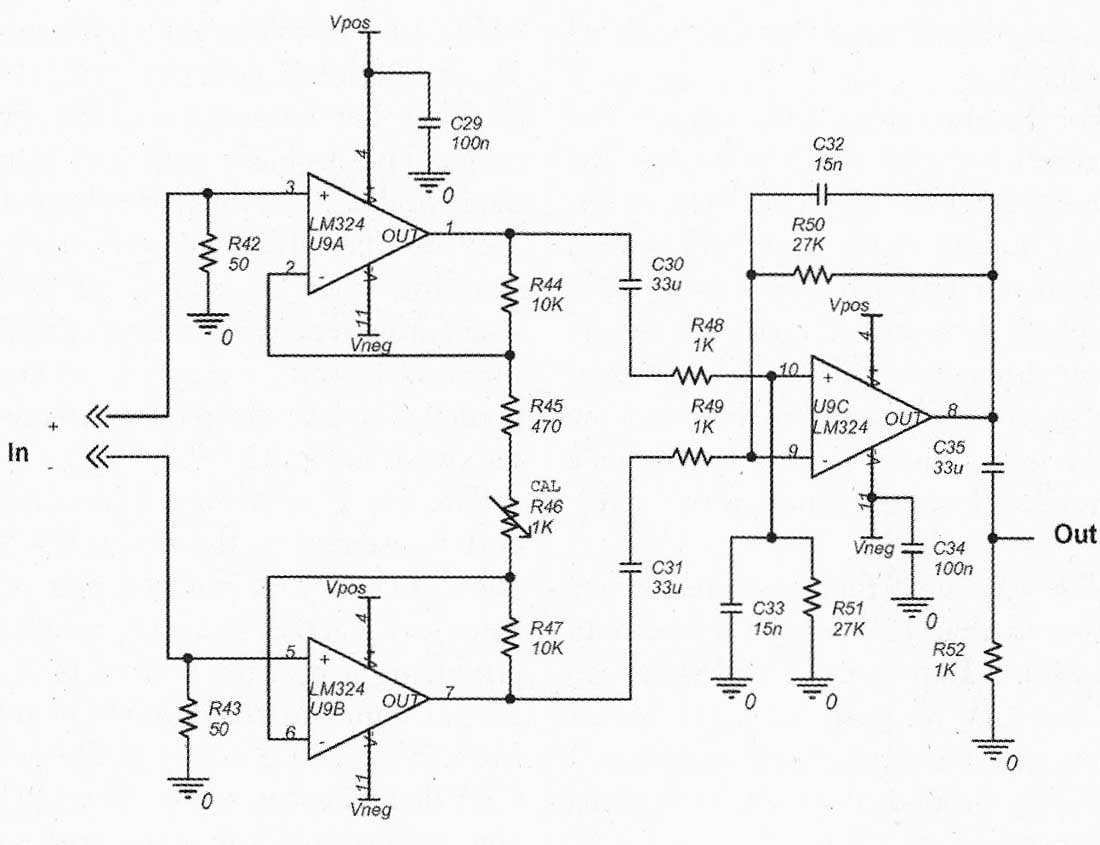
FIGURE 3: Ground leakage current input amp.
The signal I wanted to measure was the same order of magnitude as the input offset voltage for the LM324 op amps I used, so to minimize offset problems, I set the gain of the first stage slightly lower at only 26dB. This allowed me to use fairly low-value resistors, which also helped minimize noise. The classic instrumentation amplifier circuit used has excellent common-mode rejection, and, coupled with a Kelvin connection to the 25A shunt and twisted pair inter connects, the induced noise level should be acceptably low. A simple inverting op amp stage around U9C with a gain of 32dB provides the appropriate signal for the RMS measurement stage. Again, I rolled off at 400Hz to minimize noise.
My biggest mistake here was setting the amplifiers' input impedance way too high. It turned out that there was a significant leakage current flowing through the input amplifier from the mains sup ply to ground. This current developed a differential signal at the input due to the difference between the currents in the positive and negative amplifier input resistors (and to some extent the difference in the 1% resistor values). When your source impedance is 2m-O a high impedance is 1-O. Why was I using a 10M-ohm input impedance amplifier?
I tied both inputs to amplifier ground with 50-ohm resistors and the improvement was impressive. The noise voltage developed due to the leakage current flowing in the input resistors was reduced so much that I was now able to zero out the display where before the offset had been too great. All that noise had been running up the RMS detector past where the offset null could adjust.
POWER SUPPLY
It wasn't until I got the panel meters home and played with them for a while that I discovered a design quirk with them; they need a 9V supply that floats with respect to the voltage you are trying to measure. Not a problem for a battery- powered hand-held meter, but definitely a wrinkle in the design when you need additional input circuitry for gain and RIVIS averaging. It looked as though I needed two supplies for each meter.
When I discovered the ground-neutral isolation issue, the power supply requirement increased to two wall-warts (AC adapters). Now with floating display supplies I needed a grand total of four wall-warts. This was becoming ridiculous. After much hand-wringing and pacing, I convinced myself that it was better than using batteries, the wall- warts were free (I bought a gross some years ago), and the extra weight would lend an air of quality to the final product (I should be in marketing!). I chose to use a favorite trick of cracking open the wall wart, cutting the plug prongs off with my large dykes, and hot-gluing the transformer to the base of the (insulated plastic!) enclosure for a fast, cheap power supply.
For the ground leakage meter circuit I used the wall wart output unregulated. There's not much to this circuit, and all stages are seeing the same signal. I even split the supply with a couple of 1k resistors for a Vcc/2 virtual ground with no problems.
For the line current and voltage meter I needed a regulated supply because the thresholds for the glitch detector are de rived from the supply lines and I wanted consistent, repeatable trigger levels. Also, the glitch detector and meter circuits are seeing different signals and so to prevent any possible interaction, I buffered the Vcc/2 split with an op amp to provide a controlled, low impedance ground reference.
The datasheet for the panel meters indicated that 11V was the maximum supply and I know these wall warts can put out 15V no load. Just to be safe, I threw in a couple of 7809 regulators I had lying around to regulate the panel meter supplies to 9V.
Grabbing a bunch of wall warts, I as signed four as follows.
• A 75V, 200mA rated wall wart delivering 10V no load to drive the ground leakage current meter circuit. Even at 200mA this will provide > ±4V to keep the LM324 in control.
• For the panel meters, a pair of 9V rated 500mA wall warts to provide a minimum of 11V even under line sag/ brown out conditions. I grouped the line voltage and current panel meters on one wall wart. The 11V minimum is because the 9V regulators need at least a 2V drop to stay in regulation. The quality of the panel meter reading stability depends on the quality of this supply.
• For the line voltage and current meter and glitch detector circuits, I used a 12V rated 500mA wall wart with a no load voltage of 17V. Because I wanted ±5V regulators for this circuit, I needed a wall wart that could guarantee at least 14V for the circuit load. Pulling 100mA (a pessimistic estimate), this wall wart delivered over 16V with a supply of 123V. A quick bit of Ohm's law led me to believe the source impedance of this transformer was around 5-ohm, so I would get 14.5V for 96V in (-20% line sag). Your performance may vary.
MEASUREMENT CIRCUIT
The next piece to design was the measurement circuit--there are three of them. I wasn't after extreme accuracy--I'll use my calibrated multimeter if 5V or 100mA is going to make a difference-but I wanted a useful, linear range. The problem with just using a diode bridge is the forward voltage drop. 1.4V may be OK in a power supply design, but when my supply rail is only +4.5V, this represents a huge chunk of the available range. An Internet search produced several favorable references to the circuit in Fig. 4.
The way I see it, for the positive half cycle presented to the input, D4 con ducts, D3 blocks, and the pair of op amps acts together as a unity gain buffer producing a positive half cycle at the output equal to the input. On negative half cycles, D3 conducts, D4 blocks; U3A therefore acts as a buffer and U5 is now an inverting unity-gain amp, again producing a positive half cycle equal in magnitude to the input. Both diodes act within the feedback loop of the op amps so their forward voltage drop is canceled. In reality, the exponential V-I curve of the diodes causes significant errors close to zero, so you want to put the largest signal you can through this circuit for best linearity and precision.
As has been done for centuries, I approximated the RMS averaging circuit with a simple R-C low pass filter (R36, C22) by assuming that I would only ever be measuring pure sine waves (which, as I discovered much later, is not actually the case for mains power). I chose the time constant of this circuit to be half the update rate of the LCD panel meter (which is 500ms), so I would get a quick but stable reading. I picked R to be 10k to keep C reasonable because the 500k input impedance of the LCD panel meter would allow such a high impedance at this point. Besides, I had an X0.064 attenuator to add in between.
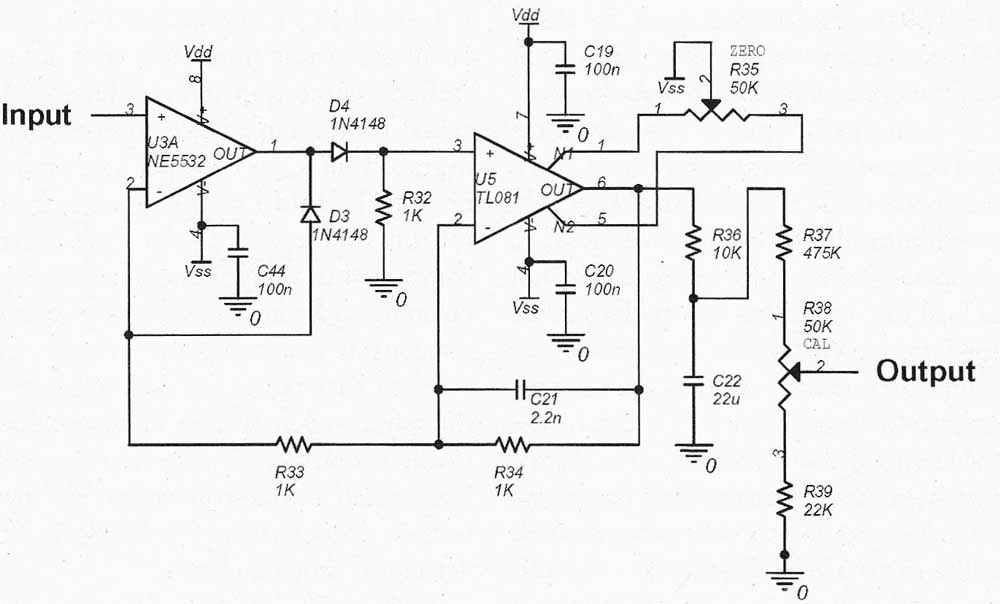
FIGURE 4: Precision full-wave rectifier.
WIRING FAULT INDICATOR
Nothing clever or innovative here. I just wired three neon bulbs with their limiting resistors across the three mains wires as follows: amber live-neutral, amber live-ground, red neutral-ground. You want to see both amber neons come on; you'll want to fix anything else immediately.
Many neon indicators come with a limiting resistor already attached. The ones I used from Radio Shack had a 6.8k resistor, which makes for a nice bright neon. However, during testing in the case where the ground line is floating, the live-ground and neutral-ground neons both came on when I really wanted only the live-neutral neon to glow. I think the neons fire at about 45V and then need only microamps to sustain; the two neons in series still had over a milliamp flowing through them.
Fast-forwarding to the answer, I cut open a commercial wiring tester and discovered that they used 68k resistors. I removed the Radio Shack-supplied resistors and replaced them with 68k. The neons still come on, but now they're very dim and it's easy to tell the difference.
GFCB TESTER
GFCBs are excellent safety devices and are required by code wherever water is nearby. However, they can be a source of nuisance trip problems, especially when used with equipment that has Electro Magnetic Interference (EMI) filters on the mains input connector. These filters have capacitors from live and neutral to ground to filter high-frequency noise from the mains line. The problem is that a 100nF capacitor will also pass over 4niA of 60Hz leakage current into the ground line. Two such devices, and you're really close to the trip current of your GFCB.
Other household appliances such as negative ion generators also have high ground leakage currents. Just tocom plicate things, an installed GFCB can also protect regular, non-GFCB outlets further downstream, so you may be connected to a protected line without even knowing it. The last thing you want is the GFCB popping right in the climactic final action scene of your Saturday night movie. Fortunately, you can use this GFCB tester function to safely see whether your home theater outlet is protected.
The tester simply places a resistance across either live-neutral or live-ground to cause a leakage current to flow. I have a figure of 5mA stuck in my head for the trip current of a GFCB, but I couldn't quote a source. I decided to inject around l2mA because that required a very standard 10k resistor. The worst-case power dissipation is 2W (for +20% line voltage). I paralleled up four 147.5k resistors to make a 1-W, 12k resistor and called it good enough. I know, if I keep pressing the GFCB test button long enough, I can make smoke come out.
GLITCH DETECTOR
The idea behind this circuit was to indicate whether there was any noise riding on top of the 60Hz mains waveform. This noise could be high-frequency hash from switching supplies, load noise from electrical machinery, or just the transients generated whenever any piece of electrical equipment in the neighborhood is turned on or off. The presence of such noise on the mains supply would place an additional burden on the power-supply filtering of any sensitive audio gear and potentially cause some unexpected behavior or audio artifacts.
Choosing a detection threshold for this noise proved to be more difficult than I thought, but I started out as follows.
If any power-supply-borne noise was to be inaudible on a typical line-level signal, then it would need to be well below -90dBV. Having measured some of my circuit designs in the past for their ability to reject noise on the power rails (known as power-supply rejection ratio, or PSRR), I knew that 90dB rejection was difficult, but possible, to achieve with careful design, so it seemed as though 1V of noise was a good thresh old for concern. Technically, this should be 1V on the secondary, but because the secondary could be anything from 5V to 500V, I decided to just use this threshold straight on the mains voltage directly. Detecting a 1V signal in the presence of a second 120V signal takes some careful design; I took out my napkins.
I started with a simple R-C high-pass filter feeding a window comparator to detect positive- or negative-going spikes. Using the same voltage sense signal as the line voltage meter gave me 2.5V RMS 60Hz signal as input. The equivalent threshold of 1V on 120V was therefore 2lmV on this 2.5V input signal, and the idea of running comparators with ±2lmV thresholds made me nervous.
Additionally, the circuit would need to be operated at high impedance, so as not to load the line voltage meter. This made applying a mV or two of hysteresis on the comparators tricky. Adding the requirement to attenuate the 3.5V peak of the 60Hz signal down to below the 21 mV threshold meant that the high-pass break frequency needed to be 8 octaves above 60Hz (8 octaves at 6dB/octave = 48dB attenuation), or 15.4kHz. This wasn't going to detect much audio band noise! I needed a better filter. One of my favorite tricks for steep slope filters is to design a peaked (high Q) second order filter and then add an RC on the output at a slightly higher frequency (for a high pass, lower for low pass) to flatten out the passband. I chose the multiple-feedback design' shown in Fig. 5 because it allows you to adjust the Q and the break frequency independently with resistor value changes.
This third order filter achieved the -42dB minimum attenuation at 60Hz with a break frequency of 400Hz, which I deemed to be acceptable. One small detail about this filter: You need a con trolled source impedance. Raising the signal source impedance to even 100 ohm degraded the Q of the filter so there was no way I could use the signal off the roughly 1-k-Ohm resistor divider. I was already committed to using multiple packages of op amps, so I added a buffer to guarantee a stable low source impedance.
With that pesky 60Hz signal out of the way, I could now gain up the residuals to allow a reasonable detection threshold level which I arbitrarily set to ±1V by a resistor divider chain R8, R9, Rio. The detector is shown in Fig. 6.
Adding 1% hysteresis on the comparators ensured clean switching when a glitch was detected. The LM339 comparators that I used have an open collector output that can sink a respectable current, typically i6mA. This meant that
I could add a capacitor, C10, to ground on the output and stretch any detection output pulse so that it produced a visible flash on the indicator LED.
When one of the comparators detects a glitch, it turns on its output transistor, which discharges the capacitor. The capacitor then must charge up through the pull-up resistor, R15, once the output transistor turns back off Because I had a pack of four comparators, I used one more, U2C, to clean up the capacitor charge waveform and drive an LED.
MONITOR OUTPUT
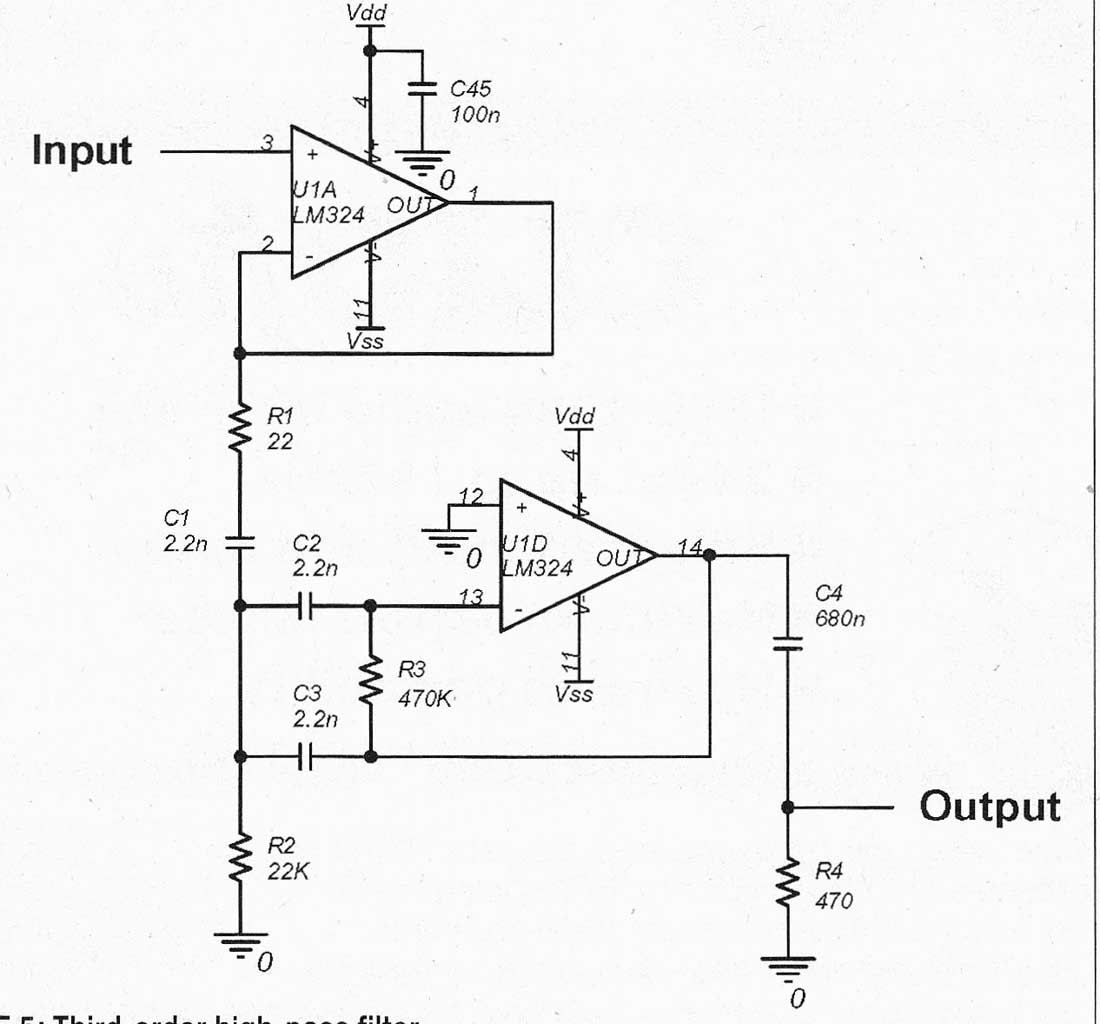
FIGURE 5: Third-order high-pass filter.
Finally, I wanted to be able to quickly hook up a scope or analyzer to look at the mains waveform without risk of electrocution. I chose a 600 ohm audio transformer that I knew had primary-to-secondary isolation exceeding the worst-case 205V peak you could expect from the wall outlet. I actually used a 1500V rating transformer for my own personal safety. It seemed like an easy job: 1V RMS signal from a 600 ohm source resistor + 1:1 transformer + 600 ohm load = perfect mains reproduction.
What I forgot to consider was that the primary inductance of the transformer I was using was only about 37 ohm at 60Hz, and this loaded the 600 ohm source resistor so much, it actually dropped the reading on the line voltage meter. A few napkin scribblings later, it dawned on me that there's no way I'm going to drop a 1V signal onto a 4 ohm resistor to get flat band width down to 60Hz. That would be a power dissipation of 30W! Not wanting to buy another (higher) quality audio transformer, I finally decided to compromise as follows:
As a mains monitoring device, it's OK to relax bandwidth to 120Hz or even 180Hz, especially if you have a known, constant attenuation at 60Hz that can be compensated for.
Reducing signal level actually increases measurement bandwidth because saturation at low frequency is the limiting de sign factor for the transformer. However, I must maximize signal level and optimize operating impedances to combat both inductive and capacitive coupling of mains-related signals.
A quick redesign of the resistor divider to drive the transformer with a 50 ohm source, using the preexisting 845 ohm resistor and 4Ok-ohm (modified from 70k-ohm) composite dropper resistor, and I was back in business. I call the dropper resistor "composite" because it's made from multiple paralleled resistors. This increases the power rating of the composite resistor. The worst-case line voltage sense signal error due to transformer impedance loading was limited to under 1%.
Warning: Mains voltages are lethal. Please use caution and intelligence when working with exposed mains circuits. Consider this project only if you are comfortable working with high voltages. As a precaution, make sure you are not working alone and keep one hand in your pocket when probing live circuits. I accept no responsibility for any damage or destruction caused by careless interaction with mains electricity .
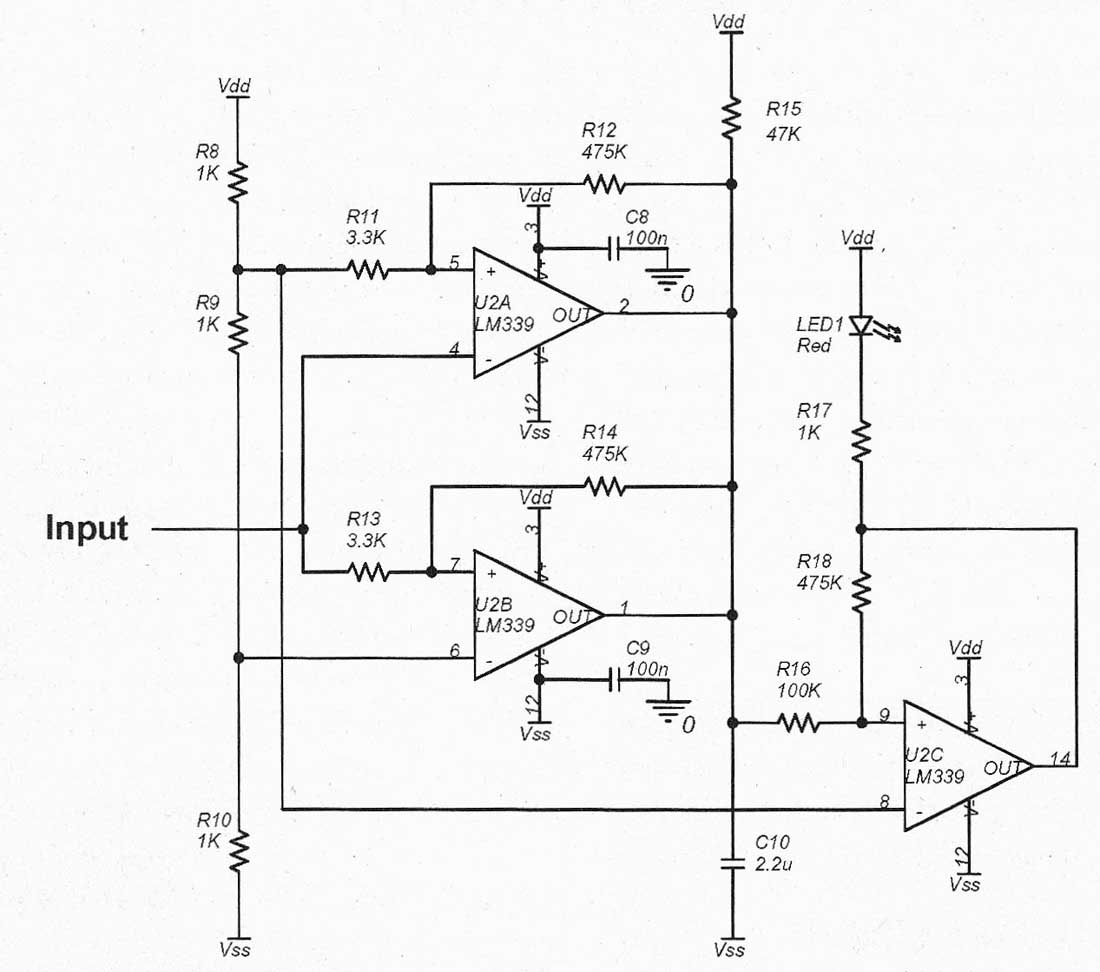
FIGURE 6: Window comparator.
REFERENCES
1. Operational Amp from Burr- Brown, edited by Tobey, Graeme, & Huelsman.
2. Power System Harmonics: Causes, consequences and potential financial impact.
3. Power System Harmonics, PG&E Power Quality Note
+++++++++++++++++
Part 2
With the design complete, it's time to build and test the PC boards.
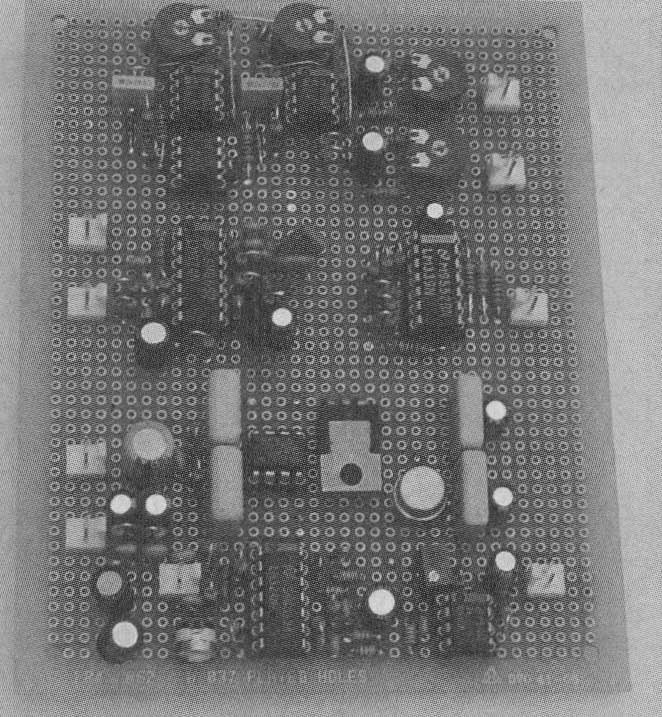
PHOTO 1: Prototype PCB, top side.
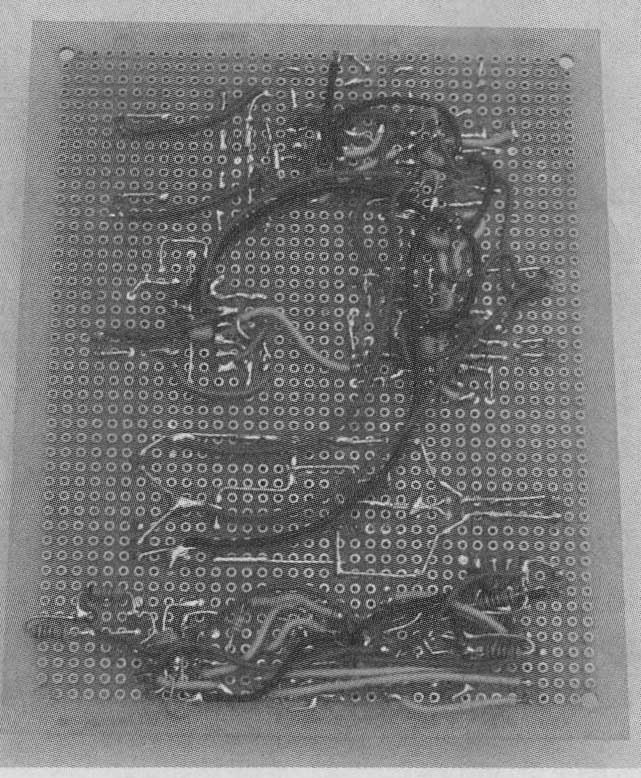
PHOTO 2: Prototype PCB, bottom.
Once I had completed the design with simulations and procured all the parts, I started playing around with a box layout. I put the outlet sockets on the front and the four wall wart transformers at the back. Then I laid out the shunts in the middle with the prototype circuit board and squared everything off by putting the audio transformer on the left.
Checking the size of the panel meters, I saw that they would fit above the shunts, in between the outlets and the transformers. I then drew a line around all the parts, added ½" to all dimensions for good luck, and started looking for a suitable box. Once the box was on order, I set about assembling the PCB.
ASSEMBLY
My preferred technique for building prototype circuit boards is using matrix or vector board, as with many of the projects in audioXpress . I use the small round plated-through-hole variety be cause I find this most resistant to accidental shorts yet flexible enough to simplify wiring. Starting with an IC or other active device and placing the Rs and Cs right next to their appropriate IC pins, I can achieve quite high component density (Photo 1). This is good for sensitive circuits because it minimizes loop areas and therefore EMI susceptibility and emissions.
I always take care to make sensitive nodes such as op amp inputs as short as possible by placing those components first. A quick mock-up on grid paper in pencil can speed up assembly and allows you to try a couple of options without having to get out the (de)soldering tools. I like to use leaded components because you can use the leads to actually wire up the circuit, bending and forming them just like real PCB traces.
Once all the components are inserted, soldered, and wired, I usually find that the only wiring left is power and ground. OK, maybe there're a few signal wires to run, but these are usually inter-stage connections, and using a neutral color such as yellow or white allows easy identification of these useful nodes for de bugging. The prototype board I built is shown in Photos 1 and 2.
The only drawback to this prototyping technique occurs when you must change a component or, heaven forbid, add or redesign a stage. Not that this ever happens to me! It's always the component with a really complex lead formation that's soldered in many places that needs to be replaced, and usually I just clip the part off at the component body and solder the new one on the old component leads. Easy! However, judicious simulation beforehand pays big dividends at this stage.
Here's an important point regarding creepage and clearance: As with all high voltage designs, beware of lead-to-lead spacing to ensure you don't suffer from catastrophic flashover. The breakdown voltage for air is approximately 25kV per inch, or about 1000V per millimeter, which makes it seem quite easy, but this specification is for DC; when AC voltages are present you must use the peak voltage. You also need to consider that the mains voltage of 120V has a tolerance to it; I like to assume ±20%, so 120V AC RMS nominal becomes 212Vpk worst-case.
It's probably very unlikely, but not impossible, that the ground wire on the outlet under test could become connected to a different phase under a fault condition. I don't like surprises, so I decided to design for this event, and thus the worst-case peak voltage becomes 424Vpk. Double it, just in case it's a damp morning, and you want to withstand almost 1000V-now you can be confident that you won't have any flash- over. The pad to pad separation on my vector board was a bit less than a millimeter, so I made sure that there were two rows of unused pads between the line voltage and current measurement circuit and the ground leakage measurement circuit.
Once my box arrived, I was able to do a dry run and see how all the parts went together. The front panel was pre determined for the mains outlets, so I measured everything and then produced a 1:1 scale drawing, centering the outlets on the front panel. I printed it out on my printer, taped it to the front panel, and drilled the screw holes and the four corners of each cutout. With a sharp blade I scored the outline of the cutouts using the corner holes and then used a Dremel to cut along the lines. Not as good as a punch or a nibbler, but some times you must use what you have.
Similarly, I made a drill template for the BNC connector, and after working out how much space all the wall warts would take, I drilled the five holes in the remaining space. I hot-glued all the wall warts to the back panel and left them to set.
Now I needed to align everything on the top panel. I made a template for the panel meters and added holes for four 1" standoffs on which to mount the PCB. I then centered this complete module in the space between the wall warts, outlets, and monitor transformer to get a location on the top panel. I drilled, scored, and Dremeled as before. As you can see in Photo 3, one of the large holes became a bit too large-once again my trusty hot glue gun saved the day. Photos 3-5 are pretty self explanatory, showing how it all came together.
TESTING
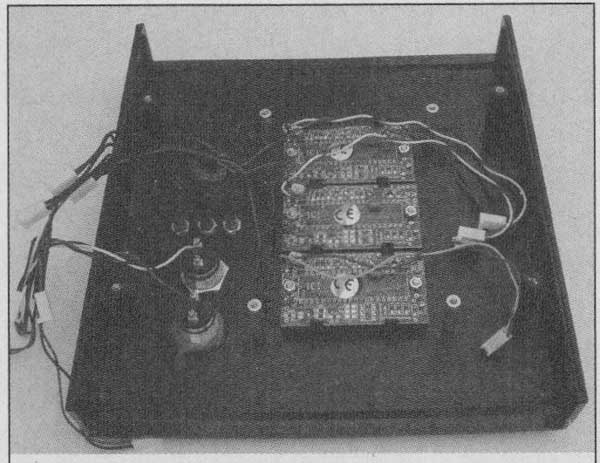
PHOTO 3: Case top assembly without PCB.
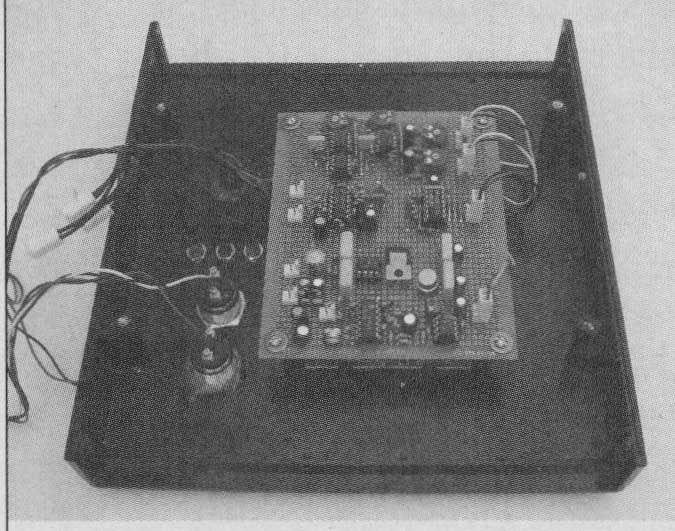
PHOTO 4: Case TOP assembly with PCB
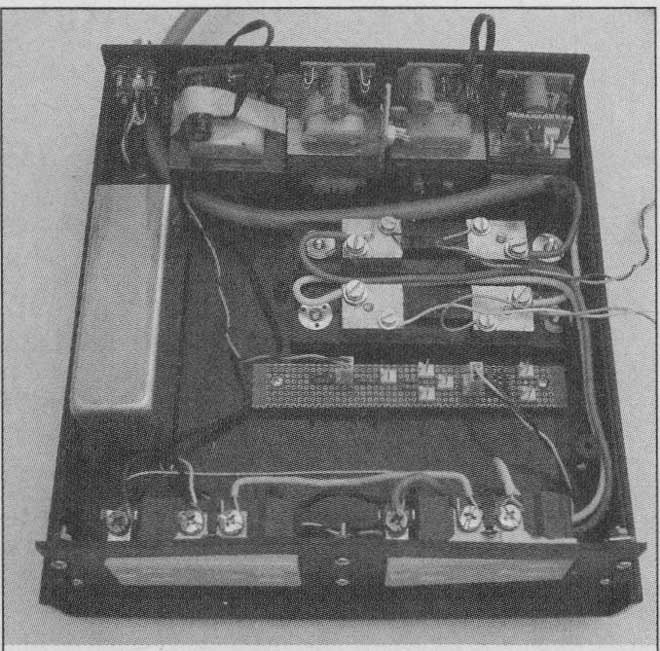
PHOTO 5: Case bottom assembly.
I started testing the PCB on its own with a signal generator and a scope, just to make sure everything was wired correctly. Using a signal of -40 dBV input, I was able to see the amplifiers, filters, and the rectifiers were doing what I expected. After increasing the signal to 0-dBV and sweeping the frequency, I noted that the glitch detector turned on right about 400Hz, and if I did bursts of 1V tone, the LED flashed for a good second, even catching just 1 cycle of 1kHz. It was time to go live.
Call me paranoid, but I unplugged the mains tester from the mains outlet every time I wanted to stick my hand in the box to connect or disconnect some thing. There's no real energy storage in the tester, so you don't need to wait for components to discharge, but I prefer to get into a calm, progressive rhythm when working with dangerous voltages. If I become tired or frustrated, I do something else for a while. I'm still alive to vouch for the efficacy of this method! However, to make the narrative less tedious, I'll omit all my plugging and unplugging from the mains supply (trust me, there was a lot).
Setting up the meters is relatively easy. For the line voltage meter, I first set zero by removing the mains supply connector from the resistor divider board. With the 1.4k-ohm resistor still in place shorting the input, I could adjust the last op amp offset voltage to zero the panel meter. I then reconnected the resistor divider board, tagged my multimeter on the live-neutral output terminals, and adjusted the gain so the panel meter read the same as my multimeter.
I zeroed the line current meter in the same way, with nothing plugged into the tester outlet sockets. I adjusted the offset pot to get a zero reading on the panel meter. To calibrate, you need to pull some current out of the tester, and I chose my soldering iron because it was handy.
Removing the neutral wire to the tester outlet sockets, I inserted my multimeter into the mains circuit, taking care not to short anything with the alligator clips and double-checking the meter jacks and settings (those 2A fuses are hard to find!). Again, I adjusted the measurement gain so the panel meter read the same as the multimeter. Setting the calibration at such a low percent age of full-scale probably isn't the most accurate way of calibrating this meter, considering the linearity problems of the rectifier stage, but my multimeter went only up to 2A so I had little choice. Be sides, if a reading on a rack of equipment is approaching 20A, then it's getting too close to the circuit breaker rating anyway and corrective action is in order.
There is a bit of interaction between the zero and the cal pots on the ground leakage meter because the gain pot is ahead of the offset adjust stage. As you turn the gain up, any noise in the input signal produces an output at the rectifier stage, which you then must readjust with the offset null. A couple of iterations got me close enough, but if I were doing the project again I'd use the same scheme as the line voltage and current meters in which the cal pot is last in the chain.
All through this, the glitch detector LED has been on. Using my multimeter, I could see an AC voltage out of the filter and a DC voltage on the rectifier/RMS stage. I assumed it was 60Hz and I would need to improve the filter. That could wait for now so I chose to ignore it, not realizing that it was actually working perfectly!
OBSERVATIONS
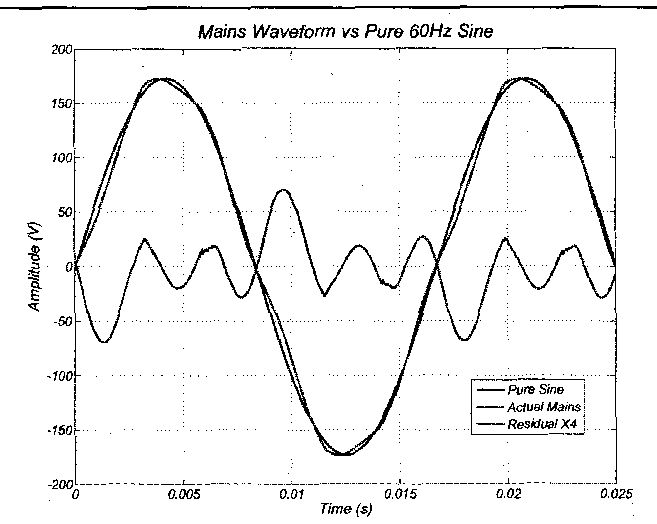
FIGURE 7: Mains waveform compared to pure sine.
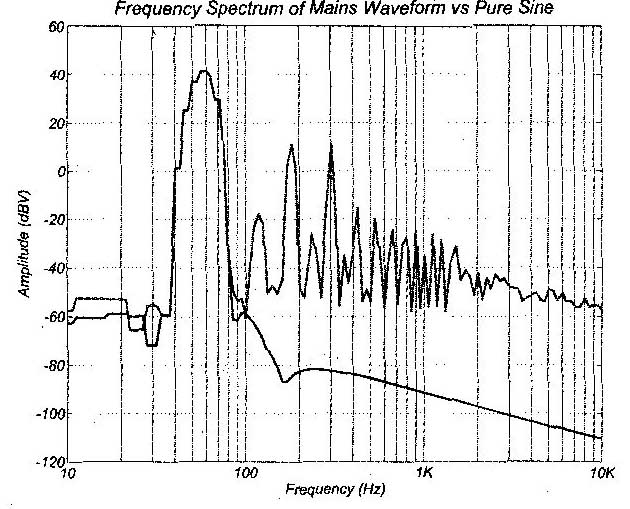
FIGURE 8: Spectrum of mains waveform vs. pure sine.
I connected the monitor output of my mains tester to a line input on my EMU Systems soundcard and recorded a few seconds of mains waveform. After editing the .wav file to extract a couple of cycles, I plotted the mains waveform against a pure sine wave of the same amplitude and calculated the error between them as shown in Fig. 7. The mains waveform was obviously distorted but is still recognizable as a sine.
I wanted to see just how had this mains waveform was, so I calculated the spectrum and plotted it against that of the pure sine wave of the same amplitude (Fig. 8). Both are windowed with a Blackman Harris window, and I used an FFT size of 8192 points as I did for all the spectra presented here. I then integrated all the energy from the linear FFT bins into 1/12 octave bands to get a smooth curve on a log frequency axis.
There are many fine software pack ages that will do this for you. CoolEdit / Adobe Audition is just one, but there's nothing quite like doing it the hard way, by hand. I use Matlab as my analysis tool of choice because it gives me infinite flexibility in how I handle the data, which is both a blessing and a curse.
This first spectral analysis of the mains waveform on the monitor output was a real eye-opener. I stared at it dumbfounded, thinking there must be a calibration error. After checking and rechecking, I realized the math was correct. I still couldn't believe it and went straight back to my design notes to see where I'd messed up. Everything looked OK, so I ran a few more tests to try and debug this problem.
First I calibrated the monitor output circuit itself. Disconnecting the mains supply to the resistor divider R66-68, I connected the soundcard output to the top of the divider. I played a Maximum Length Sequence (MLS) pseudo-random noise signal into the divider and recorded the output on the monitor output jack. After processing the recorded signal, I plotted the monitor response (Fig. 9).
Everything appeared to be in order here so I put everything back together. I thought the problem may have some thing to do with the wiring in my house, so I made several recordings with different loads. First, I turned on my office lights (which are on a dimmer switch) to about 50% and took a reading, thinking that there would be significant noise generated by the triac switching in the dimmer. My laptop had a switching charger so I plugged that into the tester as well and taped a 3W, 100 ohm resistor to the output and took another recording.
I then took readings for a 7A space heater and a 17A microwave (as measured on the line current display). Finally, I took a recording with the mains sup ply to the voltage sense resistor divider disconnected just to make sure I was actually measuring what I thought I was measuring. I was taking measurements using my laptop with a battery supply for the outboard soundcard so leakage currents shouldn't have been a problem, but I wanted to make sure.
The results are shown in Fig. 10. Reassuringly, the measurement for the background noise floor with the resistor divider disconnected was at least 30dB down at all frequencies, so it would seem that I really am measuring the mains supply. Amazingly, this background level represented 100 of mains leakage flowing through R74, the 6001) on the transformer output. Maybe a bigger box to try to reduce the roughly 2nF of stray capacitance causing this current would have been prudent, but I was happy with the 30dB signal-to-noise that I had.
The mains spectra for different loads through the mains tester didn't produce significantly different results. It wasn't until I got up to 17A through the box to power my microwave oven that the spectra changed noticeably. There's a big increase in the 2 and 3 harmonics with about 300mV RMS of 120Hz and over 2V RMS of 180Hz noise. The 3V RMS of 300Hz is relatively unchanged, although still bothersome. On this particular outlet, the line voltage dropped only 2V for the 17A load, which would suggest a mains source impedance of around 118m I was quite close to the panel, so I guess you could get maybe 5 or 10 times that on a really long run.
Everything was behaving properly and it began to sink in that this was, in fact, what was coming out my wall socket. The mains supply is noisy, really noisy. About 10V RMS noisy.
WHERE THIS HIGH-FREQUENCY NOISE COMES FROM
When you think about all the appliances connected to the mains supply, which ones present a purely resistive, linear load? I can't think of any. Even a simple incandescent lamp goes through a temperature-dependent resistance function every mains cycle. DC supplies only re ally conduct in short bursts when the mains supply is greater than the voltage on the smoothing capacitors and the rectifier diodes are forward biased.
Switched mode power supplies are prolific, promoted by their environmentally friendly power efficiency. They take their power in pulses at many times the mains frequency and probably contribute much noise at frequencies beyond the 20kHz limit of my analysis tools. Supply all these devices through a highly reactive grid network, and it's no wonder the mains supply is distorted.
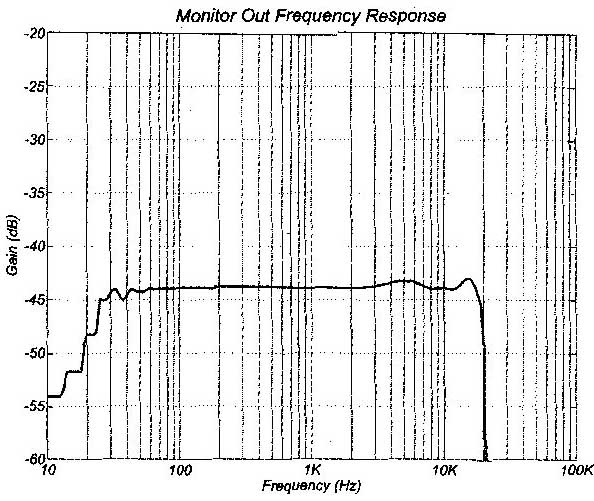
FIGURE 9: Monitor output frequency response.
HOW BAD CAN THINGS GET?
Is my experience normal or do I have grounds for complaint? I searched the Internet for specifications and information. Most power companies think in terms of current because this is what they have to manage; the volts are fixed, after all. Most of the specifications I have found refer to current distortion rather than voltage distortion and use a couple of different Total Harmonic Distortion (THD) definitions.
One method computes the harmonics against the fundamental, the other against the total combined signal. This latter definition, favored by the utilities, is known as Total Demand Distortion (TDD). The astute will notice that TDD can never exceed 100%-what specmanship! The reality is that high THD in the current waveform is almost the norm considering the lack of linear loads, but when the harmonic content approaches the magnitude of the fundamental 60Hz supply, it doesn't really matter whether it's 90% THD or 190% THD. The grid is being stressed and customers are probably having serious problems. The power companies must keep control of harmonic content.
I found one voltage specification from Europe, EN50160 (or maybe EN61000), that suggests the following spectral limit to mains harmonic content. The limit scales with whatever the local line voltage is, which makes sense, and is specified in terms of the harmonics. I converted the spec for 60Hz and 123V and derived the limits for my house as shown in Table 2. Adding this limit to the spectral plot of Fig. 8, I was horrified to discover that things could actually become much worse before the power company would get involved, as you can see in Fig. 11.
Figure 11 also shows a measurement I took at a different site-an industrial park in a factory building that was 50% powered by solar panels on the roof. Not only was there the heavy machinery of neighboring businesses, HVAC units, and office appliances, but there was also the step-up circuits, inverters, and synchronization systems of the solar generator. Add in all the noise from the electronic ballasts of the interior lighting, and you begin to understand where the extra 20dB of high frequency (>1kHz) noise comes from. The voltage wave form of this industrial supply is equally ugly (Fig. 12).
It turns out my residential supply was actually better than average quality! This was becoming downright depressing. The thought of actually connecting this to any of my gear made me feel queasy.
WHY SHOULD I CARE?
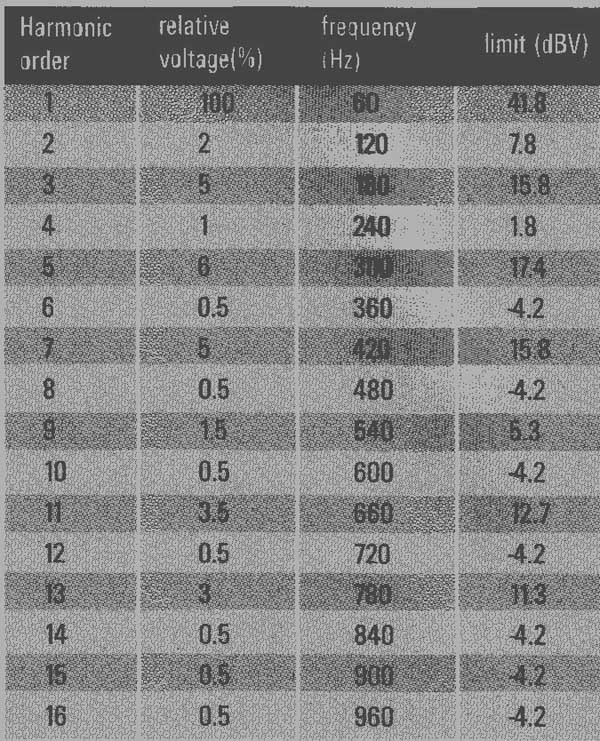
Table 2
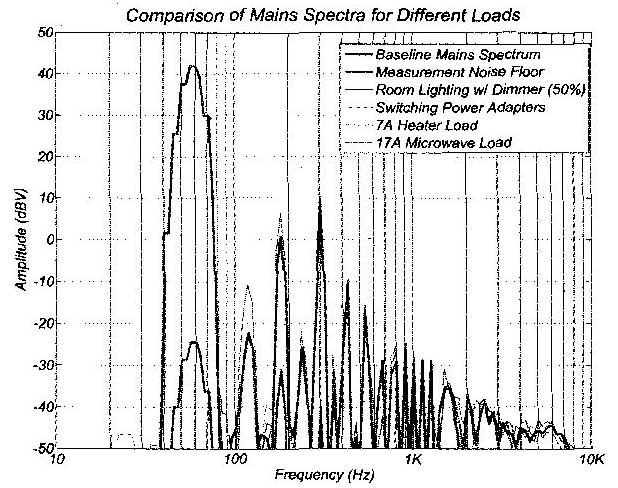
FIGURE 10: Spectra of mains waveform for various loads.
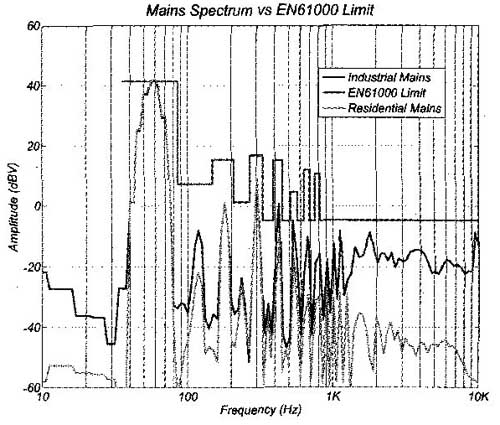
FIGURE 11: Mains spectra for industrial and residential service vs. EN61000
limit.
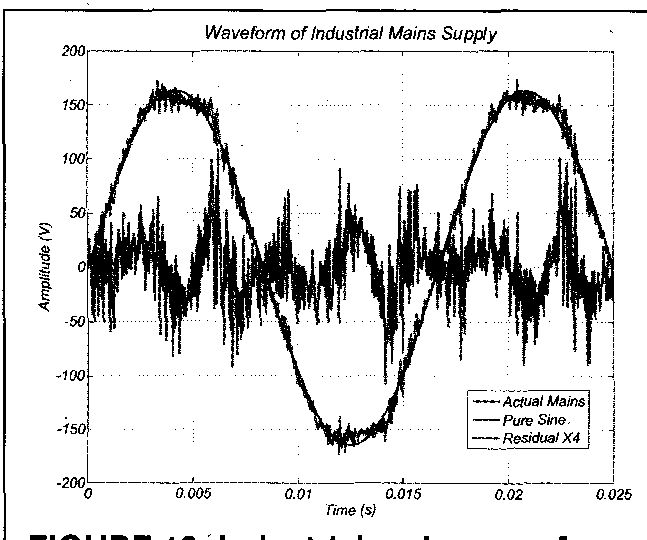
FIGURE 12 mains waveform vs. pure sine.
The most severe problems caused by this harmonic content affect the power utility company For instance, large capacitor banks used to correct power factor have lower reactance at higher frequency so the harmonic content causes overheating and premature failure. Multiple-of- three harmonics ( 9 12 and so on), known as triplens, cause large currents to flow in the neutral line of three phase supplies causing overheating and possible failure. Transformers need to be derated to prevent overheating due to highly distorted current waveforms.
Some problems that affect consumers in the home: nuisance tripping of circuit breakers and fuses has been attributed to high harmonic content of the mains supply. The harmonics more easily couple capacitively into adjacent wired networks such as the telephone system, causing irritating buzz on phone calls or, more problematically, degrading DSL connections due to high error rates. The high neutral current problem in three phase systems can manifest itself as a significant voltage between neutral and ground, which exacerbates common mode hum problems. If I were starting this project knowing what I know now, I would definitely add a fourth meter to measure this neutral-ground voltage.
The biggest concern from my perspective is the additional burden on the power supply design to make sure all this high- frequency noise isn't propagated into any precision, sensitive audio electronics. Having designed many power supplies, crossovers, and filters, I know how hard it is to get deep attenuation with real-world passive components. With some trepidation this time, I got out my trusty napkins to see whether I was in trouble.
Assume for now that your speaker puts out 90dBSPL (at 1-meter) for an input signal of +9dBV (2.83V) and that you want the mains hum to be inaudible, say below 30dBSPL. Then the total RMS noise level input to the speaker must be below -51dBV. From my measurements, with multiple harmonics at 10 dBV, I'd say you need a good 70dB attenuation from mains input to speaker output to ensure this. Just to illustrate this by means of a typical 100W class B transistor amp, that attenuation is provided by the following means.
The mains transformer steps down all voltages by a factor of 4, or -12dB. The power supply filter capacitors provide only 20dB of attenuation due to the fact that the Effective Series Resistance (ESR) of most large caps is of the order of hundreds of milliohms versus transformer secondary source impedance of an ohm or so. The remaining 38dB of attenuation must be provided by our friend negative feedback; by comparing the output voltage to the clean (you hope) input voltage and driving the output transistors with an error signal, the output transistors can be made to block any noise on the power supplies. This is PSRR, and a careful design can achieve upwards of 60dB.
In my house, with my class B amplifiers, it looks as though I have a small margin (my speakers are quiet). But what about a tube amplifier with a step-up power supply? Now the harmonics are gained up by the mains transformer. Fortunately, in this case the currents flowing are much reduced so the supply source impedance can be increased.
For instance, adding 101 in series with the HT line before the filter capacitor will achieve an extra 20dB attenuation, with the ESR of the filter cap being unchanged. But in a design with no feed back, you need to ensure that somehow you provide the remainder of the required attenuation. I haven't played with feed back-less tube designs, but I now have a whole new respect for them and their designers! Another major red flag goes up for class D amps. In class D you typically switch the output transistors hard on and hard off at a very high frequency and then filter out as much of the high-frequency noise as possible. You can't filter out any audio frequency noise because that would defeat the object of the amp.
The class D amps I have seen connect the power supply, noise and all, to the output with a very low impedance, typically just a few ohms. That's only a couple of dB of PSRR for a typical 8f1 speaker. This implies that any noise on the power supply of a class D amp effectively connects directly to the output. Buyer beware! Finally, preamplifiers for low-level transducer input are even more sensitive. For a low impedance moving magnet cartridge putting out 500 or -66dBV, you need an impressive 160dB PSRR from your mains supply. This makes a compelling argument for batteries, especially if you factor in mains leakage current effects as well.
WHAT NOW?
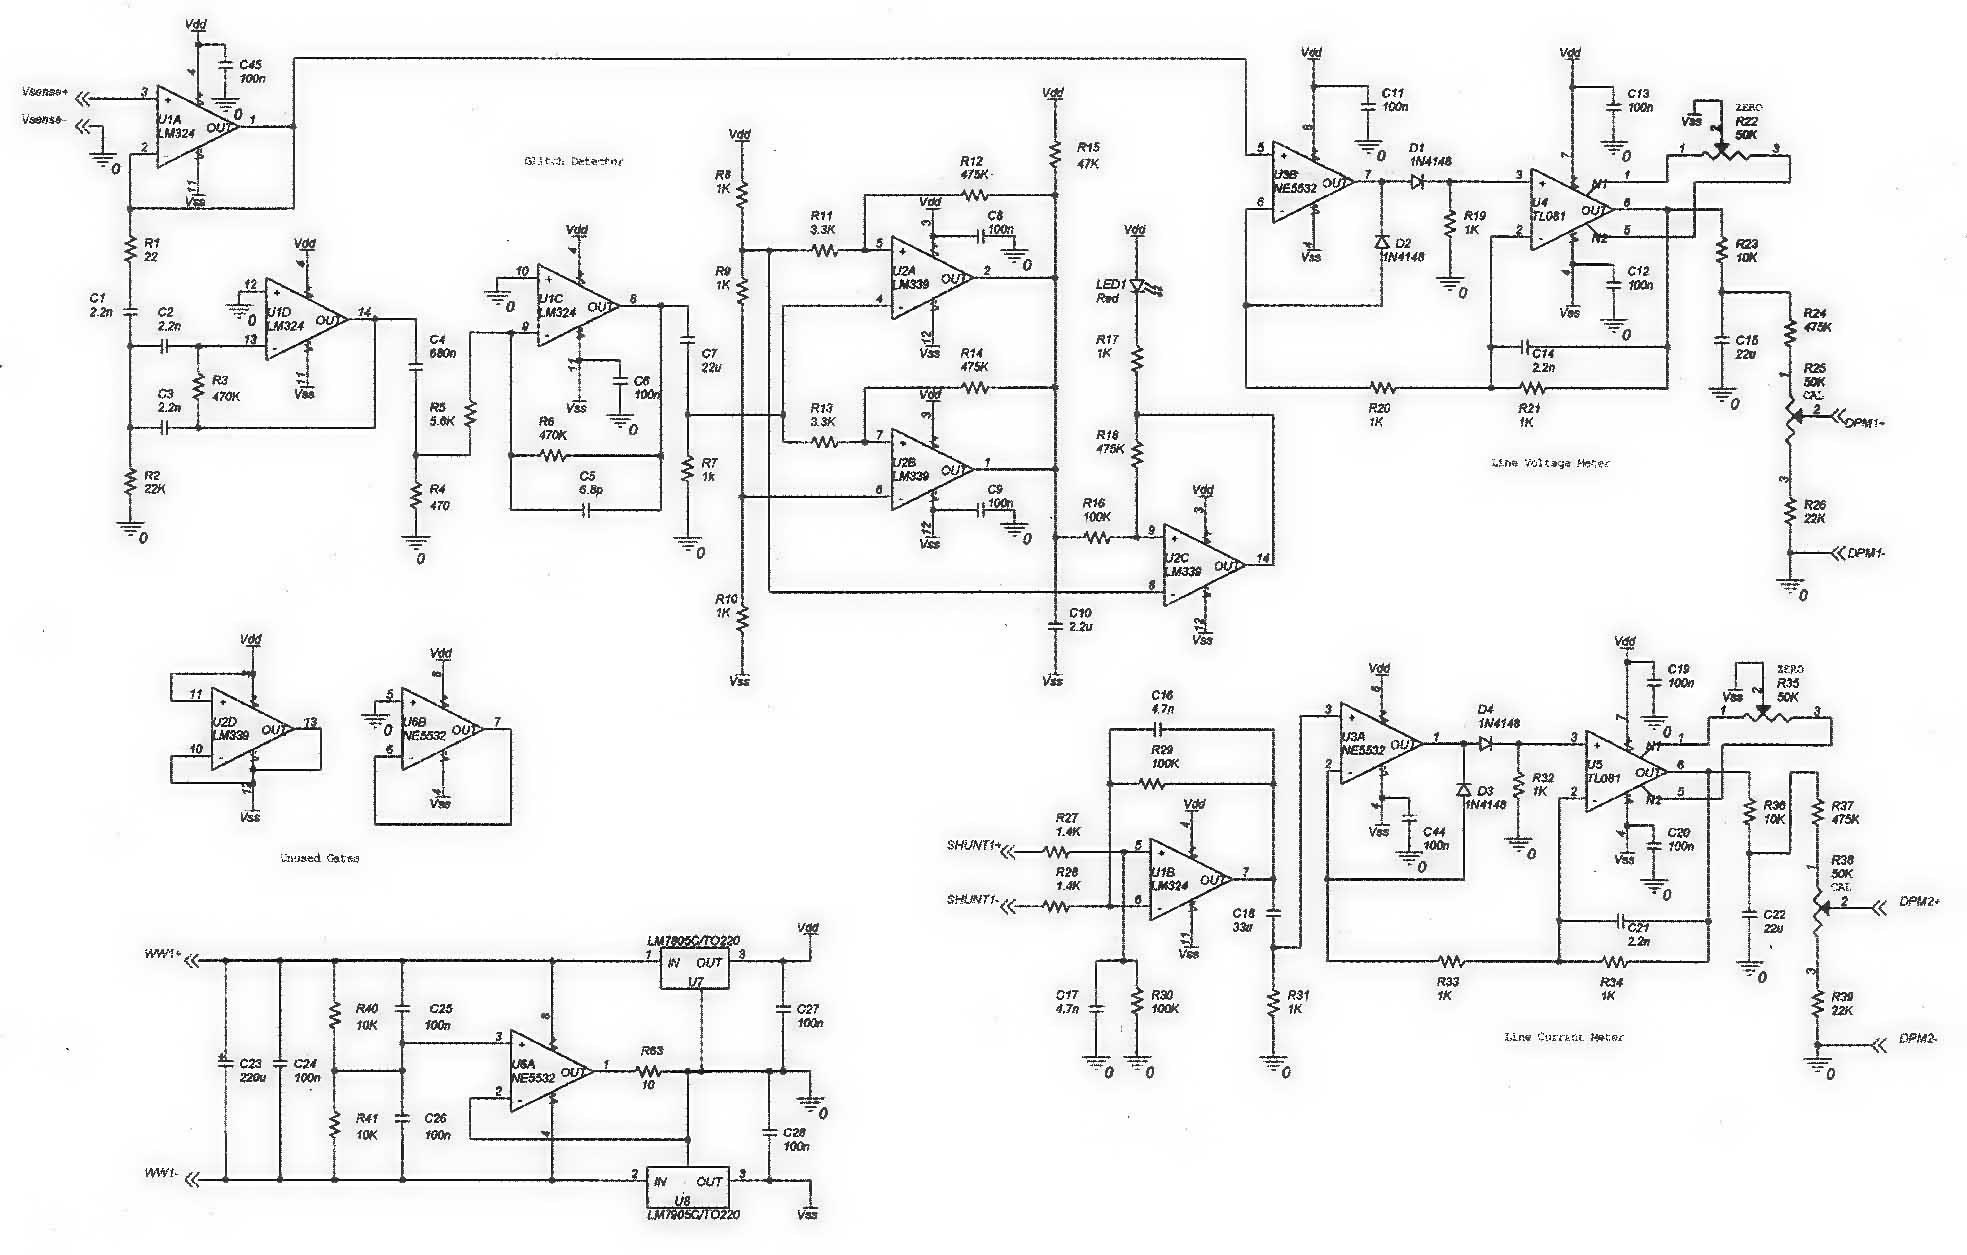
FIGURE 13: Schematic for line voltage and current measurement circuits.
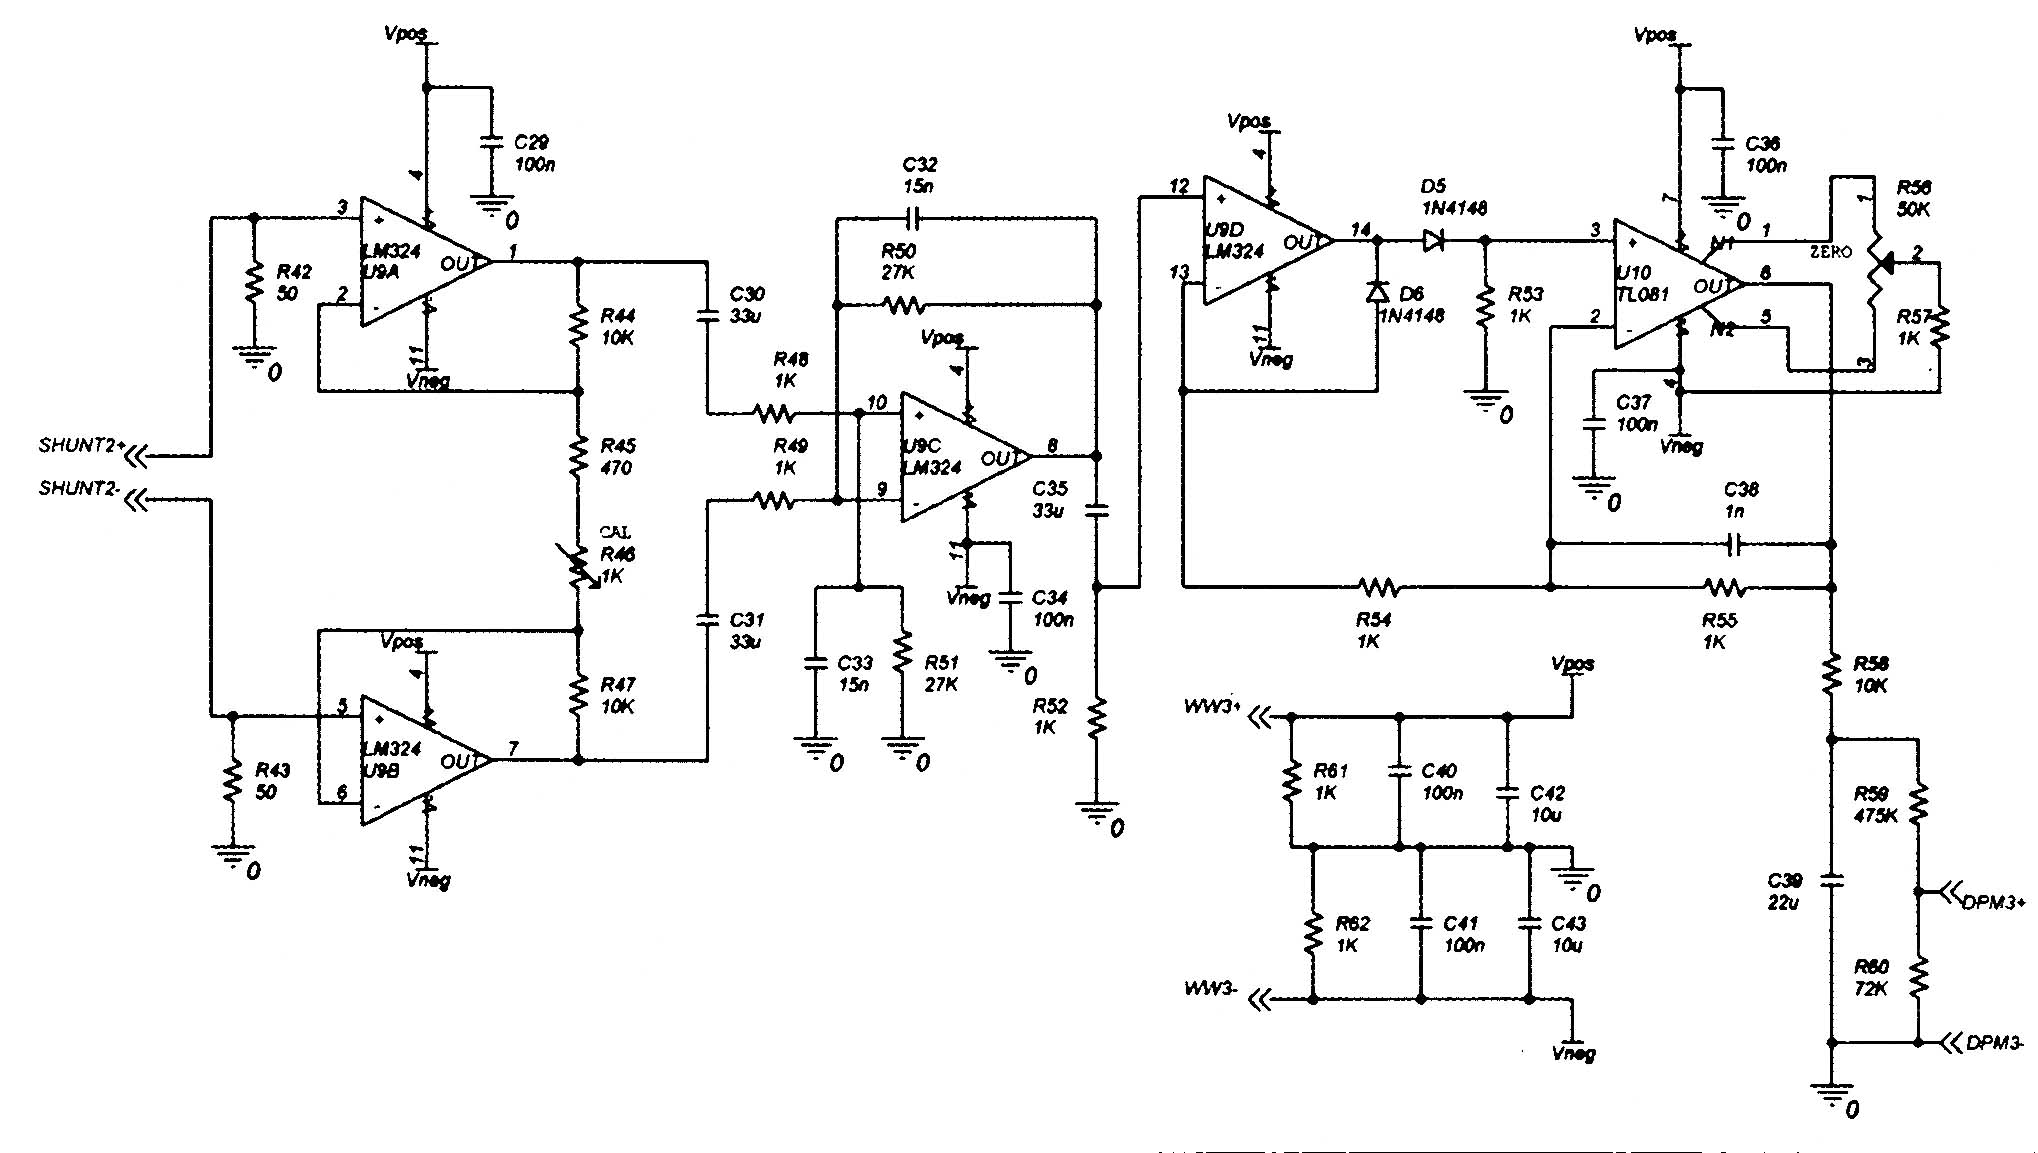
FIGURE 14: Schematic for ground leakage measurement circuit.
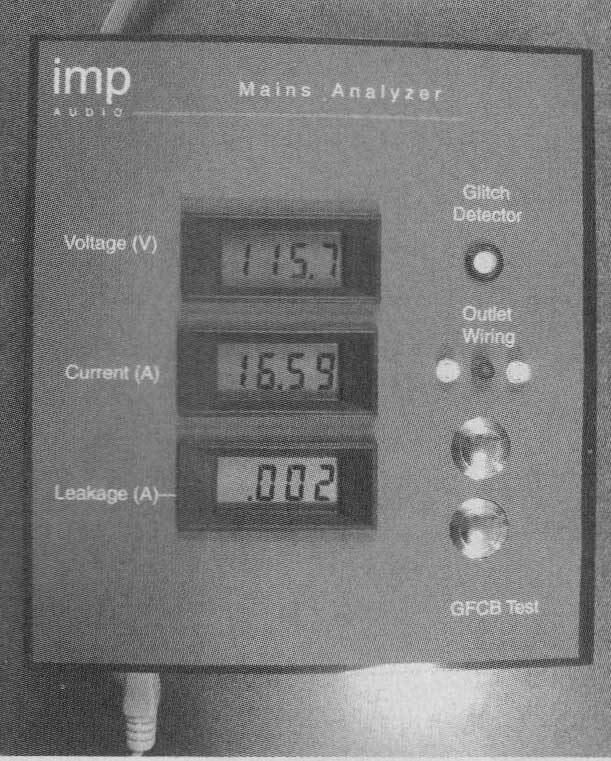
PHOTO 6: The completed Mains Analyzer in action.
Having been alerted to the fact the wall outlet is really a conduit for broadband noise, I feel obliged to take a look at the spectrum up to the RF bands. My soundcard samples up to 192Kb/s, which will give me almost 100kHz bandwidth, although I'm not sure how wideband my audio transformer is. Beyond that, I'll need to visit some of my radio engineer friends and borrow a real spectrum analyzer. I'm sure there's some interesting surprises higher up the spectrum just waiting to be discovered.
Never again will I be satisfied with a simple transformer, bridge, capacitor power supply-it's just not good enough for audiophile-quality electronics. The power supply for the 21st century needs to provide appropriate impedance to the mains supply from DC to light and much more broadband attenuation than a transformer-capacitor can provide. I should no longer contribute to the problem, so I want to research power-supply designs that present a purely resistive load, keeping the current waveform sinusoidal and in-phase with the voltage waveform. Noble goals, I'm sure.
Finally, for the mains tester, when I get a spare afternoon, I'm going to drop the impedances around the line current input amplifier to reduce the rectifier offset due to mains leakage. I think R27, 28 = 50 R29, 30 = 3300 C16, 17 = 120 nF will help center the zero pot (it's way over to one end on mine) while keeping the gain structure intact. I'm also considering changing the ground leakage current meter to be a ground-neutral voltage meter, although it may be better to just add a switch to the existing voltage meter-the jury's still out on that idea. In the meantime, I'm going to collect some data on ground leakage currents in typical installations.
There's also the open question of what's the right threshold for the glitch detector. At the moment it seems good for my house. On a quiet day (electrically speaking) it goes out and I can make it go on and off by turning on my office lights. But then I know I have a particularly quiet supply.
--------------
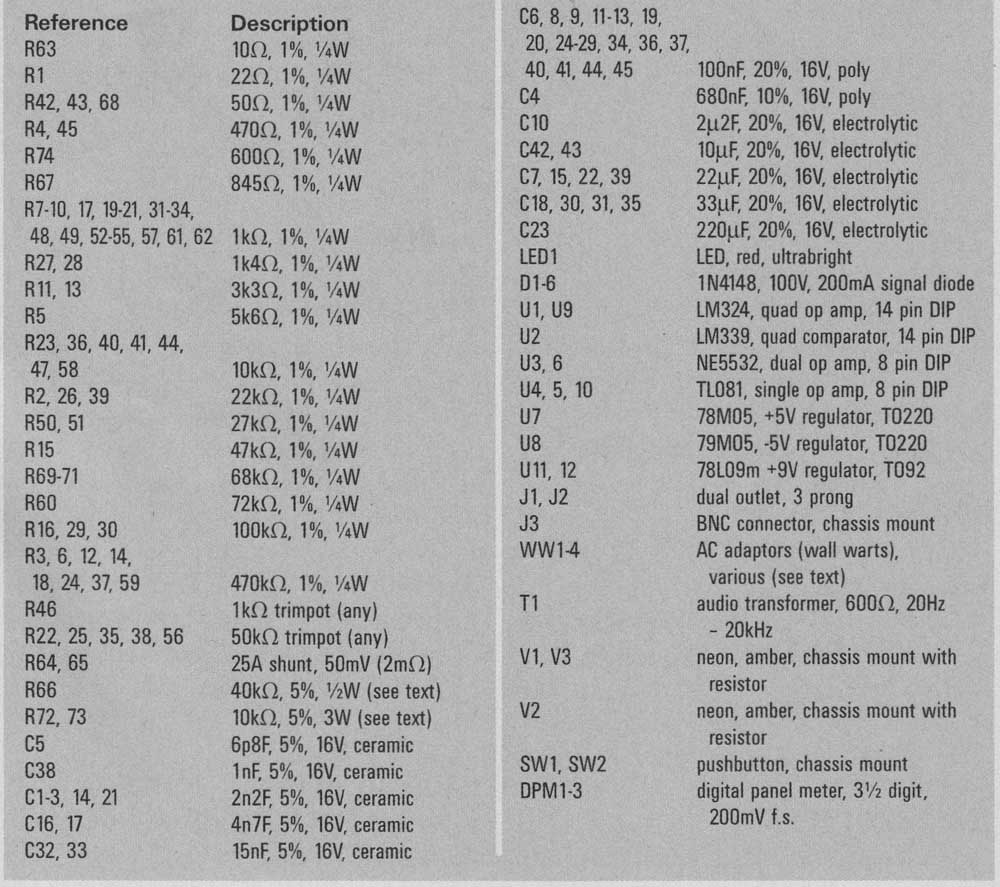
PARTS LIST
Reference | Description
Also see: