By Gill Grieshaber, CET
Contrary to popular belief, ac does not pass through a capacitor. Instead, the capacitor produces current that re-creates the ac at the output. Capacitors do "pass" dc (for a time), because the charging and discharging of a capacitor always is done with dc. You don't believe these statements? Then read on.
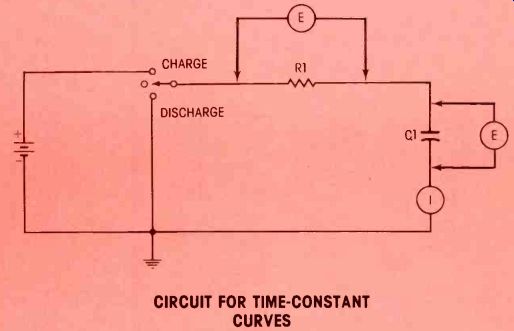
Figure 1--A three -position switch allows fast selection of charging or discharging
for the R1/C1 time-constant network. The time -constant is the same for both
charging and discharging. Resistance in megohms multiplied by capacitance
in microfarads gives the time in seconds for the rising capacitor voltage
to reach 63.2% of the supply voltage.
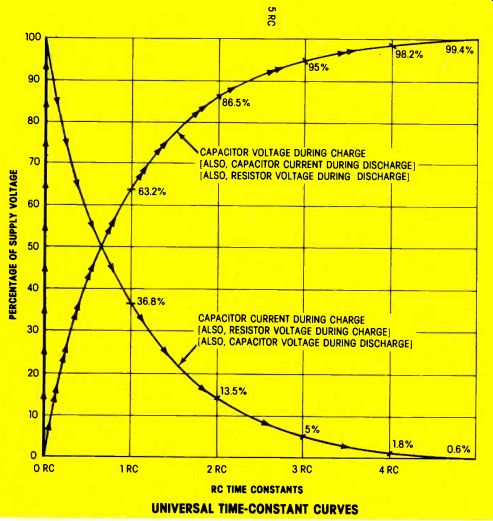
Figure 2--These two basic time-constant curves are produced by the circuit
of Figure 1. At turn -on, the current is maximum (the amount is determined
by the R1 resistance versus the supply voltage), but the capacitor voltage
is zero. As the capacitor accepts current, the voltage increases. However,
the capacitor voltage subtracts (in effect) from the supply voltage and this
reduces the current. In turn, the increase of capacitor voltage is slowed
by the decreased current. Both actions de crease each other. Therefore, the
curves begin as linear ones and then level off to become parabolic. They are
inverted images of each other.
Notice that capacitor current was maximum at the beginning of charge; so C1 was equivalent to a low value resistor. At the end of charge, no current was flowing; therefore, C1 was an open circuit. What's more, the charge is merely stored in the capacitor. No current passes through the capacitor.
Capacitor operation
Capacitors: simple and complex
Capacitors are mysterious little devices. Not because of their physical construction, for they are relatively simple. According to the capacitor symbol, they are two pieces of metal that are separated by a non-conductor. That's certainly not complicated. Neither are they mysterious because they rarely are seen in circuits. Capacitors are second only to resistors as commonly-used components.
No, the misunderstanding and confusion arises from the illogical things they do in actual operation.
Capacitors appear to do different things in different circuits.
Many half-truths are taught and believed about capacitors.
Incomplete models
One concept of capacitors is that they are only reservoirs for storing electrical power. They are compared to an electric bucket which alternately is filled and emptied of power. When used as filter capacitors in power supplies, they are called storage capacitors.
In school, most technicians are brainwashed into believing that a capacitor passes ac but not dc. This partial truth is reinforced by calling them "blocking" capacitors when they couple an ac signal. However, it's easy to prove that capacitors will "pass" direct current (at least for a time) under certain circum stances.
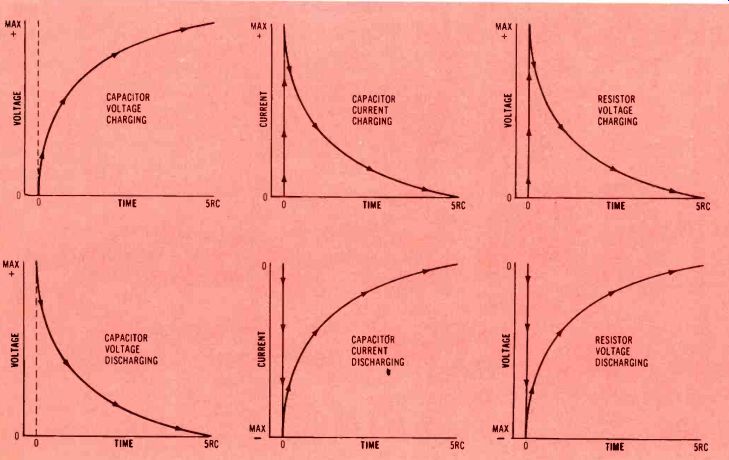
Figure 4--Six parabolic curves are formed by capacitor voltage, capacitor
current and resistor voltage during charging and discharging. The capacitor-current
and resistor -voltage curves are identical; a point to remember for future
use. Notice that four have positive voltage or current, but the other two
start at zero, instantly go to a maximum NEGATIVE value, and then trace the
usual parabola.
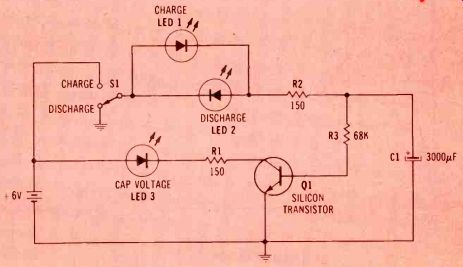
Figure 3--As shown here, LEDs can be substituted for the Figure 1 meters thus
providing instantaneous visual proof of both voltage and current during charging
and discharging. LED3 is prevented from loading the capacitor by the Q1 isolation
stage. LED1 lights brightly and dims rapidly during charge while LED2 does
the same during discharge.

---SW1 has been set to discharge for some time. Therefore, C1 has no voltage or current. (C1 is uncharged, and is prepared for maximum current of either polarity. The system is at rest.
--The pump is turned off, therefore the reservoir has no air pressure or flow. (The reservoir is uncharged, and is prepared for maximum flow from either direr; ion.) The system is at rest.

---After the voltage has risen to maximum and the current has decreased
to zero, SW1 is rotated to the off position. No current can flow because of
the open circuit, the voltage can't go down without current, and the dielectric
can't charge unless the voltage does. Therefore, these conditions remain as
they are. Orbits of electrons in the dielectric atoms were forced sideways
by the charging process and they now hold their positions. This is the end
of the charging cycle.
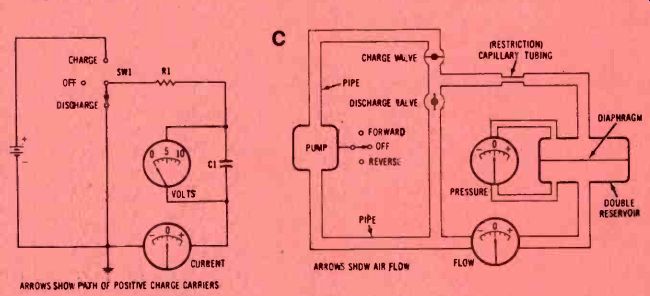
--After the pressure has risen to maximum, and the flow has subsided to zero, the pump is turned off and the charging valve closed. Therefore, the reservoir pressure is trapped, and it remains as it was. The diaphragm was bulged by the pressure, and it remains that way. Power was expended to raise the pressure and bend the diaphragm; it remains as possible (potential; power. This is the end of the charging cycle.
-- At the end of the discharge period, the voltage and current both are zero.
As the voltage welt down, the dielectric electrons were allowed to resume
their normal circular orbits. The dielectric now is discharged (uncharged),
and the system is at rest.
--At the end of the discharge period, both the pressure and flow are zero. As the pressure went down, the diaphragm was allowed to resume its flat original shape. The system now is discharged and is at rest.

------- SW1 is rotated to the charge position. C1 accepts maximum current (deter mined by R1) which decreases as the C1 voltage builds up to oppose it. Because of R1, the C1 voltage begins at zero and increases as the current tapers off. This is the active part of the charging cycle which ends when the C1 voltage equals the supply voltage.
------The pump is powered for forward pressure, the charge valve is open, and the discharge valve is closed. The reservoir accepts maximum air flow which decreases as the reservoir pressure builds up to oppose it. Because of the restriction, the reservoir pressure begins at zero and increases as the flow tapers off. This is the active part of the charging cycle.
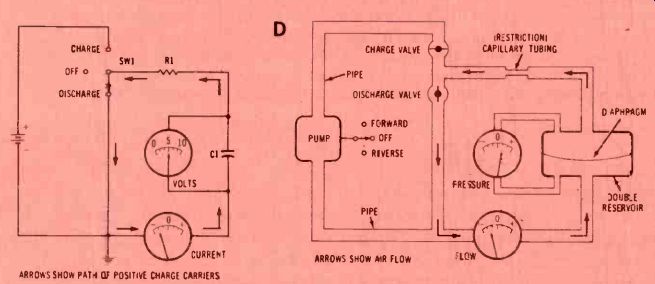
-------SW1 is rotated to the discharge position. The voltage is at maximum,
so maximum current flows through R1. Notice that it flows opposite to the
previous direction during charging. As the current flows it reduces the
voltage, and the lower voltage in turn reduces the current. This is the active
part of the discharging cycle.
-------The charge valve is closed, and the discharge valve is opened. Air flows through the bypass pipe, raising the pressure at the other end. Notice that the flow is opposite to the charging flow. The pressure and the flow both decrease. This is the active part of the discharging cycle.
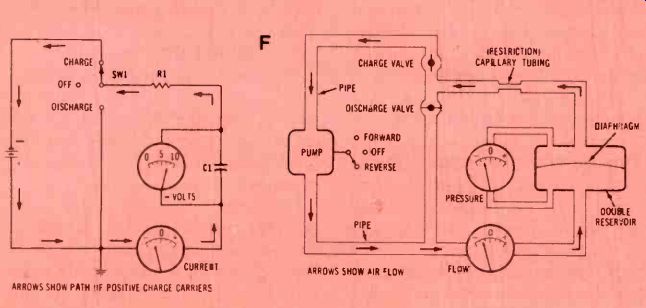
-----Figure 5--Time-constant current and voltage are compared with flow and
pressure in a "model" that operates by compressed air. Illustrations
labeled (A) show both systems in the inactive discharged condition. The (B)
drawings show beginnings of the charging mode. (C) gives the end of charge,
and (D) details the beginning of discharge (notice the reversed current and
flow). The (E) drawings show end conditions of discharge, with both voltage
and current measuring zero. Next, the (F) figures change to charging with
reversed polarity voltage and opposite flow. Both systems operate equally
well with either polarity.
Capacitor operation
Even the statement that "capacitors pass alternating current" is wrong. If sinusoidal ac voltage is applied to a capacitor, a wattmeter will read zero power. Therefore, capacitors can't pass ac the way resistors do.
In fact, no electrical power of any kind ever physically passes through a capacitor. Between the plates is a dielectric, which must be an insulator. No electrical charges of any kind actually pass through the dielectric from one plate to another.
Perhaps you disagree with that statement by saying, "But my scope shows the same ac waveform at each end of a coupling capacitor. It must be coming through the capacitor." Not so! The ac voltages at the input cause charging and discharging current there. However, the same currents also appear at the other end of the capacitor, and they cause identical voltages at the output by voltage drop across the resistors. In other words, the ac voltages are changed to currents which in turn re-create other identical ac voltages. But no charge carriers or voltages actually pass through the capacitor dielectric.
Capacitors also are said to clip transient peaks by absorbing them. That's an incorrect way of stating another capacitor characteristic. When used in R/C or L/C filters, capacitors integrate (average) the peaks, which rounds them and reduces the amplitude. A similar half-truth is that capacitors work to stabilize the voltage across them.
In these distortions of truth, no explanation is found for the effect called capacitive reactance. This is a term describing the way a capacitor can respond to ac voltages as if it is a resistor whose resistance changes according to the applied frequency. (More about capacitive reactance will be given later.) These half-truths can be clarified and many questions answered by a proper analysis of the one (and only) capacitor action. Otherwise, confusion continues, for the situation is similar to the blind men who gave conflicting reports after each examined just one area of an elephant. What to them appeared to be several vastly different animals was found to be merely the various parts of one elephant. Sc is with our capacitor "elephant." Capacitors are capable of doing only one action, but these various symptoms appear to indicate many functions.
Just "black boxes"
For this article, we'll not discuss in detail how capacitors work on the inside. Instead, we'll show how capacitors operate in actual circuits, according to measurements made by standard test equipment.
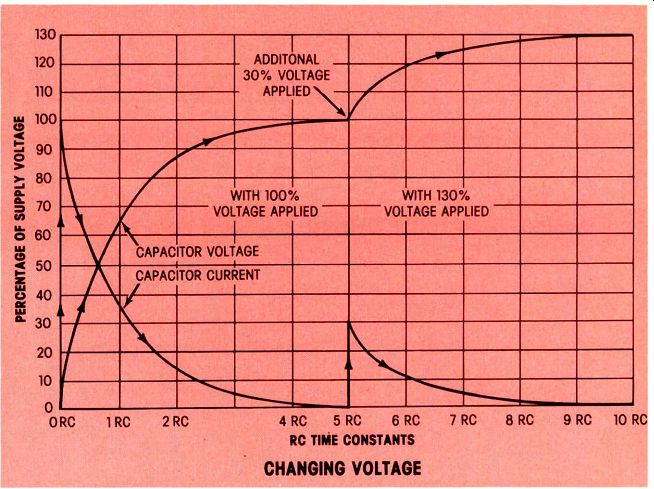
Figure 6---This illustration shows what happens to the capacitor voltage
and current when it first is charged and then the supply voltage is increased
by 30%. A new 30% charge occurs with the same parabolic curves, and the charge
is complete after another five time-constants. Operation with an ac input
signal is similar to this. Each peak of the signal produces a new charge with
the current following the time -constant curves (if allowed to complete them).
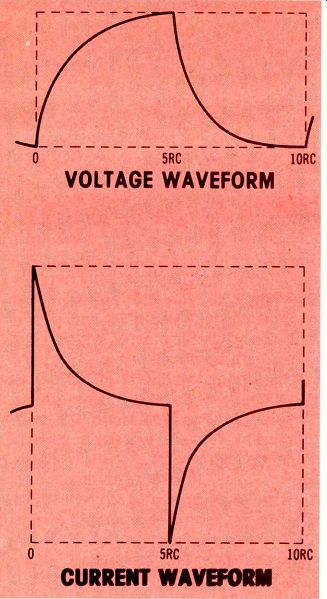
Figure 7--In actual operation, charges and discharges usually occur in succession.
(A) shows the voltage wave form produced by charging and immediate discharge.
(B) is similar, but it shows the current charge and discharge curves joined
together.
These two completed waveforms are part of square-wave analysis.
An old solution
Surprisingly, new and different extrapolations of the old textbook time -constant curves (of capacitor charging and discharging) provide answers to all the questions.
This material should be both interesting and informative.
Charge and discharge curves
The schematic in Figure 1 shows how to measure capacitor voltage and current during both charging and discharging modes.
Best voltage accuracy is obtained when the dc voltmeters are electro static types that draw no current from the tested circuit. However, if the time is lengthened and the current is increased by the choice of a large -value capacitor, the readings can be taken by two VTVM or FET meters and one current meter. Most digital meters can't follow fast enough. Later, we'll show how to use a scope for faster analysis.
Just watching the meters follow the voltages and currents will give you a feeling for capacitor actions that you won't soon forget. I recommend you measure these voltages and currents, although the accuracy of the Figure 2 curves have been proven many times.
Defining time–constant
The time -constant curves of Figure 2 were plotted for the Figure 1 circuit, and the operation of the circuit is described fully in the illustration. However, a definition of time-constant is needed.
For capacitor charging, one time-constant is the time required to charge a capacitor with 63.2% of the supply voltage, and for decreasing the capacitor -charging current to 36.8% of the turn-on maximum value. For discharge, it is the time required for the capacitor voltage to drop to 36.8% of the supply voltage, and for the opposite-polarity capacitor current to drop to 36.8% of the maximum discharge value.
This is the time-constant formula:
T = RC
where time (T) is expressed seconds, resistance (R) is in ohms, and capacitance (C) is in farads. Since farads are too large for practical use, the formula can be changed to:
Time in seconds = megohms times microfarads
Remember that each successive time -constant increases the capacitor voltage by 63.2% of the remaining supply voltage. In other words, at one time -constant, 36.8% of the supply voltage remains for future charging, so 63.2% of 36.8 V (Figure 2) is the increase during the second time -constant. And so on, as long as the charging continues.
A capacitor is considered to be fully charged after five time-constants (when the capacitor voltage is 99.4% of the supply voltage, and the current is only 0.6% of its maximum value).
Of course, all non -electrolytic capacitors charge just as readily and completely from a negative supply voltage as for the positive one shown.
Learn from the LEDs
The previous information has been verified theoretically and experimentally. But you can check the basic operation for yourself by constructing the simple circuit of Figure 3, and watching the lighting of the LEDs as you flip the charge/discharge switch.
Two LEDs of opposite polarity are used to show that the capacitor current for discharge is the reverse of the charge current. One lights for charge and the other for discharge.
An impedance-matching transistor is added to drive the capacitor-voltage LED. (If the LED is wired direct to the capacitor, the current would discharge the capacitor too quickly, thus upsetting the timing.) Only one LED is required to show the capacitor voltage, for in this circuit the voltage never can become negative.
Two curves or six? A point seldom mentioned or clarified is that the two curves of Figure 2 (with only minor alterations) serve also for the discharge capacitor voltage, the discharge capacitor current, plus the charge and discharge voltage drops across R1 (caused by capacitor currents).
Figure 4 shows all six curves in their general forms. Notice that two curves begin at turn-on with zero, go instantly to a maximum, and then resume the parabola. Two others begin at zero, but go instantly to a maximum negative value before tracing the parabola.
In fact, if (B) and (E) were placed properly, (E) should be moved down until the zero points are in horizontal alignment. The same applies to (C) and (F). Later, we'll show a practical example of (B) and (E).
Electric bucket with diaphragm dielectric I want to propose a new model for capacitors. Of course, all model/examples fall short of reality when carried beyond basic similarities, but this one is more exact than most. A capacitor is represented by a reservoir divided through the middle by a special diaphragm which bends from the pressure against it, but doesn't allow any gas or fluid to pass through it.
Refer to Figure 5 for a comparison of the capacitor and reservoir for five stages of charge and discharge.
Can ac pass through a charged capacitor? According to the previous facts, a fully -charged capacitor has no cur rent (either internal or external).
Any capacitor that couples two audio stages always has dc voltage applied' to it for much longer than five time -constants. It must be completely charged, and therefore is an open circuit. If it is open, then how can the ac audio signal pass through? There must be a valid explanation, since we know the audio does reach the second stage.
More than one charging and discharging
The compound curves of Figure 6 provide most of the answers to the preceding question. When the sup ply voltage of a capacitor is changed, the capacitor goes through another charge or discharge process (according to whether the voltage was increased or decreased) until it assumes a new charge (that is, with no current, but with full voltage across it).
Therefore, the charged condition is not permanent, but it changes from any voltage variation. In the same way, audio ac signals also produce new charge and discharge currents in a charged capacitor.
Next, an illustration is needed to make clear how the currents from charging and discharging (around, but not through) the capacitor can be changed into ac audio at the output of the capacitor.
Addition of two curves
The various curves of Figures 2 and 4 were isolated from each other. In actual operations, how ever, the charging and discharging often go on consecutively without any breaks in between.
For example, each waveform in Figure 7 was made by joining together two separate charge or discharge curves. The (A) waveform is a voltage capacitor-charging curve of five time-constants that's followed by five time-constants of a voltage capacitor-discharging curve.
(If the whole waveform looks familiar to you, it should. It's part of square -wave analysis, which will be discussed later.) The (B) waveform is a bit more tricky, since the half waveforms can't be placed on the same level.
A current capacitor-charging curve is the left half of (B), while the right half is a current capacitor-discharging curve. These are the same as (B) and (E) in Figure 4.
Notice that (B) ends at zero current, then (E) begins also at zero current but instantly drops to maximum negative current before it traces the prescribed parabola. When the ending zero of the first curve is lined up horizontally with the beginning zero of the second curve, the complete Figure 7B waveform is produced. (This waveform also should be familiar to you.) Important points Two important lessons can be learned from these combinations of time -constant curves.
First, square -wave analysis (which provides fast frequency-response in formation) is based on time-constant curves.
Second, capacitor current from charging and discharging can cause voltage drops across resistors. In those cases, the voltage waveform is an accurate rendition of the current waveform that produced it. Incidentally, the current-measuring function of a VOM uses the same principle. Current is sent through a low-value resistor, and the resulting voltage drop is measured by the meter.
A resistor (which is included to change varying current into a varying voltage drop) can be placed in series with either end of the capacitor.
Previous schematics showed a time-constant resistor (which is the equivalent of a plate or collector load resistor) at the capacitor input.
However, the capacitor charging and discharging currents also can produce voltage drops across a resistor that's in series with the capacitor output (grid or base resistor in audio stages). The same capacitor currents flow through both resistors; therefore, the wave forms will be identical.
At the capacitor output, these charging and discharging currents produce half waves of positive and negative current (see Figure 7B for square waves) which combine at the capacitor output to produce a complete current waveform. Voltage drop across the output resistor changes the current waveform into a voltage waveform that drives the tube or transistor. Figure 8 shows a typical audio-coupling circuit.
This is proof that the ac signal itself did not pass through the capacitor.
For most frequencies of ac, the effect is the same as the old cliche, "passing the ac and blocking the dc." However, with some time-constants, the amount of ac that passes is attenuated by an effect similar to resistance. Yes, it's another masquerade; one effect that seems to be another.
The name of this capacitor characteristic is capacitive reactance, and it explains how a small coupling capacitor can attenuate low frequencies more than it does high frequencies. However, we will discover that capacitive reactance is just one more effect produced by the time-constant charging and discharging.
Capacitive reactance
In many ac circuits, a capacitor acts as though it is a resistor whose resistance value varies according to the frequency of the signal. This capacitor characteristic is called capacitive reactance. It can cause a capacitor to function as if it is almost an open circuit at low-frequency ac, or as almost a short circuit at high frequencies.
Capacitive reactance has a formula which is supposed to be memorized by students and engineers. However, our purpose here is to show how it operates, and not how to calculate it. Capacitive reactance is most important in tone-control circuits, coupling capacitors, and bypasses.
Keep in mind that transferring all of the input signal indirectly to the output first requires the capacitor to be uncharged. (A charged capacitor is an open circuit.) Therefore, to (apparently) pass an ac signal through a capacitor without attenuation requires the capacitor to be uncharged (or discharged, which is the same thing) for most of each half cycle.
We all know that a very low-frequency sine wave becomes an attenuated sine wave with leading phase at the output of a coupling capacitor. Therefore, square waves will be used to show the reason for the loss.
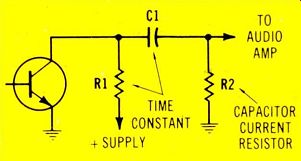
Figure 8--Identical current flows at each end of a capacitor, although it
does not flow through the capacitor.
The C1 voltage is changed by R1 versus the varying collector/emitter resistance of the transistor. This produces current at the R2 end of the capacitor. One polarity of current comes from one peak of the ac signal, and the opposite polarity of current is produced by the other peak. These currents both pass through R2 thus forming the same ac waveform as that at the transistor collector. The signal did not pass through the capacitor, but the charging and discharging currents caused voltage drops across R2, thereby re-creating the collector signal that is at R2.
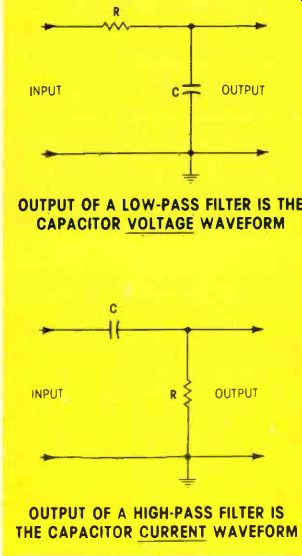
Figure 9 These are two variations of the time-constant circuit. When the
voltage or signal is taken from the capacitor, the output is the capacitor
voltage. This (A) circuit also is called a low-pass filter. The (B) circuit
is a high-pass (or low-frequency attenuation) circuit because the output is
taken from the time-constant resistor.
Square waves versus time-constant
Remember that any voltage across a coupling capacitor produces a loss of ac signal at the output, and only an uncharged capacitor has no voltage drop across it. Also, the voltage at a capacitor's output is generated by current. (The capacitor charging is powered by the supply voltage and capacitor current is produced. But the output voltage is developed by the capacitor current producing a voltage drop across a resistance.) A time-constant filter can be inverted. Figure 9A shows the usual circuit for illustrating time -constant curves. It also is a low-pass filter (which produces lagging phase), and the output signal is the voltage curve of the capacitor for charging or discharging.
Figure 9B is just the reverse. The capacitor charging is exactly the same. However, the output is taken from the time-constant resistor, and the waveform is a voltage replica of the current waveform.
Since coupling capacitors operate with current, the circuit of Figure 9B will be used along with a scope and square-wave generator.
Current waveforms
The current waveforms of Figure 10 will prove that capacitive reactance is a function of time-constant charging and discharging. These are genuine scope waveforms with some parts of the curves outlined to make them easier to follow. The current charging curves are in the upper right corner of the scope graticule, with four squares of height (each square representing 25% amplitude) and five squares of width (for the five time-constants).
A sine/square wave generator provided the input signal and a scope furnished the current time-constant curves.
In the Figure 9B schematic, C was .01 and R was 20K, for a time constant of 0.0002 seconds. But one complete waveform requires 10 time-constants, so the waveform must require 0.002 seconds, which is 500 Hz. When a 500 -Hz square wave was fed to the time -constant network, the result was the classic current capacitor -charging wave form.
The sequence of waveforms in Figure 10 shows that the 60-Hz curve had current for a very short time (all current was ended after a half time-constant). Then, each curve from 120 Hz on up to 4000 Hz had progressively more current.
In fact, at 4000 Hz the current flowed for most of the half cycle, representing nearly zero attenuation.
At 60 Hz, therefore, the capacitor output had very little current, a small voltage was developed across the resistor, and the attenuation was very high. Each higher frequency in turn produced more current, a higher voltage was at the output, and the attenuation was reduced.
This test was performed with square waves, but frequency response curves of the same filter using sine waves gave these results:
60 Hz -22 dB 120 Hz -16 dB 250 Hz -10 dB 500 Hz -6 dB 1000 Hz -2 dB 2000 Hz -1 dB 4000 Hz 0 dB 8000 Hz 0 dB
Not only did the actual frequency response curve verify the prediction, but it told us that a -6 dB response at the 10-time-constant frequency produced the classic current capacitor -charging curve! As mentioned before, when a low -frequency sine wave entered the time-constant high-pass filter, the output wave form always was a sine wave (although the amplitude was reduced and the phase was leading).
The time -constant theory explains the operation with sine waves as easily as it does the square -wave operation. The current reaches a reduced maximum early and it also decreases ahead of the input wave because the actual time constant is too short for that low frequency (which would have required a longer one for a more-extended current time). If this is not clear, we'll discuss it thoroughly in a later article.

Figure 10--Current waveforms of square waves show how much of each half cycle
of ac has capacitor current. Current that flows for most of each half cycle
indicates the capacitor will pass ac of that frequency with little attenuation,
while a short pulse of current proves sine waves of that frequency will be
greatly attenuated.
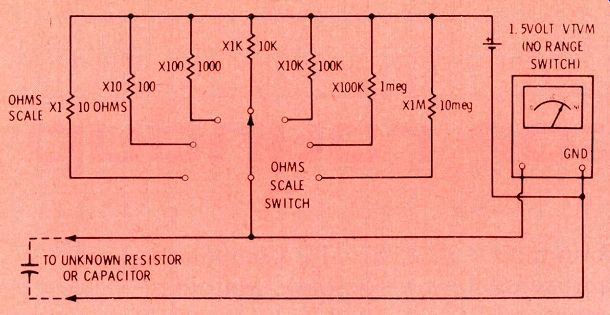
Figure 11--The ohmmeter function of a VTVM becomes a time -constant circuit
when a capacitor is tested. All of the components (except the capacitor being
tested) are inside the VTVM. Capacitance can be measured by the seconds required
to reach 0.95 volts or 17 on the ohms calibration.
Capacitance with VTVM
By using your knowledge of time-constant curves and a VTVM, you can test capacitors from about .05 microfarad to the largest filters.
Examine the schematic of Figure 11. Neglecting the voltmeter part of the VTVM (which without a range switch is extremely high impedance and will not affect the results), the range -switch resistors and the un known capacitor that's to be tested form a conventional time-constant network fed by the 1.5-V battery.
(Of course, the battery, switch and range resistors are all inside the VTVM. Only the test capacitor is outside.) According to theory, the capacitor voltage should rise to 63.2% of the 1.5-V battery voltage in one time -constant. Therefore, on the X100K range (the only direct-reading capacitor test), the capacitor voltage should rise to 0.95 V in the first time-constant. For a 1-pF capacitor, the time -constant is 1 second. For a 100-pF capacitor, the time-constant is 100 seconds and the pointer should reach 0.95 V in 100 seconds.
The +0.95 V can be read on the 1.5 VTVM scale, or it corresponds to the 17 mark on the ohmmeter scale.
There are only two precautions.
The capacitor must have the leads shorted together for several seconds before the test, and the capacitor must not be too leaky. If the reading never goes above the 17 (or 0.95 V) mark, the capacitor is leaky and the measurement is not valid.
Here are the four multipliers:
Using the X1K range, multiply the seconds by 100 to give the capacitance in microfarads.
Using the X1OK range, multiply the seconds by 10 to give the capacitance in microfarads.
Using the X100K range, the reading in seconds is the capacitance in microfarads.
Using the X1M range, divide the seconds by 10 to give the capacitance in microfarads.
Summary
Regardless of what a capacitor appears to be doing in a circuit, the one and only capacitor action is to accept an electric charge, store it and then discharge it into a load.
Current meters connected to the external circuit will show current into and out of a capacitor during the charging and discharging modes. However, this current is not continuous because no current actually travels through the capacitor dielectric.
When properly interpreted, the charging and discharging of electrical power explains those actions that appear to be distinctly different and separate. Each newly applied voltage causes another charge or discharge which flows through the circuit outside of the capacitor.
Therefore, the electrical storage in B+ capacitors, the capacitive reactance of bypasses and RC frequency equalizers, and the apparent passing of ac through a coupling capacitor all are produced by the capacitor charging and discharging. Also, the changes of waveshape when square waves are sent through high-pass and low pass filters are caused by capacitor charging and discharging in the shape of time -constant curves.
So remember, neither ac nor dc actually goes through the capacitor, but the charging and discharging currents can re-create an ac wave form at the capacitor output. Each separate flow of dc current into or out of a capacitor continues for no more than five time-constants.
Also see:
Selecting replacement capacitors