Calibration of vertical gain and sweep-time controls is a valuable feature of all triggered scopes. Peak-to-peak voltages can be checked directly. And the repetition rate of a signal can be obtained by measuring the time of one cycle and doing a simple calculation. Other subjects for discussion include delayed and expanded sweep, measuring signal delay and rise times, how dual-trace operation works and how to measure dc volts.
By Gill Grieshaber, CET
Vertical gain
A similar arrangement of calibrated switch positions and uncalibrated variable controls is used in the vertical deflection circuit. The switch is calibrated in "volts/cm" or "volts/div." Usually the calibration is correct when the concentric variable-gain knob is turned clock wise until the switch clicks.
For accurate measurements of either ac peak-to-peak or dc voltages, the control must be in the calibrate position.
One Sencore scope has vertical calibrations only for an X10 probe.
Tektronix has a double calibration system (Figure 1). Two transparent areas of the knob expose the calibration for an X1 direct probe (left side of knob) and another calibration for an X10 probe (right side). It's advisable for an X10 low-capacitance probe to be used for all measurements, and these direct calibrations help prevent mistakes.
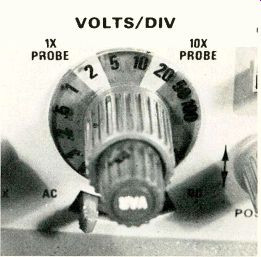
Figure 1---Vertical gain that determines the waveform height is controlled
by a calibrated switch and an uncalibrated knob. For accurate measurements,
set the variable control to the calibrate position.
Figure 2 shows the effect (beginning at the top trace) of 5 V, 2 V, 1 V and 0.5 V sensitivity. With the variable gain control, any intermediate vertical height can be obtained.
Newer color TV receivers (that have ICs in the chroma section) operate typically with very low signal levels, perhaps only 0.1 VPP or even lower. An X10 low-capacitance probe always should be used with chroma. Therefore, assuming a chroma signal of 0.1 VPP and a probe loss of 10 times, the scope maximum sensitivity must be 0.01 V (10 mV) for a height of only one division. This is a minimum, for more height is desirable, and future equipment might have even lower signal levels. Therefore, it's advisable for a new scope to have a maximum sensitivity of 5 mV or better.
At the other end of the voltage range, most scopes should not have more than about 600 V peak (or peak ac plus dc) at the input connection to prevent internal dam age. Of course, an X10 probe increases the maximum allowable.
Measurements of sweep pulses up to almost 1,000 V are necessary for solid-state TVs. Therefore, a scope for TV work should have minimum range of 10 V/div. Multiplication by the X10 probe over the typical 8 graticule divisions allows maximum measurements up to 800 VPP.
Signal delay line
When a conventional triggered scope is called on to display pulses or square waves, the leading (or trailing) edge which triggered the sweep is not seen. The edge reached the triggering circuit at the same time as it arrived at the vertical circuit. But the small amount of time necessary for the sweep to begin allowed the triggering edge to be finished before the sweep started.
Because the triggering cannot occur before the triggering voltage arrives, the opposite action must be taken: the arrival time of the signal must be delayed in the vertical amplifier.
In scopes that have the feature, the vertical signal time delay is accomplished by a delay line, which operates by the same basic principle as that of color TV delay lines, although the delay time is shorter.
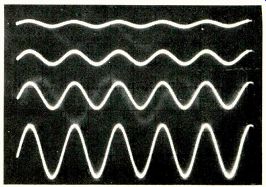
Figure 2--These are the waveform height changes at volts/div settings
of 5 V (top trace), 2 V, 1 V and 0.5 V. The variable control plus these
switch positions can produce any desired height.
Waveforms from a scope without a signal-delay line and another with a delay are shown in Figure 3.
Some scopes that do not have a delay line appear to show the triggering edge, because the beam starts at zero and moves up (or down) to the flat peak before starting the normal sweep. Thus at long-sweep times and low-rep-rate square waves, the initial edge seems to be there. However, a fast rep-rate signal (100 kHz used in Figure 3) shows definitely that part of the first peak is missing.
The A picture of Figure 3 shows the second square wave has a center width of 2.4 divisions, while the first one has only 1.6 divisions because lack of a delay removed the edge and part of the peak. Figure 3B is the same signal when re produced on a scope that has a signal-delay line. Both the first and second square waves have the same width across the center, proving that none of the waveform is missing.
Incidentally, the two pictures also illustrate a fraction of the waveform differences between a 10 MHz scope (waveform A) and one rated at 35 MHz. The rise time is better and the corners are sharper in the B waveform. Actually, the difference should be greater, but the generator is the limiting factor here.
Makeup of pulses
The terminology and makeup of pulses and square waves are shown in the drawing of Figure 4.
Sine waves can be described adequately by stating the amplitude in either RMS or PP voltages plus the frequency in Hertz (cycles per second), because all sine waves have the same shape. However, pulses and square waves must be de scribed in more detail. The number of pulses that occur during each time period is the repetition rate.
Also, a scope can be used to measure the time of one cycle between identical points of two successive cycles. Usually, the measurement is taken between leading edges (Figure 4).
A full pulse specification would list the pulse width (the on time) in addition to the off time and the repetition rate in Hz or time. In fact, present practice is to list all specs in terms of time (except amplitude, of course). For example, the pulse in VIR systems that corresponds to video line 19 is called a 63.7 us pulse that occurs once every 0.0167 s (or 16.7 ms). (In video terminology, this is one horizontal line having a vertical-field repetition rate.)
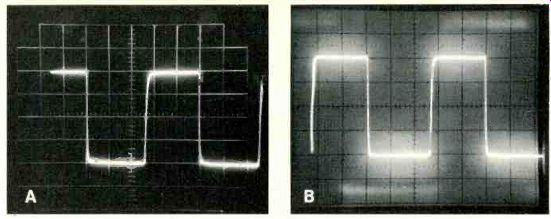
Figure 3 Scopes without a signal-delay can't display the initial triggering
edges of fast-repetition pulses or square waves (see picture A). The
same signal but from the CRT screen of a scope that has a signal-delay
line is shown in picture B. All of the leading edge is visible.
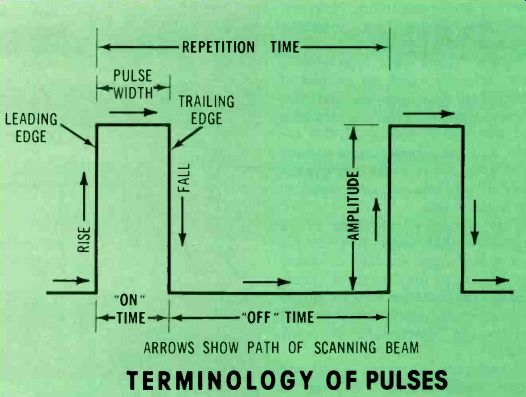
Figure 4---Pulses and square waves must be described by more specs than
are necessary for sine waves. Arrows show the path of the beam that traces
the waveform.
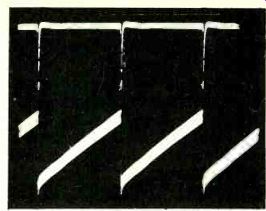
Figure 5---Waveforms with thick horizontal or base lines usually have
other frequencies mixed with the desired signal. Horizontal pulses produced
these fat lines on the vertical wave forms.
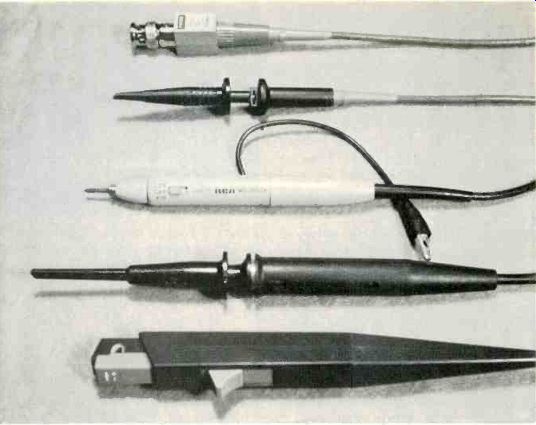
Figure 6---The correct kind of compensated probe is vital for complex
waveforms.
At the top are the two ends of a Tektronix probe. An X1-X10 RCA probe is in the center. Below it is a B&K-Precision probe which can be changed rapidly for either X1 or X10 operation. At the bottom is one end of a Tektronix current probe. One jaw is slid back, thus allowing a wire to be placed between the two halves. A matching network is at the scope end. Current waveforms are very important in many cases.
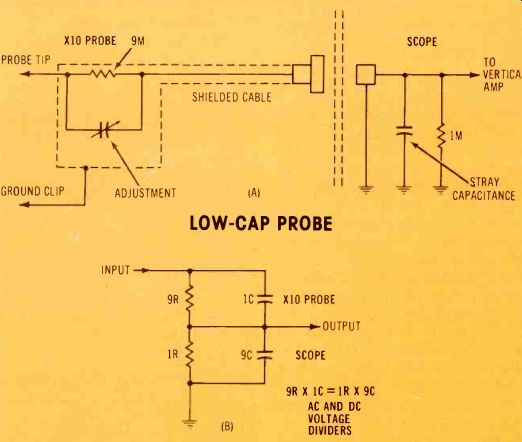
Figure 7--Flat frequency response from dc to high frequencies is possible
with an X10 scope probe only when the dc and ac voltage dividers are
perfectly matched. (A) This is the schematic of most X10 probes. The
variable capacitor in the probe is adjusted for flat response. (B) When
the circuit is simplified, the two voltage dividers can be seen clearly.
Important probes
Unshielded test leads never should be used with sensitive scopes, without proper shielding, the desired waveform probably will have a mixture of hum, CB and other radio carriers plus horizontal pulses from TV sweeps. More of these interferences exist now, and the signal levels in typical equipment are lower than ever.
Even when the shielded lead and probe that come with the scope are used, two other precautions should be observed. For pulses and complex waveforms, use the ground provided at the scope probe. Ringing and other waveform distortions can occur if the only ground is a lead connected between scope ground and circuit ground.
Also, connect the scope-probe ground to the common ground of the stage where the waveform measurement is being made. This is especially important where the signal amplitude is small and the interference level is high.
If the interference has a widely different frequency, it might be visible as "fat" horizontal lines on the waveforms (see Figure 5). Another example is horizontal-sweep pulses that appear erratically mixed with chroma signals in color receivers.
Proper probes and probe grounds plus a wise choice of grounding point on a circuit board will provide dependable waveforms and prevent wasted time from wrong diagnosis.
Low-capacitance probes--The twin benefits of X10 low-capacitance probes (Figure 6) are higher impedance and reduced capacitance at the probe tip. These reduce circuit loading while permitting the cable to be shielded. The only trade-off is the 10-times loss of signal at the scope input. However, most new scopes have sufficient gain even with this loss.
Figure 7 shows one type of X10 probe schematic and the method of compensation to provide flat frequency response. Both a resistive and a capacitive voltage divider are used, and the compensation capacitor is adjusted to make the capacitance divider loss precisely equal to the resistive loss.
This probe adjustment is so important that most new scopes have a test signal (usually a square wave) available on the front panel.
Wrong compensation causes amplitude errors at high frequencies and distorts the waveshapes of many signals.
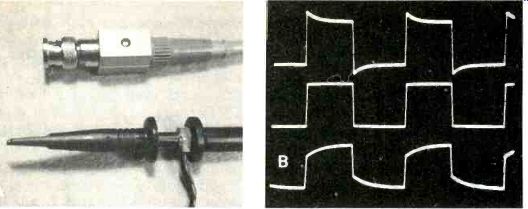
Figure 8 (A) Some X10 scope probes (such as this one from Tektronix)
have a different circuit. The scope capacitance (not probe capacitance)
is varied by a trimmer placed in the box at the scope end of the cable.
(B) Top trace shows the calibration waveform when the compensation is
excessive. Correct compensation is shown by the level tops and bottoms
of the center trace.
Under-compensation is indicated by the rounded corners of, the bottom trace.
Waveforms of under, over and proper compensation are given in Figure 8. However, some probe adjustments change the waveform only near the edges (narrower pre-shoot and post-shoot).
Which probe?--Several readers have asked which probe should be used in video, sound IF and vertical-sweep circuits. Use the low-capacitance probe for all of these.
RF/IF/chroma detector probes are available for use with alignment or for demodulation during signal tracing of those signals that are above the response of the scope or which need detection. These probes are valuable when they're needed.
But, they are not for everyday troubleshooting.

------Figure 9 Shortest sweep time of the Tektronix T935 is 0.1 uS, which
can be extended to 0.01 uS by adjustment of the X10 variable sweep-width
control.
---- Figure 10 The signal frequency can be measured by a combination of the calibrated horizontal sweep and the graticule markings. (A) One cycle of square wave covered 8.25 divisions when the sweep time was 2 mS/div. Therefore, the repetition frequency was 60 Hz. (Multiply divisions by the sweep time and divide the answer into 1 to obtain the frequency.) (B) The video waveform was shown at 5 mS/div (top) and 2 mS/div (bottom). Time of 1 cycle was about 16.6 mS, giving 60.2 Hz as the vertical frequency. (C) For top trace, the sweep time was 20 uS/div; and 10 divisions en closed slightly more than three cycles. At 10 uS/div (lower trace), one cycle covered 6.33 divisions for a total of 63.3 uS or about 15,797 Hz for the horizontal frequency. The frequency accuracy is sufficient for most tests.
Use an X10 probe (or keep an XI-X10 probe set at the X10 position) for all measurements. If the amplitude is too small, then change to the X1 direct probe.
Measuring signal frequencies
Last month, the sweep time/division switch was discussed only regarding the number of waveform cycles it provided. However, triggered scopes have calibrated sweep times that can be used to measure the repetition rate of many wave forms. The accuracy of these readings can be good, since the sweep times are rated between + 2% and 5% plus any parallax or reading errors.
The Tektronix scope of Figure 9 has 21 ranges of calibrated sweep times between 0.5 s and 0.1 us plus a variable giving up to X10. The B&K-Precision that I use most of the time has 16 ranges from 100 ms to 1 us plus a fixed X5 magnifier.
The sweep time/div multiplied by the number of graticule divisions used for one cycle gives the total time of one cycle of signal. And the reciprocal of this time of one cycle is the signal repetition frequency.
(The reciprocal is 1 divided by the time figure; a math function that's easy to do by using a small calculator.) Three examples of measuring frequencies with a calibrated scope are given in Figure 10. Study them carefully. All are very easy to do and require virtually no time. Of course, if the frequency is known, it's also easy to find the scope sweep time required to display that frequency.
Table 1 gives typical examples of often-used frequencies versus the time/div settings that produce 10 cycles, 2 cycles or 1 cycle of wave form over the whole CRT screen. Also given are the formulas for changing time per cycle to repetition frequency or frequency to time.
Accuracy of these frequency measurements depends partially on the visual measurements from the CRT screen, as illustrated in Figure 11. The brighter top and bottom peaks of pulses and square waves tend to make the spot enlarge. So it's difficult to be certain where the exact corner is located; while the fast rise and fall edges are nearly invisible.
Therefore, improved accuracy can be obtained when fewer than 10 cycles are viewed on the screen.
Figure 11A shows the basic condition of one cycle per division, where the frequency is equal to the reciprocal of the time value set by the time/div switch. However, maxi mum accuracy is possible when only 1 cycle (Figure 11B) is covering the whole screen. Of course, the time/div setting must be multiplied by 10 divisions to give the total time of one cycle.
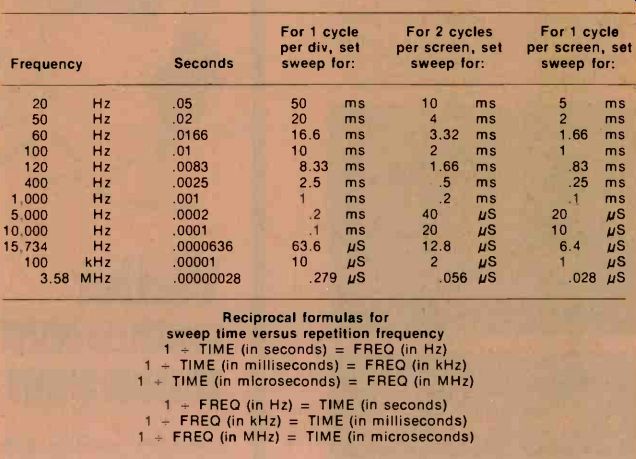
Table 1 Many of the often-used frequencies are listed with the scope
sweep times required to show 10 cycles, 2 cycles or 1 cycle across the
whole screen. Also included are the formulas for changing sweep time
to frequency and frequency to scope sweep time.

Figure 11--- Accuracy of frequency measurement is better when fewer cycles
are on the CRT screen. (A) 1 mS sweep time shows 10 cycles of a 1000
Hz square-wave signal. (B) A change of 0.1 mS reduces the display to
one cycle and allows better accuracy of measurement.
Figure 12---Five variations of single-trace or dual-trace operation can be selected by the mode switch of this B&K-Precision scope.
Dual-trace operation
Many of the new scopes can show two waveforms simultaneously by the dual-trace method. The mode switch shown in Figure 12 offers a choice of Channel A, Channel B, or both in either chopped or alternate mode. Also, provision is made for adding or subtracting the two wave forms, which is valuable for showing distortion and for minimizing common-mode hum or noise.
The differences between alternate and chopped modes of dual-trace operation are illustrated in Figure 13. For alternate, a complete Channel 1 waveform is traced, followed by a complete Channel 2 waveform, and so on. Flicker is very noticeable at slow sweep speeds. Therefore, alternate mode is recommended only for short sweep times and high-frequency signals.
Chopped operation slices both waveforms into small segments (Figure 13C) by a sampling circuit operating above 100 kHz. When the signal frequency is low and not harmonically related to the sampling frequency, the tiny segments form complete waveforms. High signal frequencies often display interference patterns. Chopped mode should be used only with long sweep times and low-frequency signals.
Measuring rise time
Rise time of a pulse or square wave is defined as the amount of time required for the leading or falling edge to trace between 10% and 90% of the total amplitude.
Many square waves appear to have perfectly perpendicular edges, but that's only because those edges are not expanded enough by the scope. Figure 14 gives the details of measuring two square waves. One was a probe-calibration waveform; the other was from a sine/square generator. Evidently the calibration waveform was obtained from a clipped sine wave, for the fall time in Figure 14A was a long 12,000 ns.
By contrast, the generator wave form fall time measured 60 ns. Of course, this included the fast rise time of the scope. But it can be disregarded when it is much less than the measurement.
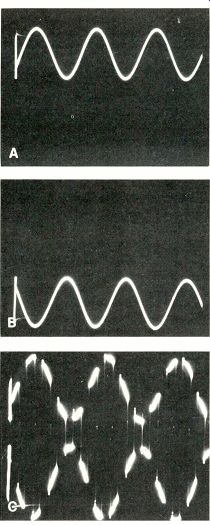
------Figure 13 Two types of dual-trace operation are illustrated by
these waveforms. During alternate mode, the scope traces one waveform
(A) completely, then it traces the other complete waveform (B). But with
chopped mode, a small segment of the upper waveform is displayed, then
a tiny segment of the lower waveform is traced while the first is blanked
(C), and so on until all parts of both wave forms are displayed. These
chopped segments appear to be a continuous waveform when the signal frequency
is much lower than the sampling frequency. Incidentally, it's difficult
to show the C waveform. This sine wave was about 15 kHz, which was varied
carefully until the segments were motionless.
Expanding waveforms
Another operation that recurrent scopes can't do is to magnify wave forms. Triggered scopes have three ways of expanding the waveforms.
Two methods often are used together for maximum expansion.
Two functions that can be done by almost all triggered scopes were used to produce the waveforms in Figure 15. The signal source was the bar sweep pattern (five bursts of different frequencies) from the Sencore VA-48 Video Analyzer.
The waveform was locked at 5 mS sweep and showed three vertical fields. Then, without any additional locking (triggering), the waveform was expanded by using shorter sweep times. At 50 us, about 8 horizontal video lines could be seen.
This was reduced to less than 1 video line at 5 us.

Figure 14---Rise time can be checked easily with a triggered scope.
Rise time is the time required to trace between the 10% and 90% points
of a rising or falling edge. (A) The 10-to-90 part of the waveform used
2.5 divisions at 5 uS/div, so the rise time was 12,500 ns. (B) Top trace
is a normal display of the A waveform, while the C waveform is shown
by the lower trace which has a faster rise time. (C) This rising edge
used 1.2 divisions at 0.05uS/div, for a rise time of 60 nS.
More expansion of the waveform's right area was needed. How ever, a shorter sweep time would expand the left side while driving the right edge off the screen. Since this was the area of interest, no shorter sweep time could be used.
If the high-frequency bursts were to be magnified any more, another method was essential.
That other method was an increase of sweep width (which gives some benefits of a shorter sweep time). Although most scopes have a fixed X5 width expansion, the one of Figure 15C was variable with an X10 maximum. Notice that the sweep contained the same less-than-one video line as before (Figure 15B), but 90% was off the screen and invisible. The remaining 10% was stretched to cover the entire screen width. Then, by operation of the horizontal-positioning control, the waveform was moved sideways to show the 3.06-MHz portion (Figure 15C center trace) and finally the 3.56-MHz section (bottom trace).

Figure 15 Video waveforms can be expanded enormously by a triggered
scope, as shown by this generator signal. (A) Three vertical fields are
shown at 5 mS/div time (top trace). Changing to 1 mS/div (center trace)
allows display of less than 1 field. A sweep time of 0.1 mS/div shows
only slightly more than the vertical interval (bottom trace). (B) When
triggered properly at 50 uS, about 8 horizontal lines of video are shown
(top trace). A time of 10 uS shows less than two lines (center trace),
and 5 uS restricts the waveform to less than one line (trace at bottom).
That's as far as this method should be used, since the bursts at the
right are to be examined. (C) The same 5 uS and X10 trace expansion plus
positioning reveals part of the 0.75 MHz and 1.51 MHz bursts (top trace).
Moving the waveform to the left allowed the 3.02 MHz burst to be seen
(center), and more positioning to the left shows the 3.56-MHz burst.
Figure 16---The seconds/division switch assembly of the T935 Tektronix has three functions. The position of the large knob determines the primary sweep time. When it is pulled out and turned to the right, the sweep time of the delayed sweep is selected. The small knob at the outside is a variable width control with calibrated X1 and X10 positions at the stops. Also, the three buttons and knob at the left are used with the delayed sweep. This delayed sweep can greatly expand small areas of a waveform.
About 20 cycles of the 3.56-MHz burst occupied the whole screen width, and they were revealed as having near-square waveshape. A scope of narrower bandwidth would show them as sine waves.
Delayed sweep-A few scopes (see last month's chart) have another method of expanding selected parts of waveforms. The feature is called delayed sweep and it requires a second time-base generator.
Some scopes have separate primary and secondary time-base controls and calibrations. Others combine the two. As shown in Figure 16, the T935 Tektronix has a large knob which usually rotates the plastic skirt that has two black lines (indicating the primary sweep time). When delayed sweep is selected by the display mode but tons (at the left), the large knob is pulled outward and rotated separately clockwise (while the skirt with the lines does not move). The two black lines on the skirt show the main time-base time, and the white line on the large knob points toward the sweep time of the delayed sweep. In the picture, the main time is 2 ms, and the delayed time is 0.2 ms.
VITS by delayed sweep--Typical operation of delayed sweep is illustrated by obtaining expanded wave forms of the VITS and VIR in TV video signals (Figure 17). The first dual-trace waveforms were obtained at a main sweep time of 0.1 ms.
Remember, the scope must be triggered from vertical sync taken from this same video either by the scope's sync separator or externally from the TV-receiver sync separator. (Also, external triggering can be taken [with less stability] from the TV vertical-sweep signal.) The complete procedure is de tailed in Figure 17 and will not be repeated here. Delayed sweep is not mandatory for TV servicing, but it is valuable for work with digital word trains.
Incidentally, the VITS and VIR signals can be displayed on most triggered scopes. Lock the scope to the vertical sync (as explained before) and then select 0.1 ms sweep time, which shows an expanded view of the vertical retrace area that is similar to A in Figure 17. Next, switch on the X5 expander and move the trace to the left until the VITS and VIR are on the screen. Alternate mode of dual-trace operation allows the different waveforms of the two vertical fields to be separated, while single-trace scopes show both waveforms together.
Checking delay lines--Actual delay produced by the delay line in a color-TV receiver can be measured by using either the delayed sweep or the expanded sweep methods previously described.
Figure 18 shows the input (top trace) and the output (bottom trace) of the delay line in a solid-state color receiver. Measure by eye how many divisions or fractions separate the same point of both waveforms, and multiply this figure by the time base. The delay here was about 0.08 to 0.09 us. Some error is inherent since the delay line distorts the waveform slightly, thus causing difficulty in knowing the exact corresponding point of the output waveform.
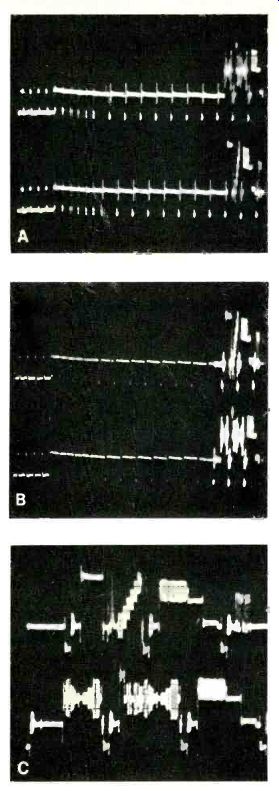
----- Figure 17 The method of displaying VITS and VIR signals by delayed
sweep is shown by this sequence. (A) At a 0.1 mS/div sweep time, the
two vertical intervals (field 1 and field 2) are shown. (B) After the "A
intensified by B" button is pushed (see Figure 16), part of the
waveform is brighter.
(Pulling out on the main time/div knob and rotating t to the right allows the main sweep time to be undisturbed whale the delayed time is adjusted.) The delayed time/div knob setting determines the width of this brighter section, and the "delay-time position" knob adjustment moves the brighter section from side to side.
These two should be adjusted alternately until only the desired area (of the VITS and VIR signals in this case) is brighter. (C) When the "B" display mode button is pushed, the screen shows only the area that previously was brighter, but it is expanded to full screen width.

-------Figure 18 Dual-trace operation at 10 u/S main sweep and 2 uS
delayed sweep showed a 0.08 uS delay produced by one color-TV delay line.
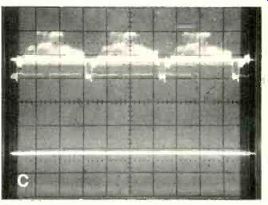
-----Figure 19 Three methods of measuring dc voltage are shown. (A) Notice
how many divisions the waveform moves when the switch is changed from
ac to dc. (B) Voltages without waveforms can be measured in the same
way. Just notice how many divisions the horizontal line moves when
the probe is changed from ground to the point with the voltage. (C)
Dual-trace operation permits a graph-like display of better accuracy,
and it requires little additional time. The waveform is shown in proper
relationship to the line which represents ground (zero volts).
Measuring dc voltages
Modern scopes permit easy tests of dc voltages, both with and without signal ac voltages. Some experienced technicians say they seldom use a dc meter. Instead they use the dc function of their triggered scope.
Three methods of reading dc levels are shown in Figure 19. In the A picture, video is displayed at the bottom when the vertical input switch, Figure 20, is in the ac position. Then when the switch was slid to the dc position, the entire waveform moved up four divisions.
Multiply the movement (4) by the volts/div rating (1 V/div) to obtain the dc voltage (+4 Vdc) that is mixed with the video waveform.
Downward movement would have indicated a negative voltage, as is found at many video detectors.
Of course, a large dc voltage and a small ac voltage might move the dc waveform off the screen. A higher V/div setting must be used then.
Figure 19B illustrates how to measure dc voltages that do not have ac mixed with them. The procedure is similar to the previous one. Select a range that does not move either line off the screen.
Notice how many divisions the line moves when the switch is moved from de to ac (or ac to dc) and multiply this by the vertical switch setting.
One typical test is measuring a power-supply voltage. For this, leave the input switch at the dc position. After the scope is grounded to the circuit, touch the hot scope probe to ground while noticing the line position. Then touch it to the B+ or B- circuit and measure the number of divisions the line moves.
Multiply this by the switch setting.
Always preset the variable vertical sensitivity control to the "calibrate" position and include the effects of the X10 probe (if used). These probes multiply the reading for dc exactly the same as they do for ac waveforms.
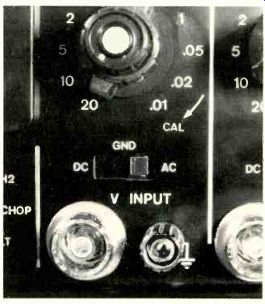
-----Figure 20 All new triggered scopes have some kind of three-position
switch (one B&K-Precision switch is shown) that changes the scope
vertical response to either ac or dc. The third position disconnects
the probe from the scope input and grounds the scope input. This saves
time and is convenient.
For varying dc voltages or for instruction purposes, dual-trace waveforms provide the ultimate in ac/dc measurements. In the C picture, both channel switches were adjusted to the "ground" position of the vertical-input switch. This disconnects the probe from the scope input and grounds the scope input (which is handy and useful for many tests). Then the horizontal lines of both traces were positioned together (in this case, where the line is shown in Figure 19C), and the Channel 1 switch changed from "ground" to "dc" position. The video waveform appeared near the top with its center about 4 divisions above the zero (bottom) line. Of course, the reading is not accurate at this point, because the average point of a waveform is not necessarily at the vertical center.
Digital and transistor waveforms often make sense only after the dc level or the position of the average voltage line is known. Electronic Servicing has been using such wave forms for several years, for they are excellent educational tools that clearly reveal the details of many circuit operations that probably would be misunderstood without them.
These concepts and measurements are so important that they will be discussed in a separate article later.
Comments or questions?
If you have comments or questions about any aspect of scope operation, please write to the editor:
Carl Babcoke, Editor Electronic Servicing P.O. Box 12901
Overland Park, Kansas 66212
Also see: An introduction to microprocessors