By Conrad Persson
The oscilloscope has undergone significant changes since it was introduced as a tool for observing electrical wave forms. From an uncalibrated device useful for little more than getting a rough idea of the shape of a waveform, the analog scope gradually evolved into a tool for studying waveforms with a great degree of mathematical accuracy.
Today's digital storage oscilloscopes (DSOs) not only provide the user with a graphic representation of the wave form on the screen, they also make it possible to store a waveform, compare Persson is editor of ES&T. it with other waveforms, analyze it mathematically. And these oscilloscopes increase in capability and decrease in price every year.
As oscilloscopes have evolved, the consumer electronics equipment that technicians will be servicing has also changed. In addition to all of the sophisticated analog circuitry to be found in today's TVs, VCRs and other consumer products, there's a great deal of sophisticated digital circuitry.
This special report takes a look at to day's oscilloscopes. First, what are the criteria for choosing an oscilloscope? The article "Bandwidth and Rise Time - Two Keys to Selecting the Right Oscilloscope" examines the nature of the signals that a servicer will encounter, and analyzes from this information what capabilities the technician will require in an oscilloscope. The article also discusses the required sampling rate of a DSO as determined by the frequencies of the signals to be observed.
The second article in the report, "Oscilloscopes: From 'Looking Glass' to High-Tech," describes the evolution of the oscilloscope from its humble beginnings to the power of today's DSOs.
This article discusses how today's sophisticated oscilloscopes do much of the work of calculating waveform parameters, such as frequency and peak to-peak, average and rms voltage, allowing the technician to concentrate on the business of deciding what points to measure and how to interpret the data observed.
Today's complex consumer electronics products require sophisticated technicians and advanced test equipment to service them. We hope this article helps readers become more aware of the capabilities they will find in the current crop of scopes.
--------------------------

The computer as a waveform analyzer
Computers are finding more and more applications in consumer electronics products as well as in the test equipment that is used in the servicing of those products. Not only that, but recently we have seen more and more software designed to turn a personal computer into a piece of test equipment.
For example, there are software pack ages that will turn a computer into an oscilloscope. The computer also can be made to emulate the spectrum analyzer.
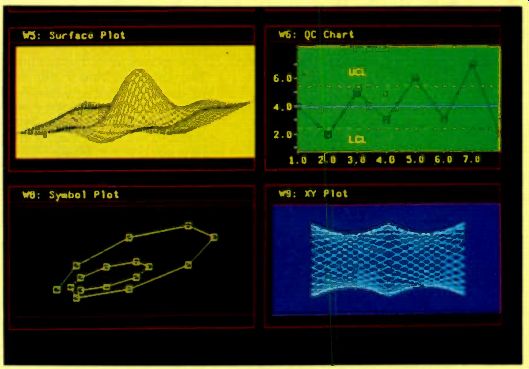
Here's a software product that will turn a PC into a "spreadsheet" for waveforms, signals or graphs. This program, called DADiSP (pronounced day-disp) allows the user to call waveforms into his computer, analyze them, manipulate them, compare one waveform to another, and possibly diagnose problems in the equipment that produced the waveform. The waveforms to be analyzed might be captured, for example, by a data acquisition system or by a modern instrument that can capture a waveform and transfer it to the computer via an IEEE-488 interface.
The program can also accept and display tabular data and text.
The software is an interactive graphics worksheet - a visually oriented soft ware tool for the display, analysis and management of scientific and technical data, requiring no programming. It takes any type of data as described above and plots it in color on-screen. The menu driven software allows you to run hundreds of analysis routines, displaying the results next to the original data in a variety of dynamic graphic views.
This program can simultaneously display up to 64 separate on-screen windows for viewing all types of data, analysis and graphs. These windows can be individually manipulated and linked to one an other, similar to how a spreadsheet al lows you to manipulate and link cells of numerical data. If the data in one window is changed, the software automatically recalculates and updates all windows that are dependent on that data.
Also, any window can be zoomed in on for detailed examination and modification, allowing scrolling, panning and cursor-ing through data point-by-point and window-by-window. A number of graph types can be used, simplifying and speeding data interpretation.
Here's a concrete example of what a technician could do with the software.
Let's say that you suspect an integrating circuit of not working properly. You could capture both the input waveform to the integrator and the output waveform from the integrator and place them in windows. Then you could use the manipulating abilities of the program to produce the integral of the input wave form on screen. Finally, you could compare the actual output from the integrator with the integrated input waveform produced by the software. If they resemble one another within reason, the integrator is probably good. If they're significantly different, you've probably located a problem source.
There are currently two versions of this program. The original, version 1.05, is priced at $895 and will run on any IBM or compatible from the 8086 on up. It re quires 640K of memory and will operate on a monochrome or color monitor.
The upgraded version, 2.0, is priced at $1,695 and requires a 286 or 386 and 2MB of RAM. This version is usually run with an EGA or VGA monitor.
For more information on the program, contact DSP Development Corporation at 1 Kendall Square, Cambridge, MA 02139; 617-577-1133.
----------------------------
Also see:
Bandwidth and rise time--two keys to selecting the right oscilloscope
Oscilloscopes: From "looking glass" to high-tech