Frequency measurements in the range 20 Hz to 20 kHz are some of the easiest to make, and numerous instruments and methods are available for the purpose. But, just because some audio frequency measurements are simpler than those of much higher frequencies, one must not presume that care is not needed. Performance and observation both must be painstaking, as in all reliable electrical measurements.
This Section describes 22 methods of measuring audio frequency. The method selected as best for a particular instance will depend upon suitability, available equipment, and operator experience.
2.1 BEAT-NOTE METHOD
The simplest way to measure an unknown audio frequency is to tune an audio signal generator to zero-beat with it, and then to read the frequency from the generator dial. Either headphones or a meter can serve as the beat indicator. This is known also as the zero-beat method or the search-frequency method.
The two signals are applied simultaneously to the indicator.
The operator must be careful that the generator is tuned to the actual frequency (fx) of the signal under test and not to a harmonic or subharmonic of fx, as each of the latter also will produce beat notes. At the fundamental frequency, the beats are strong, in contrast to those at other frequencies; therefore, tuning the generator to twice the frequency and then to half the frequency and noting the relative strength of the corresponding three beat notes thus will establish the true value of fx.
If the operator is careful in identifying zero beat and in reading the generator dial, frequency measurements by this method can have an accuracy corresponding to that of the generator, which is ±170 to ±570, depending upon whether the instrument is laboratory type, service type, factory-built kit, or home-assembled kit.
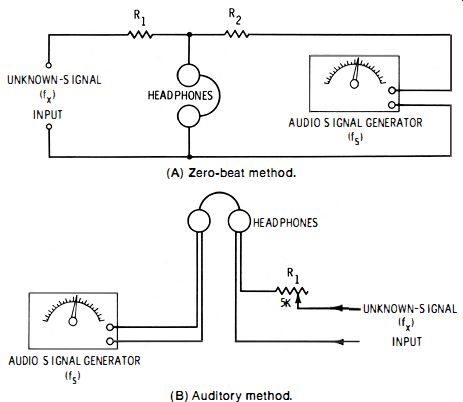
Fig. 2-1. Headphone methods of measuring audio frequency. (A) Zero-beat method.
(B) Auditory method.
Headphone Method
In Fig. 2-1A, the unknown signal (fx) and the known, or standard, signal (fs) are applied simultaneously to a pair of high-resistance headphones through identical isolating resistors R1 and R2. These resistors may have any convenient stock value between 820 and 1800 ohms each. The headphones may be 2000- or 3000-ohm magnetic type or crystal phones.
Beats will be set up between the two signals when the generator is tuned close to the unknown frequency, and will become slower as the generator setting comes closer to the unknown frequency. Finally, at zero beat, fx = fs and it can be read directly from the generator dial. During the process, the generator output control must be set for best results for an individual listener.
Fig. 2-1B shows an alternate auditory method that can be used when connections can be made separately to each headphone. Here, the unknown signal is applied to one phone through volume control R1 (a 5000-ohm wirewound potentiometer) , and the generator signal is applied to the other phone.
Some operators find this method more compatible with their hearing acuity than the first one.
Voltmeter Method
The meter method is silent and has the further advantage of permitting closer recognition of zero beat than is sometimes possible in the auditory method. This arrangement (see Fig. 2-2) employs an electronic ac voltmeter-either a vtvm or tvm.
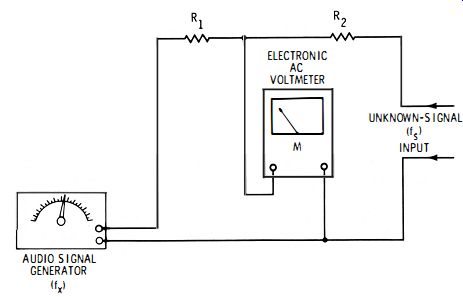
Fig. 2-2. Voltmeter method of measuring audio frequency.
The unknown signal (fx) and generator signal (fs) are applied to the meter through identical isolating resistors R1 and R2 which can have any stock value between 820 and 1800 ohms each.
First, with the unknown frequency removed, the generator output is adjusted for center-scale deflection of the meter.
Then, when the unknown signal is applied and the generator is tuned, beats take the form of pulsations of the pointer above and below center scale. At zero beat-which can be identified very accurately with this method-the pointer comes to rest, and the frequency can be read from the generator dial. If the generator is tuned either above or below this frequency, the pulsations resume.
For best results, the generator-signal voltage should be higher than that of the unknown-signal voltage. A ratio of 10:1 is good, but not mandatory. This will restrict the pulsations to a narrow section of the scale. The output of either the generator or the unknown-signal source may be adjusted for a manageable beat-note swing of the pointer.
Care must be taken to ignore beat notes resulting from power-line interference leaking through the generator, meter, or test-signal source when either or all are power-line operated.
This condition can be detected beforehand by tuning the generator through the power frequency, usually 60 Hz, while watching for beats.
2.2 INDUCTION-TYPE FREQUENCY METER
Fig. 2-3 shows the basic structure of an induction-type frequency meter. This instrument, also known as a movable-iron type frequency meter, gives direct readings in hertz.
In this arrangement, two stationary coils, L1 and L2, are mounted at right angles to each other. The movable element is a long, narrow soft-iron vane (V) with an attached pointer.
The deflection of this vane is proportional to the resultant magnetic field set up by L1 and L2. The resistance-inductance network connected to the coils reduces the phase difference between currents flowing in these coils and thereby prevents the iron vane from rotating instead of deflecting. Rotation of the magnetic field is now no longer uniform, but irregular ; and the vane, because of its inertia, cannot follow this field, so it assumes a position proportional to the frequency of the current.
This type of instrument is usually supplied for power-line frequencies-25, 40, 50, 60, and 125 Hz-however, such meters have been manufactured for frequencies as high as 500 Hz. The normal operating frequency for which the meter is intended appears at center scale, with an equal number of hertz inscribed above and below that frequency (depending upon center frequency, there is usually a 30ra to 85ra frequency variation above and below center scale). Depending upon make and model, frequency accuracy can be as good as 0.5 ra.
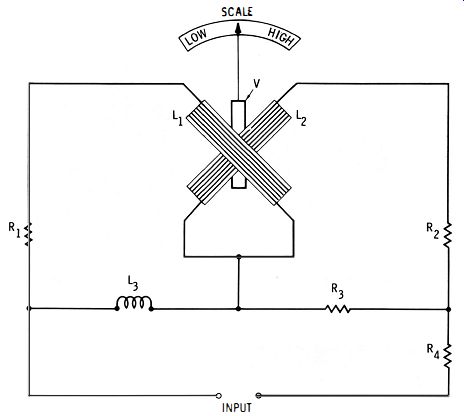
Fig. 2-3. Induction-type frequency meter.
Induction-type frequency meters are supplied for single frequency / single-voltage, single-frequency / double-voltage, or double-frequency / double-voltage operation. Typical accuracy is 0.5 % of indicated frequency. Typical -operating-voltage ranges are 100 to 125 V and 125 to 150 V. A potential transformer must be used at higher voltages, such as 220 to 250 V and 250 to 300 V. The operating power of the instrument must be taken into consideration in many applications of this type of instrument ; a typical value is 2.5 watts for a small 60-Hz meter.
These voltage and power demands restrict the induction-type frequency meter to large-signal applications.
2.3 REED-TYPE FREQUENCY METER
This instrument is also known as the vibrating-reed meter or Frahm-type meter. Its operating principle is illustrated by Fig. 2-4A. In this arrangement, M is a permanent magnet. On the yoke of this magnet is wound a coil (L) consisting of many turns of fine wire. This coil is connected to the source of audio frequency current of unknown frequency.
Reed R (a thin strip of magnetic metal, such as iron or steel ) is fastened at its lower end to one pole of the magnet ; the upper end of this reed stands a short distance from the face of the other pole of the magnet. This springy reed has a natural period of vibration which is determined chiefly by its length and thickness.
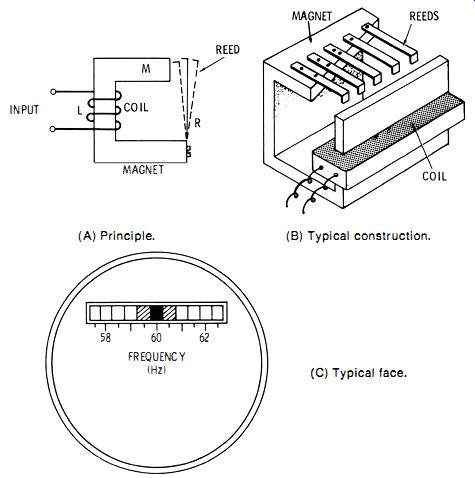
Fig. 2-4. Reed-type frequency meter. (A) Principle. (8) Typical construction.
(C) Typical face.
When an alternating current flows through the coil, the strength of the resulting magnetic field alternates at the ac frequency and sets the reed into vibration. The vibration is most vigorous when the frequency of the current equals the natural vibration frequency of the reed. In fact, the vibration is then so intense that the free end of the reed becomes invisible. When the frequency of the current is a few hertz above or below the reed frequency, the reed vibrates, but not so intensely as it does at its natural frequency because of the relatively low Q of the reed.
In the actual meter, several reeds, cut to various proper lengths, are mounted side by side on one pole-piece of the magnet, as shown in Fig. 2-4B. The top of the pole is slanted so that, although the reeds are of unequal length, their free ends are in line for easy viewing from the front. The tips, bent into small flags, are painted white for good visibility. If the reed lengths differ only slightly, several adjacent reeds (usually three) will vibrate at a given frequency, but the one whose natural vibration corresponds to the frequency is the most active and may readily be identified. Generally, this one will disappear from sight, while immediately adjacent ones will appear blurred.
This action is illustrated in Fig. 2-4C which shows the face of a reed-type meter. Here, the 60-Hz reed has disappeared, while the 59.5-Hz and 60.5-Hz reeds vibrate less vigorously and appear blurred. The manufacturer can tune the reeds very accurately by precisely controlling their length or by appropriately mounting them along the slanted pole piece.
Typical accuracy is 0.39' 0 of indicated frequency. Operating voltages range from 5 V to 660 V rms. Depending upon make and model, the power consumed by the meter ranges from 0.75 W to 2 W. The response of the meter is reasonably free from the effects of voltage change, temperature change, and waveform.
A 57.5-60-62.5-Hz scale is shown in Fig. 2-4C. Other common scales extend from 40-45-50 Hz to 380-400-420 Hz. The total number of reeds ranges from 5 to 21. Some meters have more than one frequency scale.
2.4 ANALOG-TYPE ELECTRONIC FREQUENCY METER
An analog-type electronic frequency meter unlike the instruments described in Sections 2.2 and 2.3, provides high input impedance (therefore, virtually no drain is imposed upon the signal source ) and wide range (typically, 0 to 100 kHz in four bands: 0 to 100 Hz, 0 to 1 kHz, 0 to 10 kHz, and 0 to 100 kHz). This instrument is available in tube or transistor version.
Fig. 2-5 shows a circuit employing two field-effect transistors (FET). The frequency is indicated on the scale specially drawn for the 0- to 50-dc microammeter (M). The frequency is independent of signal amplitude from 1.7-V rms upward and is in de- pendent of waveform over a wide range. The response is linear ; hence, only one point need be calibrated in each frequency band.
The arrangement consists essentially of two overdriven amplifiers. The output of the last stage (Q2) accordingly is a square wave which is applied to an RC circuit (R5 through R9 and G! through C7 ) and rectifier diodes D1 and D2. Since the square wave is of constant amplitude, the deflection of the meter (M) depends only on the number of current pulses per second, and therefore is directly proportional to the signal frequency.
The instrument must be initially calibrated at one point in each frequency band, and this need be done only once (the best point is the top frequency-full-scale deflection of the meter (M) in each band ). Rheostats R6, R7, Rs, and R9 are the CALIBRATION controls and are usually provided with slotted shafts for screwdriver adjustment. They are mounted inside the instrument case, for protection against tampering.
Calibration Procedure:
1. Close switch S1.
2. Set RANGE switch S2-S3 to position A.
3. Connect an accurate audio signal generator to the SIGNAL INPUT terminals.
4. Set the signal frequency to 100 Hz and adjust RG for full-scale deflection of meter, M.
5. Set S2-S3 to position B.
6. Set the signal frequency to 1 kHz and adjust R7 for full scale deflection of the meter.
7. Set S2-S3 to position C.
8. Set the signal frequency to 10 kHz and adjust R5 for full-scale deflection of the meter.
9. Set S2-S3 to position D.
10. Set the signal frequency to 100 kHz and adjust R9 for full-scale deflection of the meter.
If the instrument is carefully calibrated according to foregoing procedure, its accuracy at the calibration-frequency points should equal that of the generator. If the dc response of the microammeter is linear, other frequencies in each band should fall on the corresponding scale division. Individual points along the meter scale can, of course, be checked with a variable-frequency generator.
A wide-range factory-built instrument--Hewlett-Packard 5210A-provides coverage from 3 Hz to 10 MHz in 6 ranges: o to 100 Hz, 0 to 1 kHz, 0 to 10 kHz, 0 to 100 kHz, 0 to 1 MHz, and 0 to 10 MHz. Its accuracy is 1 ro of the reading from 10% of full scale up.
At this writing, the analog-type instrument has been superseded almost entirely by the digital type (see Section 2.5). However, it survives in the model just discussed and as a frequency indicator in some signal generators. The kit-type meter has disappeared, but the homemade version (Fig. 2-5 ) is to be recommended to private builders who need a reliable, easily calibrated audio-frequency meter which can be assembled quickly at a fraction of the cost of a digital instrument.
2.5 DIGITAL-TYPE ELECTRONIC FREQUENCY METER
Like the analog-type instrument described in Section 2.4, the digital-type frequency meter is electronic and provides high input impedance and wide range. Going a step further, however, the digital instrument dispenses with the indicating meter and displays the frequency as a set of digits presented by electronic readout devices. Thus, the digital instrument is fully electronic.
The digital-type instrument consists essentially of an electronic counter circuit, which is automatically gated to total the number of cycles of pulses of an applied signal that arrive in 1 second, and which operates a 5- or 8-digit display (more digits in some models) to show this count. The 1-second sampling-time gate is controlled by an accurate timing signal ("clock" ) that is internally generated, usually by a temperature-controlled crystal oscillator. Some models also provide selectable gating intervals from 0.1 us to 10 s.
There are numerous variations of this scheme. Fig. 2-6 shows the block diagram of one version. In this arrangement, the signal of unknown frequency is presented to a signal-processor (A) which provides amplification and high input impedance and shapes the signal properly (converts it into a square wave ) for triggering the counter (D). The time-base generator (C) delivers a square wave of correct amplitude, period, and polarity to hold the gate (B) open for the desired interval, say 1 second. Pulses passing through the gate actuate the counter which indicates on the display (E) the total number of pulses that passed through the gate during the time interval. A pulse from the time-base generator then actuates the reset circuit (F) which, in turn, generates a pulse that resets the counter to zero. The entire sequence then is repeated. The display indicates the frequency and, in addition, automatically places the decimal point.
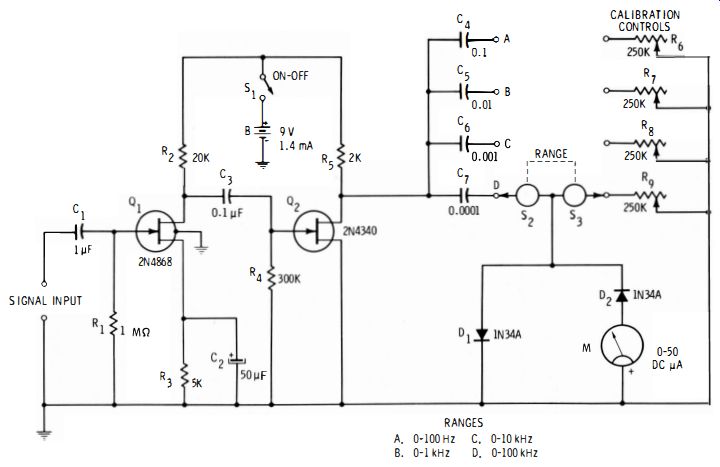
Fig. 2-5

Fig. 2-6. Digital-type electronic frequency meter.
Commercially available digital instruments have a wide operating range (e.g., 0 to 50 MHz) ; they are useful, therefore, far beyond the audio frequencies. Typical accuracy is ± 1 digit ± the time-base stability. Depending upon make and model, sensitivity at audio frequencies is 5 m V to 100 m V rms sine wave, and input impedance is 1 megohm (shunted by 15 pF to 35 pF). These instruments are available in factory-built and kit versions.
2.6 OSCILLOSCOPE METHODS
The cathode-ray oscilloscope is useful in a number of ways in the measurement of audio frequencies. The principal ways are described below. In each of these, the oscilloscope serves as a reliable indicator of the relationship between an unknown frequency and a standard frequency. In all except Method A, the standard frequency is supplied by a separate device. When the measurements are carefully made, the accuracy of these methods can equal that of the standard-frequency source.
A. Oscilloscope Having Calibrated Time Base
Many modern oscilloscopes have a calibrated horizontal sweep which allows time intervals to be read along the horizontal axis of the screen. The front-panel sweep-rate control accordingly is graduated in time units per scale division. In a laboratory-type instrument (e.g., Hewlett-Packard Model 1722A), the rates typically are 10 ns/div to 50 ns/div, 100 ns/div to 20 ms/div, and 50 ms/div to 0.5 s/div, and these are provided with Xl and X10 multipliers. (In the cited instrument, the 10-ns and 50-ms ranges have an accuracy of ±3%, and the 100-ns range has an accuracy of ±2ifo.) To check the frequency of an unknown signal applied to the VERTICAL INPUT terminals of the oscilloscope, adjust the sweep rate to give one stationary cycle on the screen. Then, measure the width of this cycle in scale divisions and determine the corresponding time interval from the settings of the sweep control and multiplier. This gives the period (t) of the signal (See Section 1.5, Section 1, for a discussion of period ). Finally, calculate the frequency : fx = l/t, where fx is in hertz and t is in seconds. For frequencies other than hertz and for periods other than seconds, use the appropriate formulas given in Appendix C. Illustrative example: The width of a single cycle on the oscilloscope screen is found to be 3.5 divisions. The sweep control is set at 5 ms/ div, and the multiplier is set to X 1.
Here, the period t = 3.5 X 5 = 17.5 ms = 0.0175 s; therefore, f = 1/0.0175 = 57.1 Hz.
Calibrated time bases are not restricted to expensive, laboratory-type instruments. A kit-type oscilloscope can also offer this convenience. The Heathkit 10-105 instrument, for example, has 18 calibrated rates from 0.2 us/cm to 100 ms/cm at ±3% accuracy, in a 1, 2, 5 sequence.
B. Use of Lissajous Figures
These distinctive patterns (named for their discoverer, Jules A. Lissajous, 1822-1880) permit use of the oscilloscope to check unknown frequency against a standard frequency even if one is a harmonic of the other. The patterns shown here are obtained with two sine-wave signals. Somewhat similar, though distorted, patterns result when one or both signals are nonsinusoidal.

Fig. 2-7. Test setup for Lissajous figures.
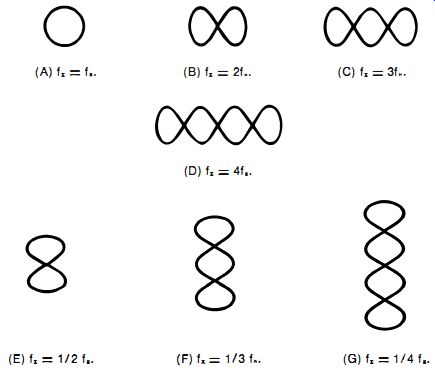
Fig. 2-8. Typical Lissajous figures.
Fig. 2-7 shows the test setup for Lissajous figures. The standard-signal source usually is a well-calibrated variable-frequency audio generator which is used to search out the unknown frequency. The internal sweep of the oscilloscope is switched off. With this arrangement, a stationary pattern appears on the screen when the unknown frequency (fx) is equal to the standard frequency (fs) or is an exact multiple (n) or sub-multiple (lin) of fs• When fx is not equal to fs, nfs, or llnfs, the pattern will spin about its axis-in one direction when fx is lower, in the opposite direction when fx is higher.
Fig. 2-8 shows patterns for several common frequency ratios when the phase angle between the two signals is 90°. When the unknown frequency equals the standard frequency, a stationary circle results (Fig. 2-8A) ; when the unknown frequency is twice the standard frequency, the stationary pattern has two horizontal loops (Fig. 2-8B) ; and so on. In each instance, the number of loops is counted to give the value of the multiplier n by which standard frequency fs must be multiplied (the circle in Fig. 2-8A is one loop, so here fx = 1fs = fs )' When the unknown frequency is a sub-multiple of the known frequency, the loops in the stationary pattern are stacked vertically, as in Fig. 2-8E to 2-8G. Here, the number of loops is counted to give the denominator n of the fraction l/n by which the standard frequency, fs, must be multiplied, Thus, three loops (Fig. 2-8F) give the fraction 1/3, and fx = 1/3 fs. Only a few of the possible patterns are shown in Fig. 2-8.
From this description, however, it should be clear that the procedure can be extended to include the highest frequency ratio whose corresponding number of loops can be accurately counted on a particular screen. The limit is dictated ultimately by the screen size, resolution and stability of the oscilloscope and by the keenness of the operator's eyesight. When the ratio is so high that it makes an accurate count doubtful, one of the following methods described in Parts C, D, or E may be preferred.
C. Use of Gear-Wheel Pattern
This method (see test setup in Fig. 2-9A) traces a single stationary circle (representing standard frequency fs ) with a circumference that is wrinkled by sine-wave cycles which indicate the number of times fs must be multiplied to give the unknown frequency, fx. The signal from GEN 2 modulates that from GEN 1, thereby producing the characteristic "gear-wheel" pattern.
Fig. 2-9B shows a typical pattern-in this case having 15 cycles or "teeth" to show that fx = 15fs. The wheel is stationary when fx is an exact multiple (n) of fs, but spins when fx is lower or higher than fs. The underlying circular trace is produced by a resistance capacitance phase-shift network, Re, operated from the standard-frequency generator, GEN 1. With the 0.1uF capacitor and the 10,000-ohm wirewound rheostat shown in Fig. 2-9A, the network may be adjusted (together with the vertical and horizontal gain controls of the oscilloscope ) for an acceptable circle, at any frequency between 20 Hz and 20 kHz. When the trace is an ellipse, the cycles at the small ends of the pattern are distorted and crowded; nevertheless, they can be counted unless they are too compressed horizontally to be separated.
The unknown-signal source, GEN 2, should have low or medium output impedance and should provide an internal conductive path between its output terminals. If such a path is not present, as when the generator has capacitance-coupled output, a transformer must be connected between GEN 2 and the oscilloscope.
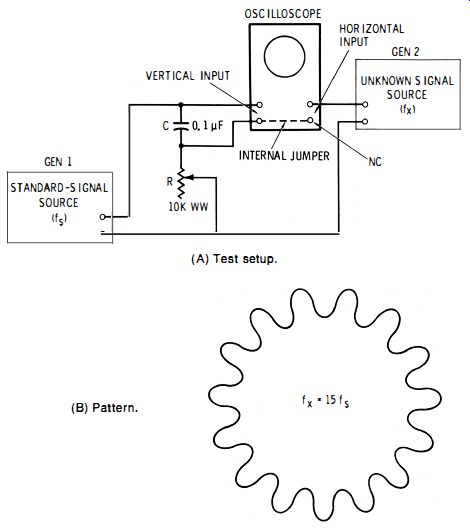
Fig. 2-9. Arrangement for gear-wheel pattern. (A) Test setup. (8) Pattern.
The transformer characteristics are unimportant, so long as a sufficient voltage is supplied to the horizontal channel of the oscilloscope.
Procedure:
1. Set up the equipment as shown in Fig. 2-9A.
2. With the oscilloscope and GEN 1 switched ON and with GEN 2 OFF, set the oscilloscope SWEEP and SYNC to EXTERNAL.
3. Adjust rheostat R and the VERTICAL and HORIZONTAL GAIN controls of the oscilloscope for a good circle pattern.
4. Switch-on GEN 2, noting that "teeth" appear on the circumference of the circle.
5. Adjust unknown frequency fx of GEN 2 until the wheel stands still, and adjust the output of GEN 2 for teeth small enough that they do not distort the circle.
6. Count the teeth and multiply standard frequency fs by that number to obtain the value of known frequency fx.
This method is extremely useful when GEN 1 is a single-frequency device and GEN 2 is a variable-frequency one. Under these conditions, the variable-frequency unit may be tuned to, and calibrated at, a large number of points limited only by the operator's ability to find and count the teeth. Thus, a variable-frequency audio generator can be calibrated at numerous harmonics of the 60-Hz power-line frequency. The unknown frequency may be determined with the same accuracy as that of the standard generator. An obvious disadvantage of the circuit is the floating oscilloscope. In most setups, however, this seems to introduce no hum-interference problems ; but, at high frequencies, the lead length, lead dress, and equipment placement will be important.
D. Use of Segmented Circle
This method (see test setup in Fig. 2-10A) traces a single stationary circle (representing standard frequency fs ) whose circumference is broken up into a number of segments indicating the number of times fs must be multiplied to give the unknown frequency, fx. The signal from GEN 2, the unknown signal source, is applied to the z-axis (intensity-modulation ) input of the oscilloscope, and it modulates the circular trace to give the characteristic segmented-circle pattern. Fig. 2-10B shows the resulting pattern with two segments, indicating that fx = 2fs ; Fig. 2-10C shows the pattern with 10 segments, indicating that fx = 10fs'
The circle is stationary when fx is an exact multiple (n) of fs, but spins when fx is higher or lower than nfs.
As in the gear-wheel method described under Part C, the underlying circle trace is produced here by a resistance-capacitance phase-shift network (RC) operated from the standard frequency generator, GEN 1. With the 0.1-uF capacitor and the 10,000-ohm wirewound rheostat shown in Fig. 2-10A, the network may be adjusted (together with the HORIZONTAL and VERTICAL GAIN controls of the oscilloscope) for an acceptable circular trace at any frequency between 20 Hz and 20 kHz.
When the trace is an ellipse, the segments at the small ends of the ellipse are shorter than the others ; nevertheless, they can be recognized and easily counted if they are not severely crowded.
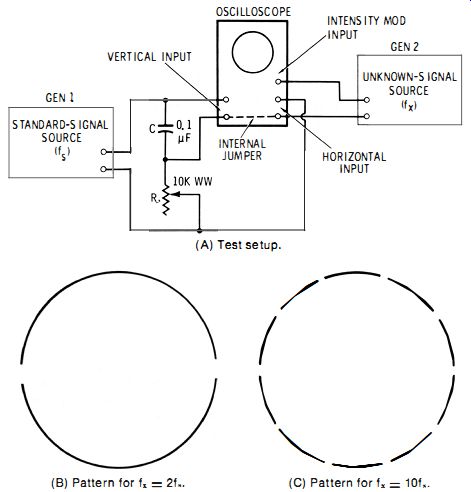
Fig. 2-10. Arrangement for segmented-circle pattern. (A) Test setup. (B) Pattern
for flO = 2f (C) Pattern for f" = 10f
Procedure :
1. Set up the equipment as shown in Fig. 2-10A.
2. With the oscilloscope and GEN 1 switched ON and GEN 2 OFF, set the oscilloscope SWEEP and SYNC to EXTERNAL.
3. Adjust rheostat R and the VERTICAL and HORIZONTAL GAIN controls of the oscilloscope for a circle pattern.
4. Switch-on GEN 2, noting that the circumference of the circle breaks up into segments.
5. Adjust the frequency of GEN 1 or GEN 2, whichever is variable, until the circle stands still, and adjust the INTENSITY control of the oscilloscope for the best visibility of the segments.
6. Count the segments and multiply standard frequency fs by this number to find the value of unknown frequency fx. Like the gear wheel, the segmented circle is extremely useful when GEN 1 is a single-frequency device and GEN 2 a variable frequency one. Under these conditions, the variable-frequency unit may be tuned to, and calibrated at, a large number of points limited only by the resolution of the oscilloscope and the operator's ability to separate and count the segments. Thus, a variable-frequency audio oscillator can be calibrated at numerous harmonics of the 60-Hz power-line frequency. The unknown frequency may be determined with the same accuracy as that of the standard generator.
E. Use of Broken Line
This method (see test setup in Fig. 2-11A) traces a single horizontal line (representing standard frequency fs ) which is broken up into a number of segments indicating the number of times fs must be multiplied to give the unknown frequency, fx.
The signal from the unknown-signal source, GEN 1, is applied to the Z-axis (intensity-modulation) input of the oscilloscope and modulates the horizontal-line trace, thereby producing the characteristic broken-line pattern. Fig. 2-1 1B shows the resulting pattern with two segments when fx = 2fs ; Fig. 2-11C shows the pattern with five segments when fx = 5fs. The end segments often appear as dots. The pattern is stationary when fx is an exact multiple (n) of fs, but the segments crawl horizontally when fx is lower or higher than nfs.
The underlying horizontal-line trace is produced by the standard-signal source, GEN 2, which is connected to the HORIZONTAL input of the oscilloscope. The VERTICAL input is not used, and the internal SWEEP and SYNC are switched OFF. The sine-wave output of GEN 2 thus sweeps the spot back and forth to generate the horizontal line whose width is adjustable with the HORIZONTAL GAIN control.
Procedure:
1. Set up the equipment as shown in Fig. 2-11A.
2. With the oscilloscope and GEN 2 switched ON and with GEN 1 OFF, set the oscilloscope SWEEP and SYNC to EXTERNAL, and set the VERTICAL GAIN control to zero.
3. Note that the standard signal produces a horizontal-line trace. Adjust the HORIZONTAL GAIN control to spread the line over a good portion of the screen (for example, 4 inches on a 5-inch screen ).
4. Switch-on GEN 1, noting that the line breaks up into segments.
5. Adjust unknown frequency fx of GEN 1 until the segments stand still, and adjust the INTENSITY control of the oscilloscope for the best visibility of the segments.
6. Count the segments and multiply standard frequency fs by that number to find the value of unknown frequency fx.
Fig. 2-1 1. Arrangement for broken-line pattern.
(A) Test setup. (B) Pattern for fx = 2fs. (C) Pattern for fx = 5f •.
Like the gear wheel and the segmented circle described earlier, the broken line is extremely useful when GEN 2 is a single-frequency device and GEN 1 a variable-frequency one. Under these conditions, the variable-frequency unit may be tuned to, and calibrated at, a large number of points limited only by the resolution of the oscilloscope and the operator's ability to separate and count the segments. Thus, a variable-frequency audio oscillator can be calibrated at numerous harmonics of the 60-Hz power-line frequency. The unknown frequency may be deter- mined with the same accuracy as that of the standard generator.

Fig. 2-12. Arrangement for individually calibrated screen.
(A) Test setup.
(B) Set pattern.
(C) Measure pattern.
F. Use of Individually Calibrated Screen
In this method (see test setup in Fig. 2-12A) , the oscilloscope screen is first frequency-calibrated by obtaining as a pattern a single stationary cycle of an accurately known standard frequency (fs) spread over a chosen screen width. Then, fs is removed, the unknown frequency (fx) is substituted, and the number (n) of cycles that occupy the same screen width are counted. Unknown frequency fx then is determined by multiplying fs by n. For illustration, Fig. 2-12B shows the single standard-frequency cycle spread horizontally between points A and B on the screen, and Fig. 2-12C shows the substituted unknown frequency, fx, which gives five cycles in the same width AB. Here, fx = 5fs. The internal SWEEP and SYNC of the oscilloscope must be very stable.
In Fig. 2-12A, when switch S is at its position 1, the standard-signal source ( GEN 1) is connected to the VERTICAL INPUT terminals of the oscilloscope ; when S is at position 2, GEN 1 is disconnected and the unknown-signal source (GEN 2) is connected to the VERTICAL INPUT terminals.
Procedure:
1. Set up the equipment as shown in Fig. 2-12A.
2. Throw switch S to position 1.
3. With the oscilloscope SYNC and SWEEP set to INTERNAL, adjust the SWEEP and SYNC for a single stationary cycle of standard frequency fs.
4. Set the HORIZONTAL GAIN control of the oscilloscope to spread the cycle over the desired number of horizontal divisions on the screen, and set the VERTICAL GAIN control for the desired height of the pattern.
5. Without disturbing any controls of the oscilloscope, throw switch S to position 2, noting the increased number (n) of stationary cycles now appearing in the same screen width as that previously occupied by the single calibration cycle.
6. Count the number of cycles and calculate unknown frequency fx by multiplying the standard frequency by that number. Thus, fx = nfs. With a stable oscilloscope, this method will afford an accuracy equal to that of the standard-signal source, and may be used to measure frequencies equal to or much higher than the standard frequency. The highest frequency that can be measured depends upon the reliability with which narrow cycles of the unknown frequency can be distinguished on the screen and counted. With a 5-inch oscilloscope, it is advisable to use only 4 inches of the screen and to keep the cycles no narrower than 7i6 inch each. This allows 64 cycles (corresponding to a multiplier n = 64 ) in the 4-inch space. With a 60-Hz standard frequency, the highest measurable frequency then would be 3840 Hz ; with fs = 1000 Hz, fx maximum would be 64 kHz ; and so on.
G. Use of Dual-Trace Oscilloscope
This method is similar to Method F but requires no manual switch. A dual-trace or dual-beam oscilloscope is used with the same internal linear sweep applied simultaneously to both channels. One channel displays one cycle of the standard frequency, and the other channel displays cycles of the unknown frequency in the same screen width, the two displays appearing simultaneously. Fig. 2-13A shows the test setup, and Fig. 2-13B the type of display that is obtained.
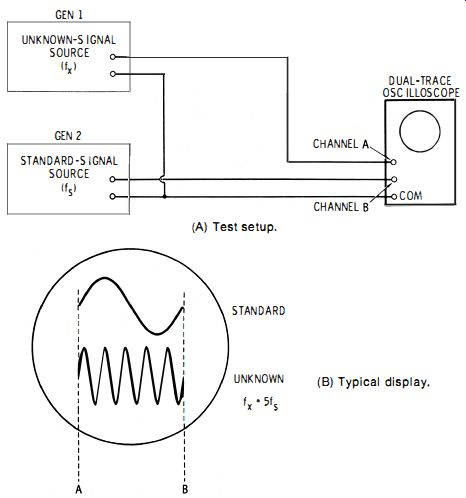
Fig. 2-13. Arrangement for dual-trace oscilloscope. (A) Test setup. (B ) Typical
display.
The SWEEP and SYNC controls of the oscilloscope are adjusted for a single stationary cycle of the standard frequency (fs) , and the HORIZONTAL GAIN control is adjusted to spread this cycle over a desired screen width (A to B to Fig. 2-13B). Cycles of the unknown frequency (fs) appear simultaneously below the standard-frequency cycle. The number (n) of cycles in the unknown-frequency pattern is counted, and the unknown frequency, fx, then is determined by multiplying standard frequency fs by that number. For illustration, Fig. 2-13B shows the single standard-frequency cycle spread between points A and B on the screen, and above this cycle, five cycles of the unknown frequency appear simultaneously between A and B. Here, fx = 5fs. With a stable oscilloscope, this method-like the preceding one-will afford an accuracy equal to that of the standard-signal source and may be used to measure frequencies equal to or much higher than the standard frequency. Since it requires no manual switching between the two signal sources, this method is reasonably fast. The highest frequency that can be measured depends upon the reliability with which narrow cycles of the unknown signal can be separated on the screen and counted. With a 5-inch oscilloscope, it is advisable to use only four inches of the screen and to keep the fx cycles no narrower than Ji G inch each. This allows 64 cycles in the 4-inch space. With a 60-Hz standard frequency, the highest measurable frequency then would be 3840 Hz ; with fs = 1000 Hz, fx maximum would be 64 kHz ; and so on.
2.7 TUNABLE INSTRUMENTS
Several continuously variable instruments may be tuned to any frequency in the audio spectrum in much the same way that a receiver is tuned to radio frequencies, and the audio frequency is read directly from the tuning dial. These devices include the wave analyzer, tuned null detector, tuned sound and vibration analyzer, and distortion meter. Essentially, all are sharp-tuning electronic ac voltmeters. While each of these instruments is intended primarily for other applications, they are useful also for audio-frequency measurement.
A. Wave analyzer
There are two types : heterodyne and RC-tuned. The heterodyne type employs a circuit somewhat similar to a superheterodyne radio receiver, the unknown audio frequency being converted to a 50- or 100-kHz intermediate frequency by a local rf oscillator and balanced modulator and read from the oscillator dial. The i-f amplifier is sharply tuned by a crystal filter or special feedback loops. In the RC-tuned type, an amplifier is tuned by means of variable resistance-capacitance networks, the frequency being read from the dial of the variable resistor (s) or capacitor (s). Each type of wave analyzer terminates in an electronic ac voltmeter/millivoltmeter which gives peak deflection when the instrument is tuned to the frequency of the incoming af signal.
The usual tuning range of the wave analyzer is 20 Hz to 20 kHz in several bands, although some of these instruments operate as high as 22 MHz in the rf spectrum. Depending upon make and model, the frequency accuracy varies from ±0.5 % to ±1 %, the input impedance from 100,000 ohms to 1 megohm, and the input-signal voltage range from 0.1uV to 300 V.
B. Tuned null detector
This instrument is similar to the RC-tuned wave analyzer but has a somewhat less-complicated circuit. It is intended primarily as a frequency-selective null detector for ac bridges, and, like the wave analyzer, it is tuned for peak deflection of its indicating meter.
The tuning range of this instrument is 20 Hz to 20 kHz in several bands. The typical frequency accuracy is ±3 0/0 , the input impedance 50,000 ohms to 1 megohm, and the input-signal voltage range 0.1 u V to 200 V.
C. Tuned sound and vibration analyzer
This instrument, like the tuned null detector described in Part B, is also similar to the RC-tuned wave analyzer but has a somewhat simpler circuit. And, like the other two instruments, it is also tuned for a peak deflection of its indicating meter.
Typical ratings are : tuning range 2.5 Hz to 25 kHz, frequency accuracy ±2 0/ 0, input impedance 25 megohms, and input-signal voltage range 0.3 mV to 30 V.
D. Distortion analyzer Also called a harmonic distortion meter, this instrument--like the two immediately preceding ones--is a frequency selective RC-tuned amplifier with a terminating electronic ac voltmeter/millivoltmeter. But, unlike all of the preceding instruments, it is tuned for dip, instead of peak deflection, of the meter.
Depending upon make and model of the distortion meter, the typical tuning range is 10 Hz to 1 MHz ; the frequency accuracy ±3 0/0 to ±120/ 0, depending upon the frequency range ; the input impedance 1 megohm ; and the input-signal voltage range 0.3 V to 300 V.
2.8 FREQUENCY-SELECTIVE RC CIRCUITS
Resistance-capacitance circuits are passive and relatively simple. Of importance is the fact that some of them can be made frequency sensitive, to give null response at a particular audio frequency which can be determined from the resistance and capacitance values at null. If a variable RC circuit has previously been frequency-calibrated, it makes a simple frequency measuring device. There are many such circuits, also called notch filters; the principal ones are the Wien bridge, twin-T network, and Hall network. (The familiar bridged-T circuit has been passed over here because it gives a shallow null.) Use of these circuits is usually restricted to frequencies no higher than 20 kHz, since small stray reactances blunt the null response and may even bypass the signal around the circuit at higher frequencies.
These devices will usually be pre-calibrated so that an unknown frequency may be read directly from a dial when the device is balanced to null. In the absence of such a calibration, however, the frequency can be calculated (with the aid of Equations 2-1 , 2-2, or 2-3, whichever applies ) from the values of resistance and capacitance at null. The accuracy of this calculation is governed, of course, by the accuracy with which the R and C values can be determined.
The accuracy of any frequency-calibrated RC circuit used as a frequency meter depends upon :
1. Accuracy of the initial calibration.
2. Sharpness of the null (harmonics in the test signal broaden the null) .
3. Closeness to which the dial can be reset.
4. Readability of the dial.
5. Sensitivity of the null detector.
6. Closeness with which the range-switching capacitors are matched.
7. Wearing and aging of the variable resistors.
At best, the accuracy is equal to that of the original calibration source ; at worst, an error of 100/0 to 20 % of the indicated frequency can be expected.
A. Wien bridge See Fig. 2-14A. In this circuit, there are two resistance arms (R1 and R2) and two impedance arms (C1R3 and C2R4). The tuning component is the dual 10,000-ohm wirewound rheostat, R3-R4. (The resistance of these two sections must track closely. ) Capacitances C1 and C2 are equal. The null detector may be headphones, ac electronic voltmeter, oscilloscope, or similar device.
The null equation of the circuit is simplified when (as in Fig. 2-14A) R2 is made twice Rh C1 = C2, and R3 = R4 at all settings. At null : where, fx is the unknown frequency in hertz, R3 is in ohms, C1 is in farads.
(Eq 2-1)
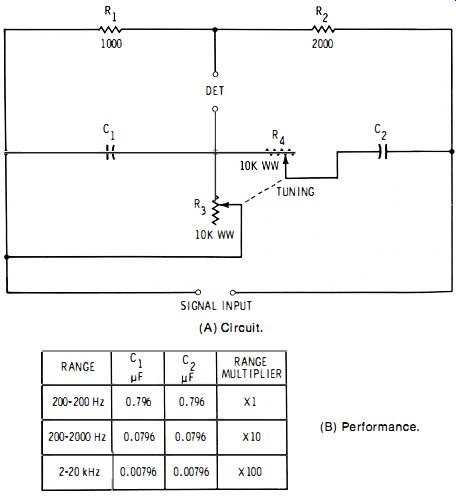
Fig. 2-14. Wien bridge. (A) Circuit. (B) Performance.
With the aid of an accurately calibrated audio generator, a dial attached to the dual rheostat may be calibrated to read directly in hertz. In the process, frequencies are chosen for as many dial points as practicable. At each frequency, the dual rheostat is set for null, and that frequency is inscribed on the dial. When the device is subsequently used as a frequency meter, it is necessary only to apply the unknown-frequency signal, adjust the dual rheostat for null, and read the frequency from the dial. In one rotation, the dual rheostat will cover a 10 :1 frequency span. To change range, new values of C1 and C2 must be switched simultaneously in pairs into the circuit in place of the original capacitances. Fig. 2-14B shows the values that C1 and C2 must have for ranges of 20 to 200 Hz, 200 to 2000 Hz, and 2 to 20 kHz. If the six capacitors have the exact specified values, the dial will need calibration on only the lowest range, its readings being multiplied by 1, 10. or 100 (Fig-. 2-14B). When the signal source and the null detector both are power-line operated, hum interference may demand the use of an isolating transformer at either the input or the output of the bridge, to prevent the null point from being obscured. An input transformer should have an internal shield.
B. Twin-T network See Fig. 2-15A. This circuit, also known as the parallel-T network, takes its name from the fact that it consists of two T's (R1R2 C3 and C1C2R3) connected in parallel. It gives a complete null, and its passband is reasonably narrow if high-Q capacitors are used and if the network is driven from a low-impedance signal source and loaded with a high-impedance detector.
The behavior of the twin-T network is similar to that of the Wien bridge described in Part A, but its selectivity is significantly better and, unlike the Wien bridge, the twin-T permits a common ground between generator, network, and detector.
The tuning component is the 3-gang wirewound rheostat, R1 -R2-R3 (the resistance of these sections must track closely). The null detector may be crystal headphones, ac electronic voltmeter, oscilloscope, or similar high-impedance device.
The null equation of the circuit is simplified by making C1 = C2 = 0.5 C3, and R1 = R2 = 2R3. Under these conditions, at null : where, fx is the unknown frequency in hertz, R1 is in ohms, C1 is in farads.
(Eq 2-2 )
With an accurately calibrated audio generator, the dial attached to the 3-gang rheostat may be calibrated to read directly in hertz. Frequencies are chosen for as many dial points as practicable. At each frequency, the rheostat is set for null, and that frequency is inscribed on the dial. When the device is subsequently used as a frequency meter, it is necessary only to apply the unknown-frequency signal, adjust the rheostat for null, and read the frequency from the dial.
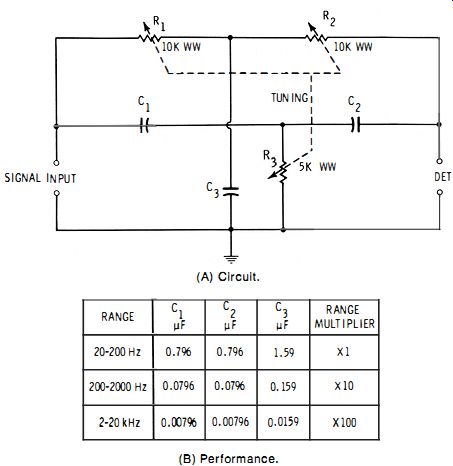
Fig. 2-15. Twin-T network.
(A) Circuit.
(B) Performance.
In one rotation, the 3-gang rheostat will cover a 10 :1 frequency span. To change range, new values of Ch C2, and C3 must be switched simultaneously into the circuit in place of the original three capacitances. Fig. 2-15B shows the values that Ch C2, and Ca must have for ranges of 20 to 200 Hz, 200 to 2000 Hz, and 2 to 20 kHz. If the nine capacitors have the exact specified values, the dial will need calibration on only the lowest range, its readings being multiplied by 1, 10, or 100, as shown in Fig. 2-15B.
Although the twin-T network is superior to some other RC null circuits used as audio-frequency meters, its need for three closely tracked rheostat sections and for accurate capacitors that must be switched in threes, causes it to be avoided in many instances.
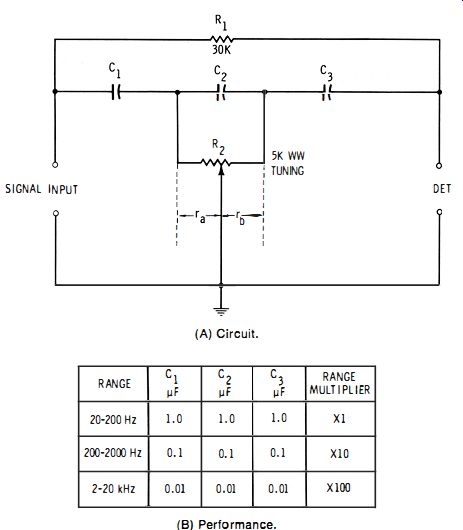
Fig. 2-16. Hall network. (A) Circuit. (B) Performance.
c. Hall network See Fig. 2-16A. This circuit, also known as the bridged differentiator, needs only one potentiometer (R2) for tuning, but this simplicity is offset by the requirement that the capacitors (C1, C2, C3 ) be switched simultaneously in threes to change frequency range. Like the twin-T network described in Part C, the Hall network provides a common ground between generator, network, and detector.
The relationship C1 = C!! = C3 must be maintained in all frequency ranges. At null : where, fx is the unknown frequency in hertz, C1 is in farads, r u and rb are in ohms.
(Eq 2-3 )
On all bands, the bridging resistance has the same value : R1 = 6 (ru + rb) = 30,000 ohms.
With the aid of an accurately calibrated audio generator, a dial attached to the potentiometer may be calibrated to read directly in hertz. In the process, frequencies are chosen for as many dial points as practicable. At each frequency, potentiometer R!! is set for null, and that frequency is inscribed on the dial. When the device is subsequently used as an audio-frequency meter, it is necessary only to apply the unknown frequency, adjust the potentiometer for null, and read the frequency from the dial.
In one rotation, potentiometer R2 will cover a 10: 1 frequency span. To change range, new values of C1/C2, and C3 must be switched simultaneously into the circuit in place of the original three capacitors. Fig. 2-16B shows the values that the capacitors must have for ranges of 20 to 200 Hz, 200 to 2000 Hz, and 2 to 20 kHz. If the nine capacitors have the exact specified values, the dial will need calibration on only the lowest range, its readings being multiplied by 1, 10, or 100, as shown in Fig. 2-16B.
2.9 RESONANT LC CIRCUIT
When an accurate inductor (inductance L) and one or more accurate capacitor decades (total capacitance C) are available, they may be connected as a parallel-resonant test circuit, as shown in Fig. 2-17, for identifying audio frequencies. When a signal of unknown frequency is applied to this circuit through the isolating resistor (R), the circuit may be tuned by varying the capacitance furnished by the decade (s ). At resonance, indicated by peak deflection of the meter, the unknown frequency may be calculated from the known inductance (L) and the total capacitance setting (C) of the decade (s). Thus :
fx = 1/ (6.28v'LC) where, fx is the unknown frequency in hertz, L is in henrys, C is in farads.
(Eq 2-4 )
Capacitor decades of suitable range must be employed to give a small-step variation of capacitance for close tuning. (A single laboratory-type capacitor decade can provide a total capacitance of 1.11111 uF in 1-pF steps.) When an inductor decade also is available, the flexibility of the method is increased. The tuning is sharp when the inductor and capacitors are high-Q components.
Procedure:
1. Set up the circuit, as shown in Fig. 2-17.
2. Adjust the capacitor decade (s) for resonance, as indicated by the peak deflection of the meter.
3. Read the corresponding capacitance (C) from the setting of the capacitor-decade dials.
4. Use this capacitance and the inductance (L) of the standard inductor to calculate unknown frequency fx with Equation 2-4.
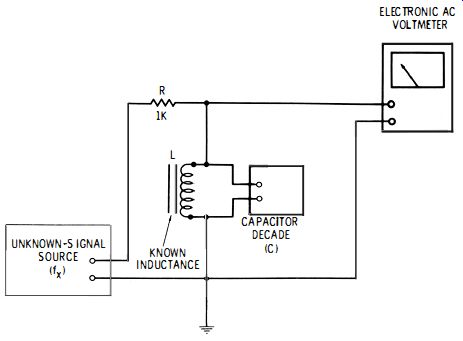
Fig. 2-17. Resonant circuit.
5. If the resonance is not obtained at any capacitance, change the inductor to one of different inductance and repeat Steps 1 through 3.
Illustrative example: When a 1.32-H inductor is used in the test setup, resonance is obtained with a capacitance of 0.0053 JLF. Calculate the unknown frequency.
Here, L = 1.32, and C = 5.3 X 10^-9.
From Equation 2-4, fx = 1/ (6.28 Y1.32 (5.3 X 10^-9» = 11 (6.28Y6.99 X 10-9) = 1/ [6.28 (8.36 X 10-0) ] = 1/ (5.25 X 10-< ) = 1905 Hz
This is a simple method of frequency measurement analogous to the absorption wavemeter method employed at radio frequencies. Its accuracy is hampered, however, especially at the higher frequencies, by indeterminate stray capacitance present in the setup even when the shortest possible leads are used. A further disadvantage results from self-resonance in the inductor. In search of such resonance (s) , the circuit should be inspected preliminarily with the capacitors disconnected, a signal applied from a variable-frequency audio generator, and the latter tuned from 20 Hz through 30 kHz. A self-resonant point will be indicated by peak deflection of the meter, and the frequency can be read from the dial of the generator. Ideally, the inductor would have no self-resonant point inside the intended range of frequency measurement.
In spite of its shortcomings, this method of frequency checking is useful when more-sophisticated equipment is unavailable. But, unless laboratory-type inductors and capacitors are employed and corrections made for stray and distributed capacitance, frequency error may run as high as 10 % to 25 %.