BIAS current serves two fundamental purposes. It satisfactorily reduces the high distortion which otherwise would occur on the tape. It raises the recorded level sufficiently to produce an adequate signal-to-noise ratio in playback. However, at the same time that it performs these vital services, bias current can have undesirable effects with respect to high-frequency response and noise.
Various explanations have been advanced as to why bias in creases output and reduces distortion. Some have employed mathematical approaches, some have tried to follow the complex magnetic behavior of the tape as it is subjected to the magnetic field resulting from the composite audio and bias currents. One reasoning is simply that in the presence of a bias field, which is very large compared with the audio field, the magnetic domains are in a state of agitation which decreases their resistance to magnetization.
No one theory has yet won unquestioned acceptance by all authorities. However, the effects of bias current on distortion and output are clear from an empirical point of view and shall there fore be approached in this manner. In the following discussion, the effects of bias current on output and distortion are shown for various frequencies. In all cases, a tape speed of 7.5 ips is assumed, but it should be clearly understood that the effects depend upon the wavelength recorded on the tape. However, the concept is more easily expressed in the familiar terms of frequency rather than in wavelength. Therefore, it is important to remember, for example, that a given effect, described as taking place at 1,000 hz when the speed is 7.5 ips, takes place at 2,000 hz when the speed is 15 ips. An increase in tape speed removes a given effect to a proportionately higher frequency, which may be outside the audio spectrum. Thus an increase in tape speed affords a means of partially or completely escaping the detrimental effects of bias current upon frequency response, whereas a reduction in tape speed aggravates these effects.
Effect on tape output
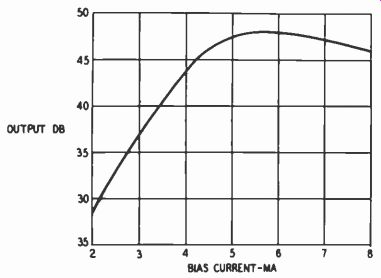
Fig. 501. Variation of output with bias current at 1,000 hz. Data are
for an Ampex model 300, 15-ips speed, audio current about 20 db below
the level producing 1% harmonic distortion, 3M No. IIIA tape. (Source:
The 3M Co., Sound Talk Bulletin, No. 21.)
Tape output is determined by the amount of flux recorded on the tape. Fig. 501 indicates how playback output at 1,000 hz varies as the amount of signal current through the record head remains constant and bias current is increased. (The values of bias current shown are of no significance inasmuch as bias requirements vary substantially, depending upon construction of the head.) The output rises very substantially as bias goes up, reaches a maximum and then declines.
It might appear at first that bias should be set at the point corresponding to maximum output. However, there are other factors which also affect the proper bias setting. One is the amount of distortion at various levels of bias current and another the effect of a given amount of bias upon high-frequency response.
Also, consideration has to be given to the sharp slope at the left of Fig. 501, which indicates that in this area small changes in bias can produce considerable changes in output.
Effect on distortion
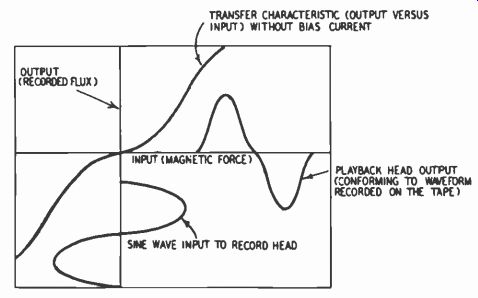
Fig. 502. Reproduction of a sine wave without bias current.
Fig. 502 illustrates what happens when a sine wave is recorded without the benefit of bias. The sine-wave input to the record head is represented on the vertical axis. The relationship between input (magnetic force) and output (recorded flux) for the tape in the absence of bias is shown by the "transfer characteristic"; this is analogous to the transfer characteristic for a radio tube, showing the relationship between input and output voltage. The waveform recorded on the tape, as indicated in playback, is rep resented on the horizontal axis, being the result of applying the transfer characteristic to the input signal. (This is done by proceeding from a given point on the sine wave vertically to the transfer characteristic, then continuing horizontally to a point whose horizontal distance from the start of the output curve equals the vertical distance from the given point on the sine wave to the start of the sine wave. This procedure is repeated for enough points on the sine wave to define the output waveform.) In Fig. 502 the output signal is considerably distorted. Since the distortion is symmetrical, it contains odd-harmonic multiples of the input frequency, which are in effect generated during recording. Thus, if a 1,000-cycle signal is recorded without bias, harmonic distortion will consist essentially of 3,000 hz, 5,000 hz, etc. The nonlinear transfer characteristic which produces harmonic distortion also causes IM distortion when two or more frequencies are recorded simultaneously.
Fig. 503 charts the relationship between bias current and distortion. Curves 1 and 2 refer to IM and curves 3 and 4 to harmonic distortion.
To produce fairly pronounced curves, a relatively high order of signal input was used. The curves were plotted, not for constant input level, but rather for constant playback level. Changes in bias current affect the amount of recorded flux and thereby the output level. But the important thing is how distortion varies with bias for a given amount of recorded flux. The amount of input signal required to produce this given flux is relatively of no concern for present purposes. Therefore the distortion-versus-bias relationships are plotted for a constant playback level.
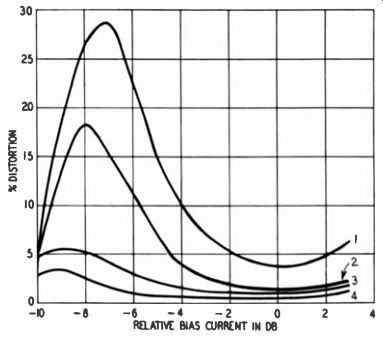
Fig. 503. Variation of IM and harmonic distortion with changes in bias
current. Curve 1:
IM distortion at playback level corresponding to +3 on VU meter. Curve 2: IM distortion at playback level corresponding to 0 on VU meter. Curve 3: Harmonic distortion at play back level corresponding to +3 on VU meter. Curve 4: Harmonic distortion at playback level corresponding to 0 on VU meter. (Source: Audio, October, 1956.)
Fig. 503 indicates: (1) Distortion in the main declines as bias increases, but there is a definite point of minimum distortion (more easily recognized in the IM curve) after which distortion rises again. (2) IM distortion is of greater magnitude than harmonic distortion. (3) IM distortion changes more rapidly than harmonic below and above the bias corresponding to minimum distortion. (4) The bias setting is the same for minimum IM and minimum harmonic distortion. (5) The higher the output level--that is, the recorded flux (curve 1 versus curve 2; curve 3 versus curve 4)-the more critical is the bias setting for minimum distortion. (6) When bias is set for minimum distortion, an increase in output level produces less increase in distortion than at other bias settings.
An interesting phenomenon is displayed in Fig. 503. If bias is reduced far enough, distortion drops sharply after first reaching very substantial heights. However, it appears that at low output levels such reduced bias still produces more distortion than does normal bias. Moreover, to operate at sub-normally low bias re quires a vastly greater amount of driving power from the record amplifier to compensate for the lower tape output at such bias.
Finally, at reduced bias levels the output level is relatively unstable because slight variations in bias produce large changes in output. (Fig. 501). Consequently, operation at exceptionally low bias has not been found practical for audio recording.
The relative values of bias for minimum distortion vary some what according to brand and kind of tape. For five tapes tested the bias settings that produced minimum distortion for a given output level are given in the following table. Tape A serves as a reference and its bias setting therefore is stated as 0 db.
Tape
Relative Bias Setting (db)
A 0.00
B 0.75
C-0.50
D 0.00
E-1.00
Among these five tapes, the bias setting for minimum distortion varied from -1.00 to +0.75 db, a 1.75 db range. While at first this may not appear to be very much of a deviation in terms of effect upon distortion, a variation of 1.75 db in bias setting can make a substantial difference in high-frequency response.
Effect on frequency response
Fig. 501 shows the effect of bias current on a frequency of 1,000 hz. Fig. 504 is similar, but shows the effect on a number of frequencies. Although a relatively large amount of bias causes output to fall below maximum at all frequencies, it is important to note that the higher the frequency, the greater the decline in output. Thus the lower frequencies have fairly gentle downward slopes while the higher ones exhibit very sharp slopes. Maximum output occurs at about the same bias value for all frequencies up to about 1,000 hz but at higher frequencies the point of maxi mum output is reached much earlier. Consequently, if bias is set to maximize 1,000-cycle output (0.6 ma in Fig. 504), response at 15,000 hz falls nearly 8 db below its maximum output. If bias is set at 0.8 ma (to reduce distortion further), then the response at 15,000 hz is more than 15 db below maximum output.
An increase in bias current from 0.6 to 0.8 ma is only 2.5 db, yet Fig. 504 shows that it can produce a difference of about 8 db in output at 15,000 hz. At 10,000 hz, a bias shift from 0.6 to 0.8 ma reduces output nearly 5 db. And at lower frequencies such a bias shift has still smaller effect. Thus at 1,000 hz there is an output difference of less than 1 db as bias is varied from 0.6 to 0.8 ma (Fig. 504). To summarize: extended high-frequency response-output in the region beyond 10,000 hz-is quite sensitive to relatively small changes in bias. It can, therefore, be under stood why a fair sacrifice in frequency response may be necessary to obtain a substantial reduction in distortion through an in crease in bias.
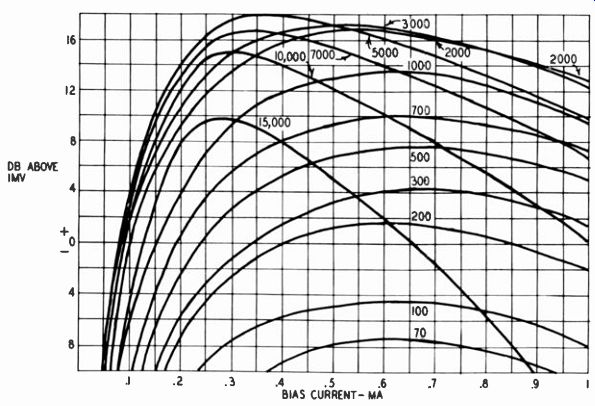
Fig. 504. Variation of output with bias current at various frequencies.
Data are for a Brush BK-1090 head, operated at 7.5 ips. (Source: Otto
Kornei, "Structure and Performance of Magnetic Transducer Heads," Journal
of the Audio Engineering Society, July, 1953.)
A more direct way of showing the variation of frequency response with bias current is that of Fig. 505. The curves represent the unequalized record-playback response of a tape recorder operating at 7.5 ips, employing a high-quality head (small gap and minor head losses). Three practical values of bias current for the head in question are used. As bias is increased, high-frequency output relative to the mid-range and low frequencies goes down.
Consequently, at higher bias values a greater amount of high-frequency equalization is required to achieve flat treble response.
The reason for the adverse effect of bias current upon treble response lies in the fact that bias current, which may be 10 or more times greater than audio current, has an erasing effect similar to that produced by the erase head. Unfortunately, the high frequencies are most vulnerable to erasure because the magnetic flux which has just been recorded penetrates the tape less deeply than at low frequencies. The net result is that high frequencies are recorded at relatively lower magnitude.
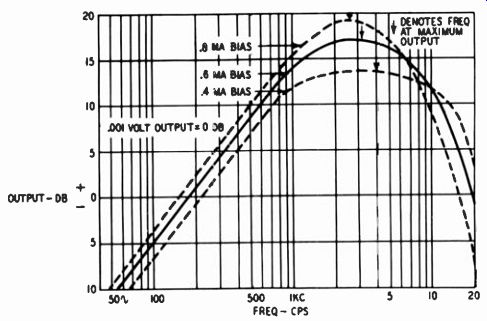
Fig. 505. Variation of unequalized record-playback characteristics with
changes in bias current. Data are for a Dynamu D105 head, operated at
7.5 ips. This head has a physical gap of 0.00015 inch. (Courtesy, Dynamu
Magnetronics Corporation.)
Noise
Bias current not only plays a detrimental role with respect to treble response but is also a potent source of noise. To the extent that the bias waveform contains harmonic distortion, particularly second harmonic, which is the worst offender, noise is produced on the tape in the record process. Harmonic distortion in excess of 1% can have appreciably serious results.
Bias current that does not have a symmetrical waveform in effect contains a dc component; this current, via the record head, produces a magnetic field containing a dc component that develops modulation noise. Furthermore, the asymmetrical waveform will eventually magnetize the record head, which introduces a dc component that causes modulation noise in both record and playback.
The record head can become magnetized in two ways: First, direct current may flow through the record head due to leakage through the coupling capacitors from the record-head driver and/or the bias oscillator. Second, even though the blocking capacitors are effective, the nonlinear characteristic of the heads at the relatively high value of bias current results in rectification, which causes the dc component to appear.
The asymmetrical waveform produced by the bias oscillator can similarly result in modulation noise via the erase head inasmuch as virtually all tape recorders use the same oscillator for bias and erase purposes.
(It is appropriate to mention, in connection with modulation noise produced by a magnetized head, that the playback head also tends to become magnetized due to the asymmetrical nature of audio waveforms recorded on the tape.) Bias current can introduce spurious audio frequencies-noise as the result of heterodyning between the bias frequency and upper harmonics of audio signal. For this reason it is recommended that the bias frequency be at least four or five times the highest audio frequency to be recorded. A factor of six or seven is preferable, although this raises various technical problems, including the fact that the erase head operates less efficiently as the frequency of the erase current rises.
Interdependence of performance characteristics
As earlier discussion has shown, frequency response varies with bias. Also, for a given recorded level, distortion varies with bias.
Conversely, it is true that for a given amount of distortion, the recorded level varies with bias. The latter is equivalent to saying that the signal-to-noise ratio varies with bias, because noise in playback is usually the limiting factor, so that the larger the signal recorded on the tape, the greater the overall signal-to-noise ratio.
In sum, frequency response, distortion, and signal-to-noise ratio are closely related to bias.
It may be seen, therefore, that these three vital measures of a tape recorder's performance are related to each other in large part through the effects of bias current. The interrelationship is of sufficient importance to merit extended treatment in this section.
Essentially, frequency response, distortion, and signal-to-noise ratio have a conflicting relationship, so that an improvement in a given respect can be attained only by a sacrifice in one or both of the other two. To make this clear, it is helpful to consider one characteristic at a time, show how it can be improved and indicate specifically how this improvement involves a sacrifice in the other characteristics.
Assume that it is desired to extend treble response. One way is to reduce bias current. High-frequency response suffers as bias is increased and, conversely, improves as bias is reduced. But a reduction in bias means greater distortion at high signal levels and possibly at all levels. To avoid increased distortion, one can re duce the record level, but then the signal level compared with noise and hum encountered in playback is smaller than before.
In other words, the signal-to-noise ratio deteriorates. Quite possibly, an increase in frequency response may be obtained partly at the expense of distortion and partly at the expense of signal-to noise ratio.
Another way to improve treble response is to increase the amount of treble boost in the record process; perhaps in the play back process, too. But more record treble boost may cause in creased distortion in the upper range. This distortion can be avoided by lowering the record level. But, again, this entails a reduction in signal-to-noise ratio. If treble boost is added in play back, this means increased tape noise and, once again, a lower signal-to-noise ratio.
Assume that it is desired to reduce distortion. Usually this can be achieved through an increase in bias current. But greater bias means poorer high-frequency response. To prevent high-frequency loss, as already discussed, treble boost in recording may be in creased but this invites higher distortion in the treble range unless the record level is reduced, which signifies a lower signal-to-noise ratio.
Assume, finally, that it is desired to increase the signal-to-noise ratio. This can be done by raising the record level, but then more distortion sets in. Increased bias may bring down this distortion, but, as before, at the cost of inferior treble response. Greater record treble boost can compensate the loss of high frequencies but, once more, higher distortion results, which calls for either more bias (thus continuing the vicious circle) or else for reducing the record level (which defeats the original objective).
It is apparent, therefore, that the designer and user of a tape recorder must steer a compromise course among the conflicting requirements of extended treble response, low distortion and high signal-to-noise ratio. An optimum point has to be found, representing a suitable balance among the three factors.
Opinion as to the proper balance may well vary from manufacturer to manufacturer and from recordist to recordist. Thus one manufacturer may feel it imperative to maintain response no more than a few db down at 15,000 hz at 7.5 ips and from this point of departure may seek the best balance between distortion and signal-to-noise ratio. Another may decide that the first consideration is to maintain a signal-to-noise ratio of at least 55 db and then find a balance between distortion and frequency response consistent with this ratio. Yet another may feel that low distortion is paramount, say 10% intermodulation distortion being the maximum permissible amount, and consequently from this point may try to achieve frequency response as wide as possible and a signal-to-noise ratio as high as possible. Finally, through advanced design and construction techniques, with cost a secondary consideration, a manufacturer may come up with a balance which, while not maximizing any one of the three basic performance requirements, nevertheless keeps each at a level consistent with high fidelity standards.
The better tape amplifiers enable the recordist to vary bias and frequency equalization over a practical working range and, of course, record level is always under the recordist's control. Thus lie can have a say in determining the balance among frequency response, distortion, and signal-to-noise ratio. Presuming the recordist has available a straightforward technique for achieving balance, he must first decide what standards of performance are compatible with high-fidelity reproduction. Personal judgment enters the picture here in a most important way.
For example, how important is it to have the frequency response clear out to 15,000 hz? Is there a really substantial loss in pleasurable listening if response begins to drop rapidly after 10,000 hz instead? Again, what should be the maximum allowable distortion, that is, distortion during peak passages? A figure as low as 1 or 2% IM distortion, although usually cited in connection with high fidelity equipment, is unrealistically low for most tape recording purposes. After all, peak passages come along just once in a while. Although the ear cannot endure substantial amounts of IM distortion, say 10%, for prolonged periods, very likely for brief periods it can endure substantial amounts, perhaps as high as 20% or more.
With respect to signal-to-noise ratio, there is, relatively speaking, more certainty as to what meets a high-fidelity standard. Yet there is considerable room for divergence in views on the subject.
Although ratios below 45 db produce quite noticeable noise, yet a person listening intently to the music can dismiss the unwanted background sound just as in a conversation-filled room a listener can concentrate on the one conversation that he wishes to hear and effectively filter out the others. So long as the background noise is of a constant nature-same level and same frequency characteristic-the listener can grow quite accustomed to it and dismiss it. Millions have played 78-rpm shellac records and found great musical pleasure despite the noise. To many such a listener, a rise in distortion would mean distress of much greater magnitude than the pleasure to be gained through less noise. On the other hand, there are persons less sensitive to distortion but very disturbed by the slightest noise.
With respect to all three performance characteristics, the nature of the recorded material can substantially affect what is considered acceptable. For example, certain types of music may impose relatively great demands with respect to keeping distortion low or frequency response broad. On the other hand, in recording the spoken word, a relatively large amount of distortion is tolerable, so that signal-to-noise ratio and, if desired, treble response as well can be improved.
All in all, there is no fixed rule as to what constitutes a proper balance among frequency response, distortion and signal-to-noise ratio. Trial and error and experience are perhaps the best guides.
In substantial part, the problem of achieving an optimum balance can be sidestepped by increasing tape speed. In other words, it is easier at a higher tape speed (15 ips rather than 7.5 ips) to find a balance satisfying the most people and most recording circumstances. This does not mean that such a balance cannot be achieved at 7.5 ips, which is the most popular speed for high-quality home recording. In fact, it is being achieved, although not so often as one would wish. However, at 15 ips it is easier to achieve a balance satisfying everyone.
Until quite recently, most professional recording was done at 30 ips to achieve top-quality results, but improvements in tape, heads, amplifiers and transports enable one today to achieve at 15 ips that which formerly required 30 ips. Similarly, the 7.5-ips speed can now provide the quality once available at 15 ips, al though a fair degree of effort is involved. It is quite possible, on the other hand, that the 7.5-ips speed will eventually fall into the luxury class because quality recording will be feasible at 3.75 ips or thereabouts.
More satisfactory results are obtainable at a higher speed, say 15 ips compared with 7.5 ips, because high-frequency losses (those due to bias erase, demagnetization and playback-head gap width) are largely a wavelength effect. The shorter the recorded wave length on the tape, the greater the loss. A given frequency is represented by a wavelength twice as great at 15 ips as at 7.5.
Hence the losses are distinctly less for a given frequency at 15 ips.
This means that one can use greater values of bias current and smaller amounts of treble boost in recording at the higher speed.
This results in less distortion and/or permits a higher record level (better signal-to-noise ratio). On the other hand, if it is not desired to reduce distortion or increase the signal-to-noise ratio, the treble range can be extended. Or one can do some of each.
There is still one more important consideration: Transports ordinarily perform better at high speed with respect to steadiness of motion. This is due to greater momentum of the rotating elements.