AMAZON multi-meters discounts AMAZON oscilloscope discounts
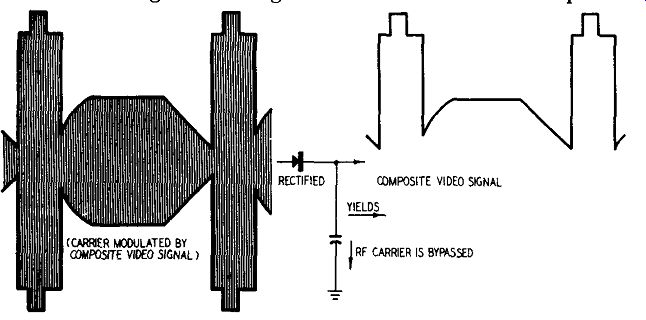
Fig. 201. The crystal in the probe removes one-half of the entire signal, consi5ting
of the modulating signal and the r.f. carrier. The carrier is bypassed by the
capacitor. The output is the original modulation voltage.
Although the crystal probe is characterized by extreme simplicity, it is an extremely important and vital link between the defective receiver and the test equipment. For this reason the service technician must know both its limitations and capabilities, how to use it with maximum skill, how to avoid damaging it and, finally, the servicing techniques than can be used in conjunction with the crystal demodulator probe.
There are many jobs a crystal demodulator probe can do. It can be used for signal tracing in r.f., i.f. and video-amplifier circuits, for buzz analysis in 4.5 -mhz amplifiers, or in the sound i.f. amplifier strips of split-sound TV sets, for ratio-detector marking.
It can be used for marker-generator calibration, for stage-by-stage alignment. You can use it whenever you need to detect a signal, just so long as you do not exceed the voltage rating of the crystal.
The illustration (Fig. 201) clearly represents the detector action of a crystal demodulator probe. Although we show here a video modulated carrier, the same idea applies to an r.f. carrier modulated by an audio signal. In this illustration, the high-frequency r.f. carrier, modulated by the composite video signal, is detected or rectified by the probe crystal. The much higher frequency r.f. carrier is bypassed to ground, with the result that the original composite video modulating signal is fed into the scope. Actually, this is the same sort of action that takes place in the video second detector circuit of a TV receiver.
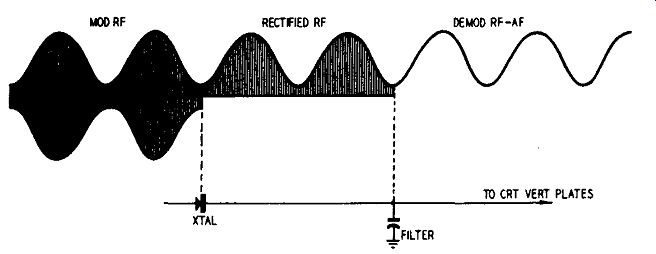
Fig. 202. Crystal demodulator probe action in an AM receiver. The crystal
detector rectifies the signal and the capacitor removes the remainder of the
original r.f. carrier.
Crystal demodulator probe action in an AM receiver is illustrated in Fig. 202. The r.f. carrier, modulated by an audio signal, is rectified by the crystal. The high-frequency r.f. is then bypassed while the original modulating signal is sent into the scope.
The size of filter capacitance in a probe is a design problem.
If the capacitance is too large, a substantial portion of the modulating signal will be bypassed, lowering the input level to the scope or v.t.v.m. Excessive filtering will also bypass the high frequency components of a pulse signal, resulting in a distorted waveform. If the capacitance is too small, filtering action will be poor and excessive r.f. carrier voltage will be fed into the scope.
The effect of this r.f. voltage on the scope trace is described later in this section. A well-designed crystal probe should have low capacitance, high impedance.
Radio servicing with the demodulator probe
With a demodulator probe, a scope can be used to trace a modulated r.f. signal at any frequency up to 500 mhz through a radio or television receiver from the antenna post through to the detector or discriminator. This is a practical and quick method of trouble shooting.
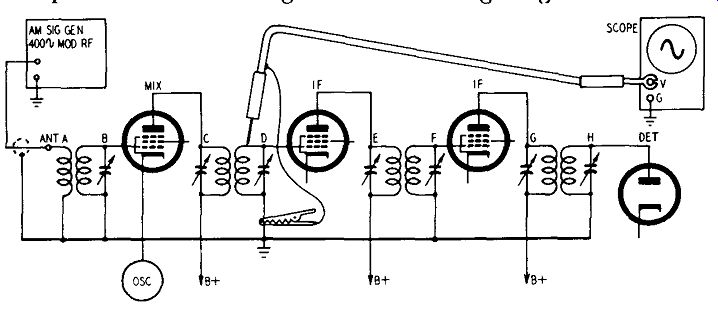
Fig. 203. Technique for stage-by-stage signal tracing in an AM receiver using
a crystal demodulator probe.
Tune the receiver to some frequency within its range (for example 1,000 khz) and adjust the signal generator to produce a 1,000 khz amplitude-modulated signal. Feed the signal generator in at the antenna post. Connect the crystal demodulator probe to the vertical input of the scope. The following checks can be made on the receiver by referring to Fig. 203.
WITH PROBE AT | CHECK
A | output of signal generator
B | r.f. transformer
C | 1st detector or mixer tube
D | 1st i.f. transformer
E | 1st i.f. amplifier tube
F | 2nd i.f. amplifier transformer
G | 2nd i.f. amplifier tube
H | last i.f. transformer
Signal tracing
Signal tracing in a TV receiver is quite similar in technique to signal tracing in an ordinary AM set, except that for TV we are much more concerned with waveshapes. When using a crystal demodulator probe, you can check anywhere from the front end to the picture-tube input. If you have a receiver that has a raster but no picture, you can go successively from the front end, through the picture i.f.'s, video-detector and video-amplifier stages, right up to the cathode or control grid of the picture tube (depending on which of these two elements is the signal electrode). Or you can reverse the procedure and work your way back from the output (picture tube) to the front end. The only requirement is that the signal must be strong enough to give satisfactory deflection on the scope screen. Generally you will find it necessary to use a sweep generator when signal tracing the front end.

Fig. 204. The picture at the left shows an ideal response curve. If there
is positive feedback in the stage, the curve may be distorted or exhibit undershoot
as in the illustration at the right.
Signal tracing is often thought of only in connection with finding a dead stage. However, signal tracing can do more than just that. You can also use it to find a weak stage or one that is in a regenerating or oscillating condition. Finding a weak stage is quite easy. The output signal of a tube should be greater than the input. The amount of gain per stage will depend on such factors as type of tube used, amount of load, bias, etc. If the out put is the same as the input (or less), then the stage is weak. Of course, this does not apply to a circuit such as a cathode follower where the output is always less than the input. A stage that is completely dead will show a waveform on the scope when the probe is placed on the control grid, but no waveform at all when it is placed at the plate.
The waveforms produced by a regenerative stage will depend upon whether you are using a TV station or a sweep generator as the signal source. If you use a sweep generator, you will find that the response curve of a regenerative stage will be very large either in the middle or at one end but will taper off sharply for the rest of the curve. If the amount of feedback in the regenerative stage is quite strong, you may even see false markers appearing in the sweep curve. ·with sufficient feedback, a stage may go into oscillation, in which case the curve may be torn apart or may exhibit undershoot, as illustrated in Fig. 204. This drawing shows the development of undershoot distortion in an i.f. curve, caused by grid-current flow in a first video amplifier.
When a tube is forced into oscillation, the control grid is made positive and draws current. This flow of current then counter acts the positive charge on the grid, driving the grid into a strongly negative region. If there is capacitance between grid and ground, as is often the case, the charge resulting from grid-current flow through the grid-return resistor will hold the tube cut off for a length of time dependent upon the amount of capacitance and resistance in the grid circuit. A tube in this condition often resembles a dead circuit; in fact it is so for as long as the tube is cut off.
If you are using a TV station instead of a sweep generator as your signal source, feedback or regeneration will distort the composite video signal. The equalizing pulses will show up on the scope as smaller in amplitude than the vertical sync pulses, or you may get severe overshoot and ringing along the top of the vertical sync pulse.
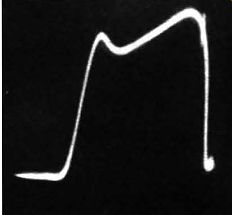
Fig. 205. A typical scope pattern observed when tracing a sweep signal through
the input stages of a TV i.f. amplifier.
I.f. gain and alignment
In simple signal tracing with a crystal demodulator probe, the technician is interested only in the relative change in the height of the pattern from stage to stage. Tests are ordinarily made by moving the probe from plate to plate, rather than from grid to grid, since plate circuits usually have lower impedance than grid circuits and are not loaded down by the probe to the same extent.
The ratio of the pattern height observed from grid to plate of a stage is an indication of the gain of the stage, at the frequency of test.
When tracing a sweep signal through an i.f. amplifier (for alignment), the scope should show a pattern like Fig. 205 or Fig: 206. (The over-all selectivity is poorer in the early i.f. stages and the pattern occupies a greater horizontal span on the scope.) It is a common error to assume that a pattern like Fig. 205 always rep resents a true single-stage or two-stage response. Actually, the true response of a single stage or a series of stages cannot be obtained unless the crystal probe is applied across the plate load of the last tube and this plate load must be made non-resonant by shunting the tuned circuit with a 200- or 300-ohm resistor. Curves like Fig. 205 or Fig. 206 which are obtained by merely applying Fig. 206. Sweep-signal trace produced in the output stages of an i.f. amplifier, the crystal probe at the grid or plate of an improperly loaded tube have little value for accurate alignment work. Special low-impedance probes are available which automatically provide the required circuit loading.
When aligning a TV set you may find that moving the output cable of the signal generator, or touching the cable with your hands, changes the pattern you see on the scope. This is an indication that the signal generator is not properly terminated, or else the impedance of the generator does not match the impedance of the points under test. Sometimes both conditions can exist, causing standing waves on the signal generator cable and resulting in distortion of the pattern on the screen. The cure is to insert a matching pad between signal-generator cable and receiver. Such pads are available commercially. A visual alignment setup is shown in Fig. 207. Read, also, the section on standing wave distortion given on page 48.
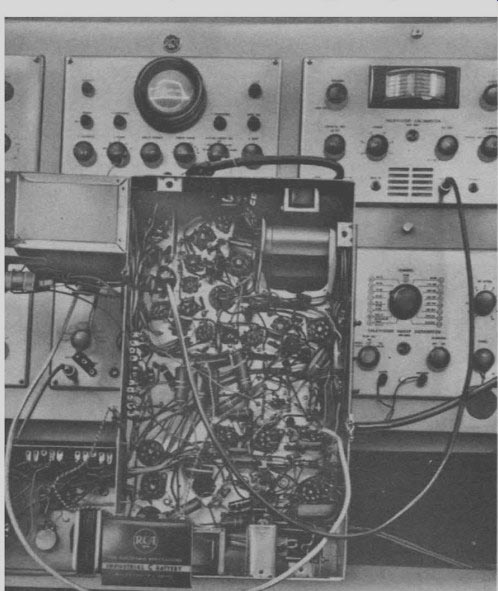
Fig. 207. Visual alignment setup of a TV receiver. Improper impedance matching
between test equipment and receiver can cause changes in the observed scope
pattern when you touch the signal-generator cable.
Locating a dead stage
To locate a dead stage, apply a modulated r.f. signal into the antenna posts of the receiver. If a fairly strong TV signal is avail- able from the antenna, it can be used for this purpose; otherwise the modulated output from a signal generator should be used to obtain sufficient input voltage. The output from the generator should have the same frequency as the channel to which the TV receiver is tuned. Touch the probe successively to the grid terminals of the first, second, third and fourth i.f. tubes, watching the pattern on the scope screen. (The probe can be touched to the plate terminals of the tube if desired.) If the pat tern disappears at any point, the stage is dead and trouble shooting is in order.
[[•This occurs very seldom since at least 20,000 microvolts of signal are required for checking the first i.f. stage. ]]
In the illustration (Fig. 208) a poor connection to the plate-load resistor is indicated at x. In such case, a sine-wave pattern (modulation envelope) would appear on the scope screen when the resistor is prodded to make a good connection, but the sine-wave pattern will not be seen until the resistor is moved physically. If the probe is applied at the grid of such a stage, the sine-wave pat tern will be visible continuously, showing that the circuit is normal on the grid side. Note that the input impedance to a crystal probe becomes lower as the operating frequency is increased.

Fig. 208. A break at point x in the circuit (poor connection, intermittent
resistor, etc.) can easily be found with the help of a scope.

Fig. 209. Signal tracing with crystal probe shows dead stage as a horizontal
line.
Accordingly, the circuit loading will be greater at 45 than at 25 mhz.
Fig. 209 shows the pattern obtained on the scope screen when the i.f. stage under test is dead. A normally operating stage will usually show a gain of approximately 10, as illustrated in Fig. 210.
Viewing response of single i.f. stage
The probe can be used to view the response curve of a single stage in a TV receiver or the combined response of two or more stages. In this application the circuit diagram for. the receiver is first inspected to determine the particular coils which shall be tested. If a single coil is to be checked, apply the output from the sweep generator to the control grid of the tube preceding the coil. Inject the sweep signal through a 0.001-µf blocking capacitor to avoid disturbing the grid bias of the tube. The crystal probe is then touched to the grid terminal of the tube following the coil, and the single-stage response curve appears on the scope screen.
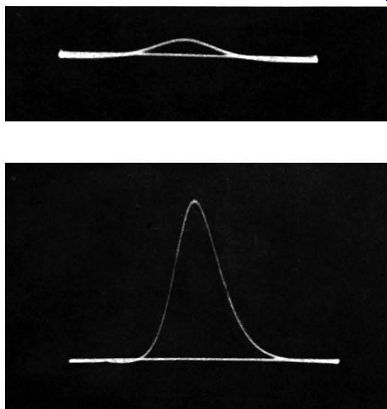
Fig. 210. When using a crystal probe to trace a sweep signal through the i.f.
amplifier, the pattern height increases from stage to stage, as shown above.
The example shown indicates a gain of 10 which is typical for a conventional
receiver.
You should note that this test tends to detune the coil, since the crystal probe has a definite amount of input capacitance even though such capacitance may be very small. To avoid this detuning, the probe can be applied to the plate terminal of the tube following the coil (as shown in Fig. 211), provided a 200-ohm resistor is shunted across the plate-load impedance during this test. The 200-ohm resistor "swamps out" the resonant response of the plate load so that the scope shows the true response curve of the grid circuit. At the same time the tube following the coil isolates the probe input capacitance from the coil under test so that no detuning occurs.
The tuned-grid circuit which is connected to the grid of the first tube does not affect the response because the low impedance of the sweep-generator cable acts as a swamping resistor. The crystal probe is a necessary part of the test setup because the scope will not respond directly to the high-frequency output of the sweep generator.

Fig. 211. Circuit diagram shows the use of a 200-ohm swamping resistor shunted
across the plate load.
Tracing buzz: pulse in sound i.f. strip
The crystal probe also has great utility in tracing a 60-cycle buzz pulse through the high-frequency circuits of an intercarrier receiver. The scope can be applied directly in audio-amplifier circuits, when tracing a buzz pulse in the region between the out put of the FM detector and the speaker. However, a scope will not respond directly to the 4.5 -mhz carrier frequency present in the circuits between the control grid of the picture tube and the input of the FM detector. Here the crystal probe permits the buzz pulse to be traced back to the grid of the picture tube.
Quite frequently you will find that the buzz pulse must be traced farther back into the receiver circuits, for example, into one of the video stages or even into one of the earlier stages. In such case, the crystal probe cannot be used directly, because the picture signal is much stronger than the sound signal and will mask the buzz pulse being traced. To overcome this difficulty, you can make tests in the video amplifier by attaching a tuned coil to the terminals of the crystal probe. This tuned coil is resonated at 4.5 mhz and is used by coupling the tuned coil loosely to any of the peaking coils in the video-amplifier circuit. If tests are to be made in the picture i.f. amplifier, a tuned coil is attached to the terminals of the probe and resonated to the second i.f. of the TV set.
In some cases the coil can be coupled closely to an i.f. coil; but if the receiver utilizes shielded coils or if the signal level is too low for satisfactory scope deflection, you should use a 3-µµf coupling capacitor to increase the coupling. The crystal probe will load the tuned coil. If the tuning is too broad and does not reject the picture signal satisfactorily, the crystal probe should be tapped down on the coil, as required, to minimize the loading.
When making a test for buzz using the crystal demodulator probe, the 4.5-mhz sound signal on the scope screen will show a 60-cycle pulse if the buzz is affected by the setting of the fine tuning control. This pulse will look somewhat like the 60-cycle vertical-sync pulses. If the buzz cannot be tuned, it will show up on the scope screen as a sharply pointed 60-cycle spike voltage.
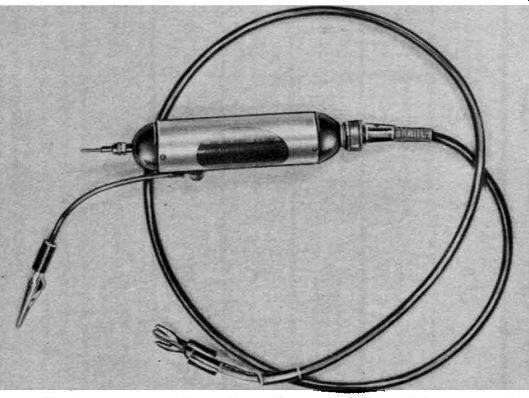
Fig. 212. Photo of a crystal probe. The ground lead is fastened to one side
of the probe housing.
Table 3-VOLTAGE AND CURRENT RATINGS FOR CRYSTAL DIODES USED IN TYPICAL OSCILLOSCOPE PROBES.
Testing video amplifiers
There are two general methods of testing a video amplifier.
One technique is to apply a sweep signal to the input of the amplifier and to display the amplifier output on the scope screen.
The video sweep signal used in such tests varies from a low frequency of about 100 khz to 5 or 6 mhz, 60 times a second.
The probe used must rectify video sweep frequencies from 100 khz to 5 or 6 mhz and pass the envelope frequencies of the sweep output. The envelope of the sweep output may be considered as a 60-cycle square wave. In other words, the probe must demodulate the carrier component of the modulated wave (sweep output), and must develop the 60-cycle square-wave modulation envelope on the scope screen without appreciable distortion. A typical de modulator probe suitable for this application is shown in Fig. 212.
The crystal diode type used for video-sweep demodulation may be a matter of concern. as relatively high peak voltages may be encountered during video-amplifier testing. The normal output from a video amplifier is approximately 50 volts peak-to-peak.
But when the amplifier is overdriven, as it frequently is, 75 to 100 volts peak-to-peak can be developed. In such a case, crystal diodes of the less rugged type will become damaged., However, there are several types that are quite durable. Voltage and current ratings for crystal diodes used in typical crystal demodulator probes are shown in Table 3.
The crystal diode in the probe must be able to withstand double the applied peak voltage of the signal. Of course, this is true only of symmetrical wave forms, such as sine and square waves. For nonsinusoidal signal voltages, the crystal diode may have to with stand nearly double the peak voltage, more or less.
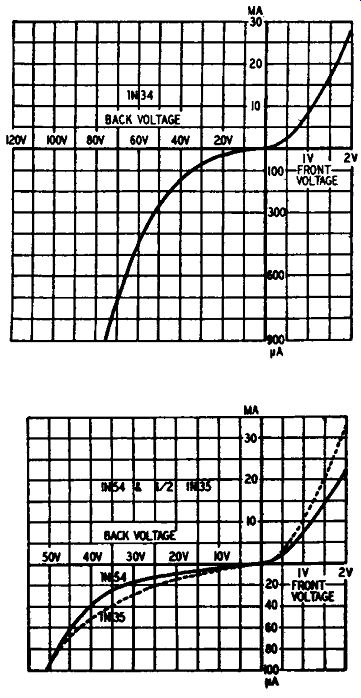
Fig. 213. Voltage-current relationships of three germanium crystal diodes.
The manner in which these considerations tie in with commercially available crystal diodes is shown in Table 3. The continuous reverse working voltage is not applied to the crystal in normal testing, but the peak back voltage may be taken as the peak-to peak output voltage from the video amplifier when the crystal diode is used in a standard crystal probe. Most of the types in Table 3 may be used without extra precautions, although there are a few that could be damaged by the high temporary transients which are often found when connecting the equipment. Crystal diodes used with video detectors have become damaged by high peak surges caused by sweep leads being dressed too closely to the detector leads. Fig. 213 shows that the back current of the crystal diode increases at a rapid rate in the region of maximum back voltage.
A demodulator probe which is satisfactory for i.f. signal tracing may be quite useless for video-amplifier testing. The reason is that the response of the video amplifier depends in great part on the shunt capacitance across the output. If this shunt capacitance is greater than the input capacitance of the picture tube, the high frequency response will appear to be very poor. On the other hand, if the shunt capacitance of the test circuit is less than the input capacitance of the picture tube, the frequency response will appear to be better than it really is.
Obviously, the input impedance of the demodulator probe must equal the picture-tube input impedance. The probe must also have good response to 60-cycle square waves, because the demodulated sweep output is of the same general form as a 60-cycle square wave and, if the time constant of the probe is too long, the scope will indicate a true rise but a false fall of the response curve.
Adjusting a video amplifier
To view the video response curve on the screen of the scope, disconnect the picture tube from its socket and insert the prod of the crystal probe into the video-input terminal of the socket. (See Fig. 214.) Switch the receiver to a vacant channel to avoid interference. Apply a sweep signal from the sweep generator to the input of the video detector through a 10-µµf capacitor. The center frequency of the sweep generator output should be the same as the center frequency of the i.f. strip and the sweep-width control of the sweep generator should be set to approximately 6 mhz. Apply an unmodulated r.f. signal from a marker generator in parallel with the sweep signal through a 10-µµf capacitor. The two l 0-µµf capacitors help keep the video amplifier from being overloaded and also block any d.c. voltage which may be present.
This method tests the detector peaking coils with the rest of the video-amplifier circuit and is preferable to applying a video- frequency sweep signal directly to the input of the video amplifier.
Tune the marker generator to the center frequency minus 3 mhz of the sweep generator. This will now provide a beat signal which is developed in the output of the picture detector. The video response curve will now be visible on the scope screen.
Adjust the output levels of the generators to a point which avoids overload and artificial flattening of the top of the video response curve. To inject a marker into the system for location of the essential points (such as 100 khz; 1, 2, 3 and 4 me; and 4.5 me) connect the output of a signal generator to a floating tube shield placed over the first video tube. Capacitors, resistors and peaking coils are then adjusted to make the video response curve correspond with the published curve shown in the service notes for the receiver.

Fig. 214. Technique used for observing the response of a video amplifier on
a scope.
Square-wave testing
A second technique of video-amplifier testing is the square wave test. It is informative because it shows up phase distortion as well as frequency distortion in the video amplifier.
Phase distortion is just another way of expressing abnormal time delay. This means that small picture elements may arrive slightly later or slightly earlier than large picture elements, regardless of their positions in the original picture. Accordingly, phase distortion causes the small picture elements to be displaced horizontally with respect to the larger elements. An observer would describe the picture as "smeary." For accurate square-wave tests on video amplifiers, the vertical deflection amplifier in the scope must have better frequency and phase characteristics than the TV receiver. Otherwise the output from the video amplifier must be applied directly to the vertical deflection plates of the scope. (This gives the best possible frequency and phase response from the scope but has the disadvantage of providing only ¾- to ¼-inch deflection on the scope screen.) Never feed the output of the video amplifier directly through a cable to the input of the scope. Any usable length of cable will have very much greater capacitance than the grid-cathode circuit of the picture tube, and the square-wave response on the scope screen will be grossly misleading.
If such distortion is to be avoided, a low-capacitance probe must be used. This probe should have the same input capacitance as the picture tube If the output of the video amplifier is applied directly to the deflection plates of the scope, the connection must be made with a short, unshielded test lead. Of course, the socket is removed from the base of the picture tube in all such tests, because the input capacitance of the scope setup is substituting for the input capacitance of the picture tube.
You will note in this discussion of square-wave testing of video amplifiers that we have not mentioned the frequencies at which the square-wave generator should be set.
There are different opinions as to the relationship between the frequency of the square wave and the bandpass of the amplifier under test. Some engineers maintain that when an amplifier passes a square wave without distortion, it is flat from f/10 to 10/, where f is the square-wave frequency. Others work between 3-db (cutoff) points. To check low-frequency response, they set the generator to 10 times the amplifier response at 3 db and watch for an undistorted wave on the scope. For the high-frequency check, they set the generator to a frequency whose 21st harmonic is the same as the amplifier response at the high-frequency cutoff point.
In any case, it takes practice and familiarity with one's scope and generator to get the best results from a square-wave test.
A video amplifier is designed for a given bandwidth with predetermined input and output impedances and known values of stray wiring and shunt capacitances. ·when any test instrument is connected directly across the input or output of a video amplifier, it will upset the normal operating conditions and cause misleading observations. Long test leads to the scope and generator will in- crease the stray capacitance of the circuit. The amplifier must work from and into the proper load impedances.
In TV broadcasting, special buffer amplifiers, probes, and other adapters are used with the scope and generator to prevent disturbing the inherent response characteristics of the circuit under test. You will not be able to rely on any square-wave response measurements that you make unless you can be sure that the frequency-determining constants of the circuit have not been altered by connections to the test instruments.
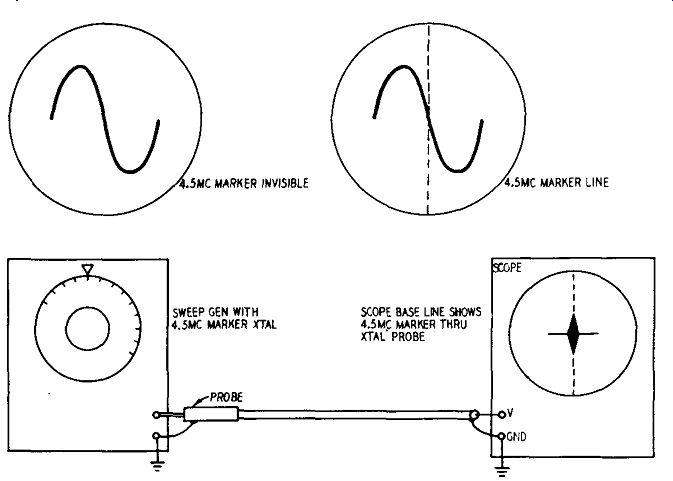
Fig. 215. Setup used for marking a ratio-detector or discriminator trans former
curve.
Marking a ratio-detector curve
The AM rejection of many ratio detectors is so complete in many receivers that a 4.5 -mhz beat marker cannot be seen on an
S-curve or on a crossover curve. (A beat marker is an AM disturbance on the visual response curve.) To locate the marker, first disconnect the receiver and connect the probe from the sweep generator to the scope, as shown in Fig. 215. The crystal probe now substitutes temporarily for the 4.5 -mhz sound section of the TV receiver, and the 4.5 -mhz marker will be plainly visible along the horizontal base line of the scope screen.
Rotate the dial of the sweep generator until the 4.5-mhz marker appears exactly in the center of the screen. From this point on, the vertical center line of the screen will continue to indicate the 4.5 -mhz point on the S-curve as long as the sweep-generator tuning control and the horizontal-centering control of the scope are untouched.
Disconnect the crystal probe and reconnect the TV receiver.
Although the 4.5 -mhz marker will not be visible on the S-curve, this 4.5 -mhz point is now known and is marked by the intersection of the vertical center line of the scope screen with the S-curve.
Some confusion may arise in case the retrace is not blanked; if the retrace is not blanked, the phasing control of the sweep system should be adjusted to make the trace and retrace superimpose on each other, before work is started. If the retrace is blanked, no confusion will arise in any case.
When it is desired to mark a crossover S-curve in this manner, proceed as follows: First obtain the crossover pattern, setting the sync controls as required on the scope panel. Next, disconnect the TV receiver and temporarily substitute the crystal probe; two markers will now be seen on the scope base line and the sweep generator is now tuned to make the two markers coincide with each other. The horizontal-centering control of the scope is then adjusted to make the 4.5 -mhz superimposed marker appear in the exact center of the scope screen. Finally, the crystal probe is re moved and the TV receiver reconnected to the sweep generator and scope. The crossover point of the crossover pattern will, in general, appear to one side or the other of center screen. The ratio detector (or discriminator transformer) is adjusted to make the crossover point appear in the exact center of the scope screen and the detector is then in proper adjustment.
Calibrating a marker generator
When starting on an alignment job the first step is to check the calibration of the marker generator. Experienced technicians know that unless the 4.5 -mhz marking frequency is accurate, the sound output from the receiver will be weak and distorted, or per haps completely inaudible. For this reason a method of calibrating the marker generator is an absolute necessity.
Without marker accuracy, the local-oscillator, ratio-detector and sound trap adjustments present a hopeless problem in the busy shop. Many marker generators have built-in calibrating facilities.
Indication of zero-beat points-by beating the output from the marker generator with the harmonics from a quartz crystal-may be either audible or visual. If a generator does not have built-in calibrating facilities, the technician should obtain a 1-, 2- or 5 -mhz crystal oscillator. It would be advantageous to use a voltage doubler probe (no polarization). Voltage-doubler probes are de scribed in the next section.

Fig. 216. A crystal demodulator probe can be used with a crystal oscillator
for accurate calibration of a marker generator.
A crystal probe used in combination with a 1- or 2 -mhz crystal oscillator, as shown in Fig. 216, provides a very convenient method of calibrating a marker generator. The outputs of the marker generator and the crystal oscillator are connected in parallel with each other and the beating output is then applied to the scope
through the crystal probe. As the marker dial is rotated, strong beats will appear at each 1 -mhz (or 2 -mhz) point along the marker dial. It is most convenient to use a low-frequency sweep such as 60 hz.: the individual beat cycles can then be seen as the zero beat point is approached. The dial of the marker generator is adjusted as closely to zero beat as possible (minimum number of cycles visible on scope screen). If the marker generator is in calibration, the dial will then indicate an integral multiple of 1 -mhz (or 2 -mhz), such as 20, 22, 24, 26, 27, 33, 49 or more mhz. The marker dial will develop zero beats (or a minimum number of sine-wave cycles on the scope screen) when the marker frequency is an exact multiple of the crystal fundamental frequency.
It is important to note that most marker generators have a strong harmonic output. Consequently, beats occur not only between the fundamental frequency of the marker generator and the crystal harmonics, but also between the harmonics of the marker generator and the crystal harmonics. Minor (interharmonic) beats will be therefore observed as well as major (fundamental vs. harmonic) beats.
To illustrate this fact with a practical example, consider an arrangement in which a marker generator is being beat against a 2 -mhz crystal. Strong beats will be observed on the scope screen at 20, 22, 24, 26 and 28 me; however, weaker beats will also be ob served at 21, 23, 25 and 27 mhz. These interharmonic beats, accordingly, provide double the number of check points from a crystal compared with the number available from a generator having pure sine-wave output. Any crystal oscillator can be used, but service technicians will find it most useful to utilize 1-, 2- and 4.5 -mhz crystals.
If the harmonics of the crystal oscillator become too weak to check the higher frequencies of the generator, the technician must
obtain another signal generator. First, he calibrates the auxiliary generator from the crystal at as high a frequency as possible. Next, he substitutes the calibrated generator for the crystal oscillator.
Thus, the auxiliary generator acts as a "stepping stone" to higher frequencies.
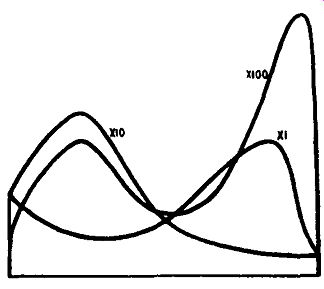
Fig. 217. Example of attenuator resonances and partial rectification of r.f.
signal by the vertical amplifier of a scope.
Setting the marker-generator dial to various frequencies may require a vernier scale, which can be used to split up the coarser divisions on the dial scale into very fine divisions.
Checking the output of a sweep generator The output from the sweep generator is applied to the vertical input terminals of a scope through the crystal probe. The generator is adjusted to develop a zero-volt base line instead of the return trace. (Not all sweep generators provide this facility.) If the output of the sweep generator is flat, two parallel lines will then be seen on the scope screen. If the generator is not flat, one of the lines (base line) will be straight but the other (output level) will display dips and humps. The percentage of departure from flatness is then found by counting squares on the scope screen.
(Note: Many sweep generators used in service work have appreciable harmonic output at u.h.f. In such cases, the probe will go into resonance and the test will not be meaningful unless a low pass filter is connected between the sweep generator output and the crystal probe. The low-pass filter should cut off above 200 mhz--preferably above 100 mhz--since lead lengths are extremely critical above 100 mhz.)
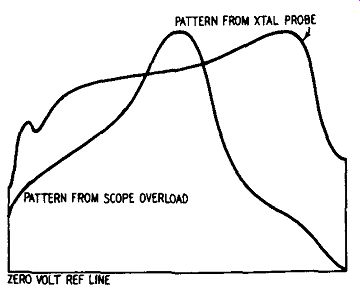
Fig. 218. Patterns obtained from crystal probe and from overloaded scope.
Keep r.f. out of scope input
Because of unsuitable probes or improper modes of testing, the technician is sometimes misled during signal-tracing procedures by r.f. voltages entering the scope-input circuit. Only demodulated voltages from the probe should be permitted to enter the vertical amplifier of the scope. As shown in Fig. 217, frequency discrimination at r.f. and spurious resonances lead to erratic and unpredictable screen patterns. Partial rectification of the high frequency voltages which find their way into the vertical amplifier develops a pattern which has no practical value.
When sweep-wave envelopes of i.f. signals on the scope screen are viewed by overloading the vertical amplifier with the signal under test, the pattern is highly distorted as compared with the pattern obtained when a suitable crystal probe is used, as illustrated in Fig. 218.
Ground returns
Brief mention was made in Section 1 of the necessity for a good ground connection for the probe. Unnecessary trouble is sometimes encountered in i.f. signal tracing because of failure to provide a good r.f. ground.
Suitable ground returns are of great importance in signal tracing work. Much of the difficulty experienced by beginners comes from faulty grounding. Fig. 219 clearly distinguishes be tween the r.f. and the a.f. circuits which are present in the probe arrangement. The ground lead to the chassis should always be kept very short, and the ground point should be made as near as possible to the signal take-off point in the i.f. amplifier circuit.
This is of concern when high-frequency tests are being made. It is often necessary to dispense with the short ground lead that is provided with the probe and to make the ground return directly to the shielded case of the probe. Some commercial probes come equipped with an alligator clip fastened near the tip end directly to the metal probe housing.
While a long grounding route would not be of practical concern when a 10-to-1 or a 100-to-1 probe (described in Sections 5 and 6) is in use, the long ground route commonly leads to curve distortion, regeneration or even oscillation when utilized with a crystal probe in i.f. amplifier signal tracing.
The probe should have a short ground lead which must be used at all times. Never make the mistake of using some other and longer ground lead, as absurd indications will frequently result. ·when testing an i.f. amplifier in particular, the ground return should be made to the same point in the set as the grid return. Remember that the results obtained with the probe at frequencies above 100 mhz will depend more upon the nature of the connections than upon any other single factor.
Fig. 219. Diagram of probe signal circuits.
Waveform errors
The output from many signal generators is far from sinusoidal.
Likewise, the waveforms tested in the i.f. amplifier of a TV receiver are frequently of a pulse type. Since a crystal probe is polarized and the positive and negative peak voltages of nonsinusoidal waves are often widely different, the probe may appear to be very sensitive under some circumstances and insensitive under other circumstances. To be of the greatest general utility the crystal diode probe should provide forward resistance (lowest crystal resistance) for applied positive voltages. This arrangement makes the crystal diode less susceptible to damage from surges when a.c. voltages are being tested in the presence of relatively high positive d.c. voltages.
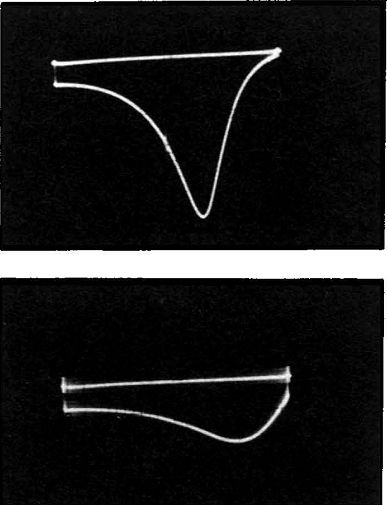
Fig. 220. Illustration at the top shows normal response curve. In the lower
picture we see how the curve changes shape when sweep-generator tuning dial
is touched.
Maximum signal voltage
A.c. voltages in excess of 20 peak volts will impair the sensitivity of the crystal diode, or burn it out completely.
Input impedance at high-channel frequencies
The input impedance of a crystal probe falls to very low values at upper frequencies. When the probe is to be used at frequencies in the vicinity of 200 mhz, for example, it is essential to drive the probe from a very low impedance source - 50 ohms or less. It may be noted that unbypassed cathode resistors and signal-generator output cables represent suitable low-impedance sources for operating a crystal probe at the upper v.h.f. frequencies.
Standing-wave distortion
Standing-wave distortion is a most troublesome alignment bug, especially when the technician is unaware of its basic cause.
Standing-wave distortion shows up as a change in the shape of the response curve due to body capacitance in the vicinity of the instruments or the TV chassis, and appears as shown in Fig. 220. There are at least two types of standing-wave distortion. One occurs inside the sweep-output cable, the other occurs outside the sweep-output cable. Standing waves are generated inside the sweep-output cable when the cable is improperly terminated.
The sweep-output cable is usually connected to a light load, such as a floating tube shield over the mixer tube. This floating tube shield represents a very light capacitive load at the end of the sweep-output cable and does not provide the required termination (impedance match). To terminate a sweep-output cable properly, it is usually necessary to shunt a 75-ohm carbon resistor across the end of the cable. The termination is sometimes provided by the manufacturer of the instrument. It is essential to use carbon resistors for termination, because a wirewound resistor will have high inductive reactance at intermediate alignment frequencies, and will fail to provide a proper termination.
When a sweep-output cable is not terminated in its own characteristic impedance (usually 75 ohms), a peculiar situation results.
Not all of the electric energy flowing down the cable is absorbed by the load. Some of the down-coming energy is reflected back up the cable again. This reflected energy interferes with the incoming energy at half-wave points, and as the generator sweeps through the frequency band, these interferences, sometimes called "hot" spots and "cold" spots, oscillate along the cable, back and forth, at a 60-cycle rate. The generator will then deliver a higher voltage to the load at one frequency and a lower voltage at another.
The response curve is distorted by the abnormal voltages.
But there is a distinguishing characteristic which is very important to the working technician-the curve shape changes when a terminating resistor is shunted across the end of the output cable, but the curve shape does not change when the technician moves about or touches the test instruments.
If the curve shape changes when a dial or cable is touched, standing-wave distortion is present as a result of sweep voltage on the outside of the instruments and cables. In some cases, sweep voltage spreads out over the outside of the cable because of improper termination, but more often the sweep voltage spreads along the outside of the cable from the generator end. Faulty connectors, for example, are often responsible for sweep voltage leaking from the generator to the outside of the cable.
One of the standard methods for minimizing trouble from standing-wave voltages of this type is to ground all the test instruments together. A business like way is to mount all the instruments in a rack-and-panel assembly, which can in turn be grounded to a water pipe. More often than not a water pipe will not be close at hand. In such an event use a heavy copper strap to connect all instrument cases and run the strap to a water pipe or a copper rod driven into the earth. Where possible, solder the copper strap to the instrument cases and, of course, to the grounded rod.
Connecting the crystal probe
Because of the crowded condition existing in some TV chassis the service technician is often inclined to put the tip of the probe at the nearest convenient point. This type of technique is suitable for measuring d.c. voltages with a v.t.v.m. and a pair of clip leads, but can lead to misleading results when a crystal probe is used.
The probe point should be placed as closely as possible, preferably directly, at the exact spot where the signal voltage is to be checked.
The probe ground clip should also be as close to the check point as possible.
Lead dress, particularly in high-frequency circuits, is important.
In servicing, the natural tendency is to push leads out of the way so that you can get in at the test point underneath the wiring.
High-frequency circuits, characterized by small values of inductance and capacitance, are sensitive to any changes in wiring or components. Try to put the probe point directly at the spot where you want to make your check, moving as few wires and components as possible.
Crystal facts
Diode crystals are marked in a number of ways. The letter K or the word "cath" sometimes appears on the crystal to indicate the cathode. Some crystals use a band of color near the cathode end of the crystal.
Crystals are seriously affected by heat. A soldering iron can easily ruin a good crystal. If you find it necessary to solder to crystal diodes, hold the crystal diode lead with the flat portion of a pair of long-nose pliers. The pliers should be held as close to the body of the crystal as possible.
Sometimes you will find it necessary to fasten a crystal probe into a circuit and to have the probe remain in place for a period of time. Don't support the probe on any heat-generating device. Instead, let the probe clip on device hold the unit in place.
Single diode crystal units do not supply any signal gain but produce a signal loss instead. For many applications, such as those described in this section, this is not serious. However, for work in low-level stages, a crystal type voltage-doubler probe is often helpful. Such probes are described in the next section.
(Note: This guide based on the 1955 book, Probes)
AMAZON multi-meters discounts AMAZON oscilloscope discounts