THE audio engineer is not usually concerned with the design of speakers; this is a specialist's job and the designer of sound equipment generally makes his choice from the numerous types and models available. Although it would, therefore, be outside the scope of this guide to deal with speaker design, the audio technician requires some guidance in making the best choice.
Published data on speakers are generally entirely misleading, not through any inherent dishonesty on the part of the sponsors of such information, but simply because there is no agreed basis on which measurements should be made. The curves and other information published in advertisements and catalogs is probably quite accurate but can still be meaningless under actual working conditions. For example, it is quite customary to show the response curve of the acoustic output of a speaker with a steady input of I watt of audio power. Such a curve is about as useful as the response curve of an amplifier with a resistive load; neither condition is met in actuality-it is a laboratory statement only.
Even then, such a curve is of little use unless it can be compared with the curves of other speakers taken under identical conditions of input, loading and acoustic surroundings. Still the comparative curves would have no practical value if nothing is said about the position of the measuring microphone. If it is stated that the microphone is on the axis, then the static response of the speaker can be assumed only for axial reception. The performance of a speaker under static conditions should be shown in a set of polar radiation curves and these curves can only be compared with an other set of polar curves, provided the measurements were all taken in the same measuring room on speakers identically mounted and given precisely the same input.
Limitations of frequency response curves
The accompanying figures illustrate the performance of the author's 215 speaker. They are used, not because of any desire to publicize this particular speaker, but because the data is avail able and known to be accurate. It is presented as an example of the information required before a speaker's performance can be assessed in the static state, and the engineer or music lover who wishes to assess the performance of other speakers is quite reason ably entitled to ask for the same type of data from their manufacturers. Such curves begin to tell the story of what the speaker will do, but it is only the beginning of the story.
Fig. 1001 shows the frequency response of the Hartley 215 speaker on the axis with 1 or 4 volts input. The lower curve shows that the sound output of the speaker is within +5 db from 40 to 20,000 hz with a sinusoidal ac input of 1 volt rms. This seems to be a pretty good performance. And it is a fact that this particular speaker, in spite of being a simple straightforward single-unit system, has an unusually wide frequency response, and the curve shown compares very favorably with curves of other speaker systems, even when multi-channel and expensive. But that is not the whole story. Fig. 1001 (upper curve) also shows the axial response with 4 volts input and now it is found that the response between 40 and 20,000 hz is within the limits of + 12.5 db. The inference is that this particular speaker introduces distortion as the input is increased, and if other speakers did not do so the designer would have something to worry about. Now the possibility of other speakers distorting under these conditions can be demonstrated only by a similar pair of curves, and it is only commercial common sense to emphasize the good features of a product and not say very much about weak points. ·what is much more difficult to combat is the lack of understanding of nontechnical buyers examining a highly technical proposition, and a speaker is a highly technical proposition.
The curves of Fig. 1001 were compiled from measurements made in a properly designed anechoic chamber. The speaker was mounted in the author's nonresonant box baffle, and do therefore truly represent the speaker's performance. Other manufacturers also present frequency response curves of their speakers and, if they are also taken in anechoic chambers, they can be fairly compared with the curves of Fig. 1001, provided the mounting or enclosure of the speaker has not been designed to remedy short comings in the speaker unit itself. It would, of course, be quite fair to have the speaker unit so mounted, but it should be clearly understood that the unit must also be mounted in an exactly similar enclosure in the final listening room if the results predicted by the response curve are to be obtained. Any other form of mounting or enclosure will render the data useless.
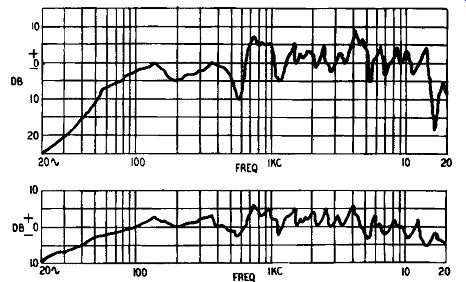
Fig. 1001. Frequency response curves of a speaker with 4 volts input
(upper curve) and with 1 volt input (lower curve).
These complications, if they may be called such, although they are obviously just applied common sense, are not generally appreciated by a nontechnical user. It is because of this that manufacturers of high-grade speakers are hesitant about publishing response curves of any sort. They can be so easily misunderstood.
The writer publishes the lower curve and does not hesitate to do so because it looks good. If he didn't publish any other he would not have offended against a code of business ethics, because the curve is a true statement of fact-so far as it goes. It is the truth, but not the whole truth; yet it is nothing but the truth.
But Fig. 1001 is actually a reprint of a figure that has gone into his actual sales literature, and the 4-volt curve was shown, too, in an attempt to tell the whole truth about what his speaker does with varying inputs. Some know-alls at once said that obviously the speaker can't stand high inputs, but what really matters is the question whether it is any worse on high inputs than other speakers. Research and development work over the past year or so have proved that it is not, but the reason for the disparity has been discovered and proves to be very interesting.
Before dealing with this, however, the matter of polar curves can be disposed of. Fig. 1002 shows polar curves for the 215 speaker, derived from measurements taken in the same anechoic chamber and with the speaker mounted in the same nonresonant box baffie. They depict a plane section of the front hemisphere of projected sound output. But since the curves have been staggered to avoid a continual criss-cross, which would only add con fusion to the picture, they should not be taken as absolute with respect to each other. The 8,000-cycle curve is true to scale and conforms to the axial frequency response of Fig. 1001. The circular co-ordinates read from 0° to 180° clockwise, so the goo ordinate is the horizontal axis of Fig. 1001. Reference to that figure shows where the goo points of 2,000, 4,000, 13,000 and 20,000 cycles should cut the axial ordinate.
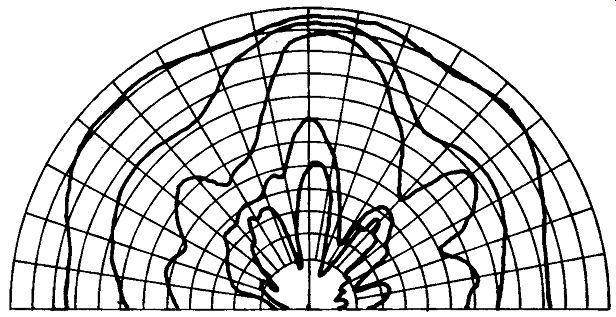
Fig. 1002. Polar response curves. The normally overlapping curves have
been separated. From the outer curve toward the center, the curves represent
the response at 2, 4, 8, 13 and 20 khz. Radial ordinates at 10° intervals;
circular ordinates at 5 db intervals. The 8 khz curve is in its proper
position and the relative displacements of the other curves can be obtained
from the lower curve of Fig. 1001.
The useful information given by Fig. 1002 is that at 2,000 cycles the speaker propagates sound almost equally in all directions.
Although the diagram is only a section of the hemisphere, because the speaker is circular, any section on the axis would give the same results. (In practice, room reflections would cause variations, but these curves were taken in an anechoic chamber to give a picture of what the speaker does under ideal conditions.) At 2,000 cycles the variation in output at any point in front of the speaker is within +5 db. At 4,000 cycles the variation is within + 12 db and at 8,000 it is within ±16 db. At 13,000 cycles it is within + 17 db and at 20,000 within + 13 db. As might be expected, the response at the highest frequencies falls off rapidly at 90° off the axis. Many speakers are far more directional, which means, in polar-diagram terms, that the curves will have a pear-shaped bunching centered on the axis and with a spread of about 20° on either side. As a matter of simple personal convenience one does not expect to have to locate a group of music listeners in a narrow funnel in the listening room, so it seems essential, for more spatial listening, to demand polar curves and see that they do spread out in some way suggestive of Fig. 1002.
Distortion arising from cone deformation
Figs. 1001 and 1002 give the actual sound output of the speaker as detected by the microphone and measured by the gear attached to the microphone. The microphone detects the sound-the total sound-whether it is distorted or not. Consequently the curves just discussed do not reveal the presence of distortion. It is clear from Fig. 1001 that the speaker illustrated does something when the input is increased which results in a wider variation of response at 4 watts compared with that at 1 watt. Why? The Hartley 215 speaker, whatever its faults, does have an extremely free suspension and can reproduce very low bass without bass resonances cropping up to cause that not unusual one-note thump (and to overcome which the bass-reflex cabinet has become so widely used). Moreover, special steps have been taken to insure that other forms of distortion, such as treble-modulated bass, do not creep in. It can be assumed that the distortion suggested by Fig. 1001 does not arise through faults in the suspension system (and this is proved by the smoothness of both curves below 100 cycles). Therefore, it must come from the cone-coil assembly. Again, in this speaker very great care has been taken to avoid distortion arising through a weak coil assembly or a weak joint between the coil and the cone, as has been done by the designers of all high-grade speakers. A weak coil-cone joint usually gives a well marked peak between 2,000 and 4,000 cycles (usually at 3,000). This well-known fact is turned to good use in producing cheap speakers for cheap radios which have no real top; the peak at 3,000 gives a synthetic brightness to the reproduction. The sole remaining component that can introduce distortion is the cone itself.
Fig. 1003 shows three ways in which the cone can be deformed to give distortion and generate spurious sounds. Assume the cone has a free suspension, which means that the periphery of the cone is not restricted by the conventional molded corrugated paper surround. Make up a simple straight-sided cone out of drawing paper. If the mouth of the cone is laid on a flat table and pres sure applied to the apex, the cone will be found to be very strong.
Squeeze the cone across a diameter of the front opening and it will be very weak. Bend the outer edge between the fingers of two hands and it will again be found to have no strength. Holding the apex in one hand, bend the edge of the cone toward the apex with the other hand, and once more it will be found that the cone is weak. In fact the only condition in which the cone has strength is when the outer edge is resting on the table; that is the condition of perfect loading, when the cone is resisted, as it were, by the counter pressure of the table.
When a speaker is working, the only loading on the cone is that afforded by the air, but as air is an elastic substance the loading is not perfect. The loading, or damping as it is usually called, should be as great as possible (hence a good speaker has a good damping factor) not only to reduce deformation as much as possible but also to return to normalcy as quickly as possible any deformation that may occur. Since the damping is not perfect, deformation will occur, and it can occur in three different ways (Fig. 1003). A straight-sided cone will take up shapes as indicated in Figs. 1003-a and b, where the rounded points inside and outside the normal circle are called nodes and those points on the circle antinodes. The number of nodes varies as the frequency of the applied signal.
If the speaker under examination, is driven by an audio oscillator driving an amplifier and viewed by fluorescent lighting, the nodes can be seen very easily. With fluorescent tubes a static picture of the cone can be seen at line frequency and at the second, third, fourth and so on harmonics of the line frequency. With ordinary tungsten lamps the nodes are seen as blur images, and no movement appears at the antinodes other than the back-and forward movement of the cone itself. The blur images of the nodes are superimposed in the blur image of the whole cone.
The stroboscopic effect of the fluorescent tube will be effective only at line frequencies or their harmonics; at other frequencies the blur image will appear. An exponential cone has a much flatter mouth than a straight-sided cone, and therefore is more rigid across a diameter. But it is weaker axially just because it is flatter. Nodes will therefore appear in an axial direction, as shown in Figs. 1003-c and -d. Finally, wave motion will travel along the cone from apex to mouth as shown in 1003-e.
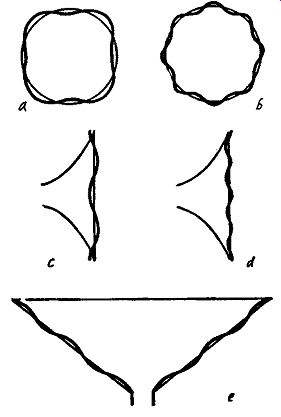
Fig. 1003. Types of cone deformation causing distortion: a, -b) typical
nodes formed in a straight-sided conical diaphragm; c, -d) exponential
diaphragms displaying axial nodes; e) wave motion along the surface of
the cone.
Loose vs. tight suspension
If the cone as finally located in the complete speaker is not free-edge, then there will be an unavoidable bass resonance, due to the limited movement possible. But the restraining of the back-and-forward motion is also accompanied by restraint of the noding found with a free-edge cone. It would seem, therefore, that tight suspension may be undesirable from the bass point of view but very desirable from the noding angle. Unfortunately things are not always what they seem, and the mere fact that the cone wants to node and cannot means that the energy thus suppressed at the edge of the cone must be dissipated somewhere else. It is dissipated by general cone breakup, but as each would be node involves a sector of the cone the breakup also occurs in sectors. Since the area of the sector is less than the whole, the spurious noise created by cone breakup will have higher frequencies than the noise produced by nodes.
Detailed analysis of speaker behavior cannot be given in the course of a single section. The argument can best be summarized by saying that the more irregular response curve of a speaker driven by a high input is due to cone breakup. This is not revealed as distortion by a measuring microphone, but by a more irregular curve resulting from the fundamental frequency sound output being converted into a harmonic series of outputs. Actually, the distortion can be seen on an oscilloscope if the output of a very high-grade microphone is connected to the vertical axis and the audio oscillator to the horizontal. If the oscilloscope is used as a monitor, the input to the speaker can be kept down to the level where no spurious harmonics appear in the sound out put. If the response curve of the speaker is taken simultaneously by the usual methods, the overall response may prove to be very disappointing.
Various procedures are often taken to strengthen the body of the cone. A common method is to mold a series of concentric corrugations along the whole cone surface. These unquestionably stiffen it diametrically but can do practically nothing to prevent wave motion of the type illustrated in Fig. 1003-e. There are grounds for believing, too, that suppression of the nodes by this means can result in complementary breakup between adjacent corrugations. Transverse wave motion can be counteracted by stiffeners running from apex to outer edge. It is worth pointing out that as long ago as 1924, long before the days of electrodynamic speakers, a British electromagnetic unit, the Celestion, had a 15-inch paper diaphragm on the front of which was cemented a bamboo spiral running from apex to outer edge, and on the back was a complete set of radial stiffeners, also of bamboo. The problem, therefore, was realized and an attempt made to solve it 34 years ago, because of the generally held belief that the perfect diaphragm must also be a perfect piston; that is, something that does not deform and does not produce spurious harmonics.
Power-handling capacity
There is a direct relationship between the diameter of the cone and its displacement at low frequencies. For a given input the larger the cone the smaller the displacement (Fig. 1004). Note that the curves marked with cone diameter refer to cones of that diameter and not to the overall diameter of the speaker, and also that the flux density in the magnet gap must be constant for all sizes. Obviously the higher the flux density the more sensitive the speaker and the greater the movement for a given input. In comparative measurements of this type only one variable can be considered, and the variable is the cone diameter. Roughly speaking, it will be seen from the chart that a 15-inch cone is displaced only half as much as a 10-inch cone at any frequency, but little is gained by increasing the cone diameter to 18 inches.
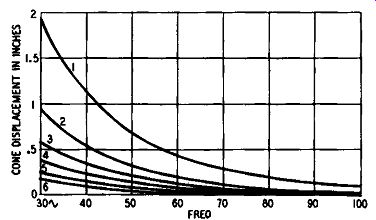
Fig. 1004. Comparative cone displacement (for fixed input) of paper
cones of various diameters: curve 1 for 5-inch, 2 for 8-inch, 3 for 10
inch, 4 for 12-inch, 5 for 15-inch and 6 for 18 inch cone. The curves
are valid only for inputs below the power-handling capacity of the speaker.
Although, therefore, it would seem desirable to make the cone as large as possible, for the sake of power-handling capacity at low frequencies without due displacement of the cone, there are serious disadvantages attending the use of a large cone. A large cone must obviously weigh more than a small one; it may weigh considerably more if the thickness of the cone material has to be increased to give the same rigidity as the smaller one. This will result in a loss of high-frequency propagation, but it will also spoil the attack of the speaker, its response to transients, since the inertia of the heavy cone opposes the ideal instantaneous movement necessary to reproduce a steep wave front. Conventionally the cure for lack of top in a large bass speaker is to use a tweeter and dividing network. The latter serves two useful functions diversion of high-frequency power from the woofer (which would otherwise be wasted) and diversion of low-frequency power from the tweeter to prevent electromechanical overload of the small diaphragm speaker. Recourse to a multi-channel speaker system and dividing network does not, however, remove the inertia of the woofer's heavy cone. That can be done only by reducing the weight of the cone. And, as paper is almost invariably used for speaker cones, it means reducing the thickness, reducing the rigidity and increasing breakup with large inputs.
Cone materials
Paper is used because it is cheap, easy to work and lends itself to mass production. It appears to have no other advantages that can be determined by laboratory investigation. Other materials, such as metal and bakelite, have been used from time to time, with varying degrees of success. Metal-cone speakers were introduced very many years ago by two British manufacturers and one still exists used as a doublet, with one unit working into the back of the other. Modern tweeters have small light aluminum cones, as do several horn-loaded speakers in the United States and Britain. But horn loading introduces a different set of working conditions. Electrostatic speakers invariably have aluminum diaphragms, either stretched-flat diaphragms or pleated sound emitters. The distinguishing characteristics of all metal-diaphragm speakers is the coloration, sometimes slight, inseparable from the use of metal (which property is exploited in the brass section of the orchestra). The only bakelite diaphragm speakers that appeared over a long period were the British Hartley-Turner speakers of pre-World War II days. Their manufacture was discontinued in that form because of the intractability of the material.
The one outstanding break from traditional cone material is found in the recently introduced Hartley-Luth 220 speaker, which has a cone of a highly specialized synthetic which has no natural ring, being almost inert acoustically. This material, details of which have not been divulged, has unusual physical properties.
It is stated to consist of a core of cellular material which is left in an un-impregnated condition so far as the air cells are concerned, but the bonding material is allowed to penetrate the fibers to form a hard lattice-work frame. On the outer surfaces a complete skin is formed of the very hard bonding material.
A section of the cone material somewhat resembles a lattice-work girder-two planes joined by a criss-cross of stiff struts. This form of girder is used in engineering structures to save weight without sacrificing stiffness, and the application of the principle to an acoustic diaphragm produces some interesting results. Cones made in this way are little heavier than paper of similar thickness but mechanically about four times stronger. To this extent they more nearly approach the ideal of a perfect piston, and the response does not vary with increased input (see Fig. 1001). The curves of Fig. 1004 do not apply since it is found that the rigidity of the cones results in greater resistance from the air. In other words, the air loading is higher and the output rises very considerably at low frequencies, due entirely to the absence of noding and cone breakup.
The Hartley 215 speaker was often criticized because of its seeming lack of bass. In part this was due to the absence of a noticeable bass resonance, but mainly due to the 9-inch diaphragm not moving enough air at the lowest frequencies. This objection could easily be overcome by using two units side by side, connected in simple series, thus increasing the diaphragm area by 100%. It is generally recognized that better bass is usually obtained by using several small speakers rather than one large one of equivalent diaphragm area. In the development stages of the Hartley-Luth 220 it was thought that a simple improvement might result from using two units to give still more bass, but actual experiment proved that the increase was barely noticeable. The un avoidable explanation could only be that the paper cone of the 215 did not act as a true rigid piston at low frequencies with large in puts and so lost some output, whereas the rigid cone of the 220 converted the electrical input into mechanical pressure on the air without loss. In specific terms, direct comparison between the 215 and the 220 revealed that for fixed input the much more rigid cone of the 220 extended the output downward by more than an octave.
This can be expressed in another way by saying that the output of the 220 at 25 cycles was somewhat greater than that of the 215 at 50 cycles, and the higher frequencies up to about 200 cycles were equally improved. The curves of Fig. 1004, therefore, which are derived from data originally compiled by Massa, apply only to paper cones. The 9-inch synthetic cone of the 220 has a greater bass output than a 15-inch paper cone, especially when driven hard.
The work involved in preparing this new type of speaker seems to prove beyond argument that the first requirement of a speaker cone is that it should not deform when actuated by the voice coil.
Visual appraisal of a speaker
An electrodynamic speaker can be fairly well appraised just by looking at it and feeling it. If the cone has a rather narrow angle, it will be directional and have a poor polar diagram: the flatter the cone the wider the dispersion of sound. If the cone gives when pushed in one place with a finger, as is almost inevitable with paper cones, then the cone will distort with high inputs, giving uneven response and introducing harmonics either from nodes or suppressed nodes. The molded surround is usually left thinner than the main cone body for the sake of greater flexibility. But, if the projecting corrugation feels harder than the two-inward pointing corrugations, then the hard corrugation will resonate independently of the main body of the cone at a frequency dependent on the size of the cone and the lack of stiffness of the inward corrugations. Examination of the cone and surround under a strobe light, with the speaker driven by an oscillator and amplifier, will reveal at which frequency this occurs.
The outer and inner surfaces of the cone can be grasped be tween the thumb and finger of both hands and the whole assembly moved backward and forward. Measurement of the total possible displacement, which, of course, is limited by the design of the outer surround and the spider washer, will permit estimating the power handling capacity by reference to Fig. 1004 if the cone is made of paper. It must be understood, however, that the Massa data only applies to the power-handling capacity of the speaker.
It reveals that for a given limit of excursion a speaker will handle more power as the cone size is increased, but the lower frequency limit is determined by the design of the suspension. If the bass resonant frequency of the speaker is, say, 50 cycles, then it will have a vastly increased output at that frequency and practically no output at a fundamental frequency below that. The output will consist mainly of third harmonic, a little second and no measurable fundamental. This is usually called frequency doubling, but it is more correct to call it frequency tripling. The Massa figures would therefore apply only to frequencies above 50 cycles for that particular design of suspension. If the cone is tapped with the finger tip, a sound will be heard resulting from the contact between the finger and the cone. But, with the ear in the cone, a low note will also be heard, and its frequency is the bass resonant frequency of the suspension system.
There are various ways of extending the seeming response of a single-unit speaker having a paper cone, such as adding a subsidiary cone, introducing compliances of one form or another to various parts of the cone or voice coil. These do what they are said to do, but whether the end product is entirely free from distortion is a matter of some doubt. Detailed discussion of these various devices goes beyond the scope of this section.
Speaker impedance The impedance of a speaker varies with frequency, as shown in Fig. 1005. The peak in the lower register occurs at the resonant frequency of the suspended system. Provided the cone and voice coil are moving freely, this peak is not unduly prominent and the curve is then said to represent the free impedance of the speaker.
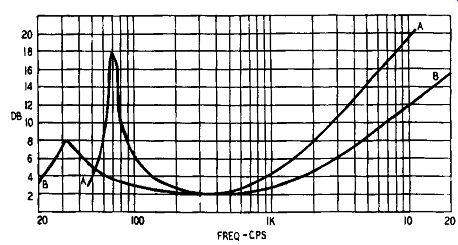
Fig. 1005. Impedance curves of dynamic speakers: AA) curve of a conventional
design with cone surround resonance at 70 hz; BB) curve of speaker with
free-edge cone.
Voice coil, cone compliance and rear suspension (spider washer) resonance of 32 hz.
If the vibrating system is prevented from moving, the resultant curve represents the blocked impedance of the speaker. At middle and high frequencies there is little difference between the blocked and free impedances, but at the resonant frequency the difference is considerable. Inadvertent blocking of the movement of the cone can be caused by tightness of the cone surround and the rear suspension washer or spider. The usual molded corrugations in the outer periphery of the cone do not give much freedom of movement and as a consequence the spider is often of a design that would give little freedom if the cone were free-edge. Adoption of a free-edge cone removes one source of blocked movement but this is not enough if the spider washer does not also give free movement of the suspended system.
Moving any speaker diaphragm by hand demonstrates that the farther the cone is moved from the mean position the harder it becomes to move until the point of maximum excursion is reached when it will not move at all. This increasing resistance is depicted by the peak in the impedance curve. The height of the peak is reduced by free suspension, although introducing free suspension also introduces a whole host of other difficulties, such as modulation of the treble by the bass, and the effect known as electro-mechanical rectification.
The rise in the treble is mainly due to the inductance of the voice coil and will naturally be greater with higher inductance. It is conventional to build speakers with a higher impedance rating than is necessary or desirable and, like many conventions, it is not based on what might be called absolute thinking. For the standard of reproduction demanded of inexpensive mass-produced equip ment it is convenient to be able to buy speakers of standardized impedances. But these standards were adopted long before the desire for high-fidelity reproduction became widespread. More or less automatically, low-fidelity standards were carried over into the high-fidelity speaker industry with, at least in the writer's opinion, unfortunate results.
The impedance curve of any speaker can be taken with the usual impedance-bridge technique and for comparison purposes speakers should be mounted on a standard flat and inflexible baffle in the open air. Sound reflections from the walls of a measuring room can cause blocking of the free movement of the cone.
However, there are simpler methods well within the capabilities of the worker not equipped with full laboratory facilities.
These are shown in Fig. 1006. In all cases an audio oscillator with a constant sinusoidal output is required. The first method shown requires an ac ammeter and ac voltmeter; these are connected as in Fig. 1006-a. As the input is varied from the lowest to the highest frequencies, note is taken of the current through the speaker and the voltage drop across it. Call these, respectively, I and E. The impedance Z is then equal to E/1. The readings can be taken at 10-cycle intervals from 10 to 100 cycles; then at 100 cycle intervals to 1,000 cycles, and finally at 1000-cycle intervals to 20,000 cycles. In particular, note carefully when E rises steeply at the bass resonant frequency and note the frequency. If there are other peaks, they should also be noted. The final result when plotted as a curve will not be exactly like Fig. 1005, which shows smoothed curves of trends, but will have a number of small peaks which represent resonances in various parts of the speaker, even of the cone basket.
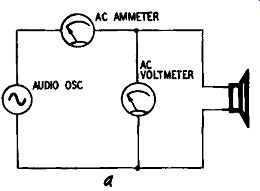
Fig. 1006-a. Determining speaker impedance by using an ammeter and voltmeter.
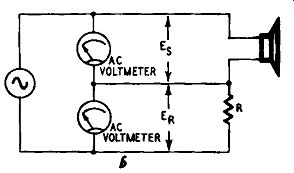
Fig. 1006-b. Speaker impedance can be measured with the use of two ac
voltmeters.
Ac ammeters are not always available, so two voltmeters can be used, as in Fig. 1006-b. The method is simply a comparison of voltage drops across two resistors. In the figure, resistor R should have the same de resistance as the speaker voice coil. If the meters are de units and de passes through the speaker and resistor R, the voltage drop will be the same across each. When ac is applied, the impedance of the pure resistance R is constant at all frequencies but the speaker has reactance so its impedance will vary with frequency. Apply various frequencies as indicated earlier and note the readings on the two meters. The impedance is then given by the formula
z. = R (E./E,)
These two methods have the disadvantage that meters have to be observed and a certain amount of simple calculating has to be done. The continuously visual method shown in Fig. 1006-c involves the use of an oscilloscope. Resistor R is, as before, a non inductive resistor having the same dc resistance as the speaker voice coil. Resistor R., shown dotted, is a precisely similar component but it is not in use all the time. To set up the circuit, connect R and R, as shown but omit the speaker. Isolate the oscilloscope circuit from the oscillator by a good-quality audio trans former. Apply a signal and adjust the oscilloscope amplifier's sensitivity controls until the trace is a straight line inclined at 45° to the two axes. (The internal time base of course, is not used.) Now take out R. and connect the speaker.
If and when the speaker acts as a pure resistance, the trace will be a straight line. Inductive and capacitive components in the speaker will cause the line to broaden into a narrow ellipse; the major axis of this ellipse is the indicator of what follows. As the frequency is varied so the impedance of the speaker varies and this causes a change in tilt of the trace. For any point on the trace ...
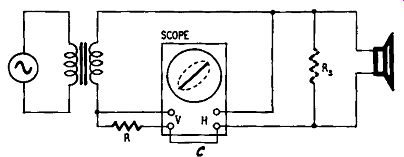
Fig. 1006-c. Technique for measuring speaker impedance using an oscilloscope.
... or the major axis of the trace, the respective magnitudes of the speaker impedance and the resistance of R will be indicated by the coordinates on the horizontal and vertical axes of the oscilloscope graticule. The method is very sensitive and placing the hand in front of the speaker is enough to show the change of impedance.
It is the most convenient way of observing the effect of different types of enclosures or modifications of enclosures as well as studying the effect of altering room furnishings and damping.
The impedance for which output transformer calculations are made is taken as that at 400 cycles. The impedance curve, as well as the frequency response curve, will vary with input because the air or mechanical loading of the speaker will change with change of input. Published equivalent circuits of a loudspeaker do not normally take account of this complication, so a mathematical examination of a speaker based on an equivalent circuit must be accepted with caution.
Since the impedance varies so widely with frequency, it will be obvious that the loading on the output stage is far from constant.
And if the output transformer has been designed on the basis of the nominal impedance of the speaker, mis-matching will be considerable at the bass end and also in the treble. It may, therefore, be desirable to select a transformer ratio which provides a mean value of load at bass, mid and high frequencies. This mismatching is not so important with triodes as with tetrodes or pentodes (which latter can be made more accommodating with negative feedback), but a transformer ratio correct for the impedance at 400 cycles, apart from causing distortion in the bass through over load, is the cause of what is usually known as "pentode quality" in the highs. It is not the pentode which causes distortion; it is simply that the harmonic distortion caused by incorrect loading is particularly noticeable at high frequencies.
The baffle and speaker impedance
The cure for these troubles is, of course, to use a speaker with as nearly level an impedance as possible; but as many popular speakers do not have this desirable property, various devices are...
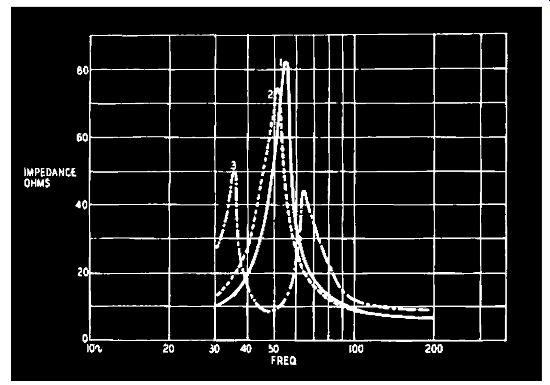
Fig. 1007. Effect of baffles on speaker impedance: 1) 12-inch speaker
in free air; 2) mounted on a flat baffle; 3) in a ported enclosure.
... adopted to overcome the speaker's defects. With a view to neutralizing the bass resonance, an acoustical phase inverter, popularly known as a bass-reflex cabinet, is widely used. This device was first described by A. L. Thuras in U. S. patent 1869178, (1932), and became generally available when the patent expired. It is generally assumed that it will improve the bass response and increase the power-handling capacity of the speaker, increase the acoustical damping at low frequencies and decrease the impedance at the bass resonant frequency while reducing the amplitude of the cone movement at that frequency. These claims may generally be accepted in. an engineering sense, but many listeners of good musical education are convinced that the final effect is that of a strongly resonating system. Certainly the housing itself is a resonator for it is designed to resonate at a frequency determined by the characteristics of the speaker, but it is a matter of esthetics to decide whether the final results are free from distortion. (See Fig. 1007.)
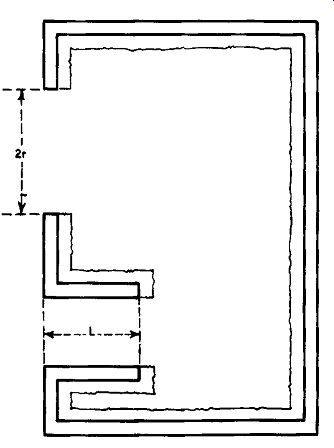
Fig. 1008. Cross-section of a typical bass-reflex enclosure. The jagged
line represents the acoustic lining material.
Fig. 1008 gives a cross-section of a typical bass-reflex housing which must be constructed in a rigid manner and lined with sound-absorbing material to cut down internal reflections. The upper opening will be circular with a diameter equal to that of the speaker cone; the port or vent below must have an area equal to the area of the speaker opening. The volume of the housing assumes no absorbent lining, but the volume of the speaker itself must be allowed for. For what it is worth, the expression for the volume of the cabinet in cubic inches is:
1rr2 ( 1.84 X 10s X I + l ) w2 I.7r + l
... were r is the radius of the speaker cone in inches; l, the length of tunnel in inches; w = 2 pi X frequency of vent resonance.
Fig. 1009 gives the external dimensions of a typical bass-reflex enclosure.
Summary of design features for baffle-loaded speakers
1. A single speaker capable of reproducing the frequency range needed for high-fidelity reproduction is possible but requires great skill to design.
2. A complex wave is reproduced by a single diaphragm because of cone breakup. For best results this breakup must be carefully controlled. The apex of the cone reproduces the highs; the entire cone moves as a piston to reproduce the bass.
3. The harder the cone material, the better the treble and bass response-but this interferes with cone breakup. Concentric ridges in the cone do not appear to affect the breakup, and improve the bass response by stiffening the cone radially and so counteract the development of nodes.
4. Large cones node radially more easily than do small ones; exponential cones node axially. Nodes reduce output at the frequencies where they occur and introduce undesirable harmonics.
5. The cone material should be acoustically inert. Metal diaphragms produce a characteristic ringing coloration.
6. Narrow-angle cones cause excessive focusing of the high frequencies, wide-angle cones give better diffusion but tend to node more easily.
7. Large cones are too massive for good treble response and transient reproduction. Their size can cause phase distortion of the low-frequency components of a heavy transient.
8. Small cones cannot reproduce low frequencies with sufficient output unless the suspension is free enough to enable them to move the same amount of air as a large one.
9. Subsidiary tweeter cones give more treble, but the undamped outer rim can cause feathery reproduction if driven hard. The narrow angle of the tweeter cone also causes excessive focusing of the highs.
10. Large straight-sided cones cause the enclosed air to resonate at its own natural frequency, causing a superimposed hoot. Exponential and small cones do not suffer audibly from this defect.
11. Treble response can be improved by specially designed voice coils, where the diaphragm is relieved of the weight of the coil at high frequencies.
12. The voice coil should be as light and as rigid as possible, with only two layers of wire. The wire should be double-silk-insulated to provide a good key for the varnish. A 1-inch coil is more rigid than a 2-inch but a 2-inch pole piece allows for a greater flux density in the gap.
13. A tight suspension gives a high bass-resonant frequency, and frequencies below this will be reproduced mainly as third harmonic. Free suspension can introduce intermodulation distortion and nonlinear distortion.
14. To avoid intermodulation distortion the voice coil must cut constant flux at all points in its excursion. The coil must be substantially longer than the gap.
15. To avoid nonlinear suspension distortion the magnetic field must be symmetrical about the gap. If the center pole is shouldered, a flat front magnet plate cannot give a symmetrical field.
Dividing networks
Except in highly specialized designs such as the author's own speakers, it is not possible to achieve a wide frequency response without major irregularities in a single-speaker unit. The design of a speaker to give a good output at low frequencies is a flat contradiction of that required for high frequencies and most single units are a compromise design between these two extremes.
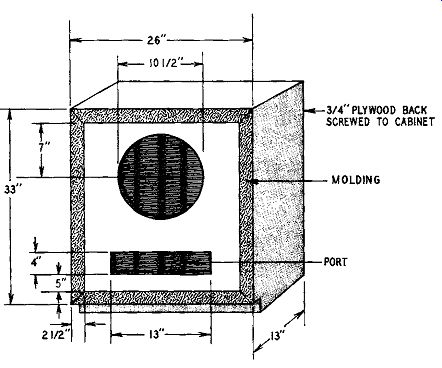
Fig. 1009. External view of a typical bass-reflex enclosure.
There is no fundamental difference between the design of a dynamic tweeter and a woofer: one has a small very light diaphragm; the other a large, reasonably inflexible one which cannot reproduce satisfactorily above about 3,000 cycles. The power handling capacity of a speaker for low frequencies is a function of the size of the diaphragm (since adequate bass reproduction can be obtained only if enough air is physically moved) so the small cone of a tweeter makes such a speaker have no power-handling capabilities below about 300 cycles. Using woofer-tweeter combinations means, therefore, that the bass must be kept out of the tweeter and the treble kept out of the woofer. This is done by using suitable high- and low-pass filters.
Combinations of such filters are called dividing or crossover networks. The former term is the better one since the purpose of the network is to divide the output of the amplifier into two parts, the treble end and the bass end. The middle frequencies are re produced by the top part of the response of the low-pass filter, the bottom part of the response of the high-pass filter and a non-uniform portion of the combined responses centered on the crossover frequency, as shown by the solid curves in Fig. 1010. Experience has shown that the most satisfactory results are obtained with an attenuation of 12 db an octave beyond where attenuation begins, in spite of the fact that there is a definite dip in the response of the network at the crossover frequency. It might be thought that if the two filters had sharp cutoffs, as shown by the broken curves, the greater uniformity would be an advantage, but to get such an abrupt attenuation calls for filters having many stages. A more serious disadvantage is that a sudden switch from woofer to tweeter, as would happen with filters of such characteristics, is audibly distressing.
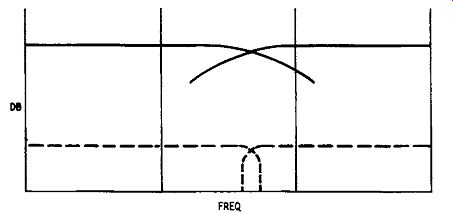
Fig. 1010. Response curve of a typical dividing network.
The two speakers cannot have precisely the same characteristics.
If, as in the case of wide-range reproduction, two speakers of differing characteristics have to be used, it is better that the merging from one into the other be done gradually; but it must not be done too gradually, otherwise the filtering of each channel will not be sufficiently effective.
Single-stage resistance-capacitance filters, as mentioned in an earlier section, give an attenuation of 6 db per octave; but dividing networks for loudspeakers usually require a steeper slope than this, so inductors are used instead of resistors. Such L/C filters give slopes of 12 db and 18 db per octave respectively for half section and full section types. The points at which attenuation begins will obviously be farther apart with 12 db filters than with 18 db if a constant level at crossover frequency is to be observed. In practice, it is found that the dip at crossover frequency will be about 3.5 db. Fig. 1011 gives the circuits of dividing networks of both series and parallel types.
Constant-resistance network
Another type of dividing network, details of which are given in Fig. 1012, is the so-called constant-resistance network. It will be
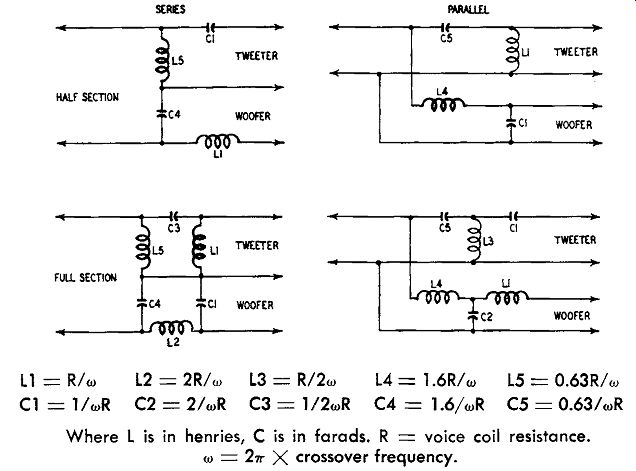
Fig. 1011. Dividing network circuits (series and parallel types). -----
Where L is in henries, C is in farads. R = voice coil resistance.
w = 2 pi X crossover frequency.
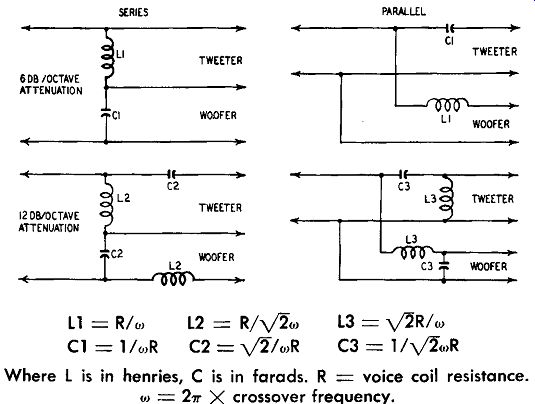
Fig. 1012. Constant-resistance dividing networks (series and parallel
types). ---- Where L is in henries, C is in farads. R = voice coil resistance.
w = 2 pi X crossover frequency.
understood that the load on the output stage should be constant for all frequencies and we know that the impedance of a single unit speaker varies considerably with frequency. Adoption of a constant-resistance network does not mean that circuit gymnastics have produced a two-way speaker system which presents a constant impedance at all frequencies, for the constant-resistance network has a constant input resistance only for purely resistive loads on the output terminals of the network. The problem of speaker impedance varying with frequency remains as before.
The advantage of the constant-resistance network is that the capacitors and inductors can have more convenient values through out, as can the inductors. This simplifies design and manufacture and accounts for the commercial popularity of this type of network.
Horn-loaded speakers
Horn-loaded speakers are a different technical proposition; the prime object of fitting a horn to a speaker unit is to increase its electroacoustic efficiency. A horn speaker does not perform fundamentally better or worse than a baffle-loaded speaker, it is merely more efficient. But to secure adequate bass reproduction calls for as inconveniently bulky a horn as with baffle speakers. To repro duce a 50-cycle note with negligible loss calls for a baffle 12 feet square or a horn 22 feet long with a flare circumference of 24 feet.
Neither of these is conveniently accommodated in an ordinary living room so designers have had recourse to folding horns to make them more compact. A horn, folded or straight, must follow certain laws, otherwise the advantages of horn loading are lost.
Some cabinet type folded horns are virtually acoustical labyrinths and may have undesirable acoustic effects on the reproduction.
Provided the length of the horn can be accommodated in the auditorium (and in an exponential horn the first few feet are related to the high-frequency part of the spectrum), there is no point in having multiple-unit reproducers. But since the problem is al ways that of squeezing the unit into a reasonable space, the horn assembly can be divided into a straight tweeter and a folded woofer, with each section driven by an appropriate speaker unit. In any event, a horn-loaded speaker is very directional at high frequencies (indeed is very much more directional than a direct radiator or baffle-loaded speaker). As it is desirable to separate the highs, a multicellular tweeter horn or acoustic-lens diffuser can be used to advantage.
The limitation of a horn speaker in the bass is the flare cutoff frequency, and it is important that this should be higher than the natural resonant frequency of the speaker unit; indeed it is important that the amplifier itself should have a bass cutoff equal to the flare cutoff, otherwise there will be an appreciable tendency for the speaker to develop harmonics of the frequencies the horn can not reproduce. If low frequencies are desired and a large horn is not, the solution appears to be that of P. W. Klipsch, who has developed a design wherein an air chamber behind the speaker unit, resonating at about the flare cutoff frequency, provides a "capacitive" reactance about equal to the "inductive" reactance of the horn at cutoff frequency. In this case frequencies lower than that of the flare cutoff frequency can be reproduced without appreciable distortion because this chamber takes control.
For a straight horn the cross-section can be circular or square; the flare must increase according to the exponential law selected and sudden changes of curvature are detrimental. For a folded horn the same rule holds, so for best results the horn cannot be built up out of flat pieces of material; yet it nearly always is. The cabinet type of folded horn is, therefore, some way short of a perfect horn even if the increase of cross-section area is carefully maintained (which it must be). As any speaker is already a far from-perfect transducer, the purist may consider it undesirable to introduce further distortion through using an imperfect horn and may prefer to generate more audio watts in the amplifier to make up for the lower efficiency of the direct radiator. A "folded" baffle does not require the same precision of design as a folded horn.