This installment of articles about the science of imaging addresses the color system, the CIE Diagram, gray scale, and the need for display device calibration.
In looking at the topics we’ve covered so far, you’ve probably noticed that a lot of the material is interrelated. Proper setup of the Brightness or Black Level is dependent on the environment of the display device, the environment needs to be set up to match the color of gray on the set, etc. In each section we’re picking up topics that were mentioned in earlier installments, then covering the topics in detail. Over the entire series of articles we hope to connect all of the dots. In the meantime we’ll be playing catch up with a number of subjects mentioned earlier. This time, among other things, we’ll be covering the color of gray that was mentioned in the section on “Ideal Viewing Environment.” We discussed the need to match the color of gray in the environment with the correct color of gray on the viewing device. What is the correct color of gray for the viewing device?
There are many colors of gray. Picking the right one for our television system is important to the system’s ability to convey the best possible color fidelity. Picking the right color of red, green, and blue is equally important. We’ll open with a little history of red, green, and blue in our system, then connect that with the color of gray.
Our NTSC system for color television was established in late 1953. As it was set out on paper, it was a theoretical, all electronic system based on a solid science assembled by the Commission International de L’Eclairage, CIE, the International Commission on Illumination, in 1931.
The 1931 CIE diagram quantifies light, providing a means for defining it in mathematical terms, related to the way we see it. It’s a graph of the human factors of vision.
The diagram has three dimensions. The z axis is used to specify the intensity of light. The outline section shown here and the full color version of the CIE diagram represent a cross section from the middle of the z axis. As light output increases or decreases, the diagram narrows to the area of the center of the Black Body curve.
Color of Light
Color of light is defined in terms of x and y values on the diagram. Using this system, there are many specific colors of light within a general area of that color. The specific colors are defined by x and y values. The color red, as an example covers a rather large area of the diagram. Specific colors of red would have their own x and y values.

---Outline Of The 1931 CIE Diagram

---The CIE In 3D
The bell shape of the curve in the x, y plot represents an approximation of the human sensitivity to colors of light as it was known in 1931. The latest version of this diagram came about in 1976. That version is being used for determining the best color characteristics for the coming HDTV system(s). There are conversion tables that go back and forth between the two. Even though the 1976 diagram is more accurate, we’ll be sticking with the 1931 system because that was what was used for our television system. The newer system gives us better resolution, which isn’t necessary for such an old color system.
Back to the 1931 diagram, looking in the direction of the y axis, we note that we are least sensitive to blue, most sensi tive to yellow-green, and less sensitive to red. The numbers around the outside of the curve represent the wavelength of light in nanometers (.000000001 meters). The line between blue and red represents colors obtained by mixing red and blue light. There are no wavelength numbers associated with these colors because they are complex waveforms resulting from the addition of two colors of light. The colors you see along the outside of the bell shaped curve, that have wave lengths associated with them, are all displayed in a rainbow. Frequencies or wavelengths at the opposite end of the light spectrum don’t combine when spread out by a prism, only adjacent wavelengths mix to form the colors displayed. The colors along the bottom axis of the bell shaped curve, the direct connection between blue and red, are not found in a rainbow.
Colors of White
There is a line, and area around that line, inside the CIE diagram that defines the many colors we humans identify as white. They are identified in terms of color temperature. Traditional stage lighting, as an example, is somewhere between 2800° and 3200° Kelvin. Sunlight is in the area of 5400°K and overcast daylight is in the order of 6500°K. These are all different colors of white. If you were to look at a piece of white paper in any of these colors of light, it would be recognized as white, even though its color has changed a great deal. We, as human beings, are adaptable in our perception of color.
What’s the connection in identifying colors of white with temperature? If an ideal object is heated to a particular temperature, indicated in degrees Kelvin, it will emit a particular “color” of white light. The complete range of colors. of white forms the Black Body Curve on the CIE diagram. Lights that are said to be “white” range in color from 2800°K, the color of a 60 watt light bulb, to 10,000°K, a blue-white light from some outdoor, high intensity, lamps. Conversely, the temperature of a flame in a gas welding system is determined by observing the color of the flame. An orange flame is used to weld where a blue flame is used to cut.
In an electronic display system, the choice of color of gray might seem unimportant at first, especially considering how adaptive human beings are to different colors of white. As much as we are adaptive, there is still a difference. Color fidelity, as an example will improve when an object is lit by sunlight as opposed to stage lighting. If the purpose of an electronic delivery system is to communicate information en mass, then a single color of gray must be chosen as the foundation of that system. Every display device connected to that system must conform to the standard in obtaining accurate communication.
Our black and white system was set out in 1939. Implementation was delayed by World War II, with stations getting on the air in large cities as early as 1946. By 1950 there were dreams of adding color to the black and white system.
Early Ideas on Bringing Color to Black and White
In implementing any new system there is often a concern for cost to the consumer. In the early 50s, the inexpensive approach to color television took the form of a mechanical filter wheel placed in front of an existing black and white TV set. In the signal transmission, a sequential red, green, and then blue signal would be sent by the TV station. It would take 3/6oths of a second, three video fields, to complete a color picture.
At home, the rotating color filter wheel would be synchronized so that a red color filter would be in front of the TV picture when the red field was transmitted, green filter during green, and blue filter during blue. In order to watch broadcasts that were transmitted in color, all sets would require this filter wheel to be spinning in front of the set. The sequential color signal was not capable of providing a usable black and white picture during color transmissions. There was also a high probability of motion problems where 20 complete color pictures per second was not fast enough to keep up with a potential of 60 changes in motion per second.
The system did have a significant potential for high quality saturated colors. With new types of black and white picture tubes, it could do justice to reproducing all surface colors. It was so good at displaying color still frames that it was implemented as a color negative analyzer by Eastman Kodak. It was still in use at many photo processing labs as late as 1980. While the idea seemed to go on hiatus when Eastman Kodak stopped using it, it has returned in the form of Light Valve based electronic image projection, be it Texas Instruments’ Digital Micromirror Device, the Hughes-JVC Image Light Amplifier, or what have you. This new implementation of an old concept deviates from the original color television broadcast system in that all three primary color signals can be displayed in the time of one video field, It can now keep up with any motion in the video.
The mechanical solution didn’t sit well with a number of people. Challenging the true compatibility with black and white and added motion problems, NBC managed to overturn the 1952 FCC approval of the mechanical system. The argument of the filter wheels being inexpensive was not enough to sustain the mechanical system.
An all-electronic system was proposed. In the short term, it would cost the con sumer a great deal more to implement, but had a far better potential of dealing with improvements in technology for many years to come. Accepted as the NTSC system standard in late 1953, this theoretical, all-electronic system was based on a lot of solid science done by the CIE in 1931. Theoretical is a key word here; as of the time of its acceptance it was a paper system, put together by mathematicians. It was only after its acceptance that a significant engineering effort got underway to make it work.
There were goals set out for color quality in our NTSC system that have yet to be implemented. The system was supposed to be able to convey all surface colors to the viewer.
What are surface colors and why were they the defining limits of color? In our universe there are two types of colors, light and surface; incident and reflected colors. Surfaces show up when light strikes an object. Usable visual information, except type of color, is available to human beings only after light strikes a surface. In putting together a visual replication system, a display device, it’s only necessary to consider reproducing surface colors. Little usable information is contained in incident light alone.
You may remember from art or science classes that the primary colors of light are red, green, and blue. Primary surface colors or pigments are the exact opposite of the color of light. They are cyan, magenta, and yellow. If you spend much time reading about color film restoration you’ll come across a company by the name of YCM. That stands for Yellow, Cyan, and Magenta. Color film is archived as three strips of black and white film containing the YCM information. The print industry adds a fourth “color” to pigments. It’s black and white and has the symbol “K.” They also reorder the colors to CMYK.

--- CIE Diagram With Black Body Curve

--- CIE Diagram With HD Color Points And D (Lines From D To RGB)
The color you see from a surface is the color of light from the source that the surface doesn’t absorb. Surfaces have a much narrower area of color saturation because they absorb light, and therefore can not be as intense as light.
Colors of red, green, and blue for the theoretic video system were chosen based on inclusion of all surface colors. While all three colors existed in 1953, there was no comprehension of how difficult it would be to make them work together in a picture tube. We still aren’t able to do it forty-four years later.
In our electronic system, we are going to start by defining gray and the color of gray. In the video signal world, grey is defined as equal amounts of red, green, and blue. Gray exists from just above black all the way to white. Gray doesn’t exist at black because black in a visual display is defined as an absence of light. You can’t have color until there is light. At the other end of the gray scale, white is the 100 percent point of gray, the highest level of gray. The terms “color of gray” and “color of white” are used inter changeably as white is just the peak level of gray.
Once the equal voltage levels in the RGB video domain are delivered to the display device, it must present them as a color. The color displayed will depend on the bias and drive adjustments of the individual red, green, and blue light sources.
Why is the color of gray so important in a color picture?
The luminance (black and white) portion of a video signal contains the majority of picture information both in intensity and detail. Low resolution color information is added to the higher resolution black and white picture in the process of presenting a color picture. Luminance picture information is displayed on a color set in the “color” of the gray scale. Varying degrees of color saturation in a picture are obtained by moving away from the color of gray toward any particular color, as viewed on the CIE diagram.
This higher resolution luminance and low resolution color system is similar to a paint by the numbers system where the color fills in the black and white borders. Keep in mind also that the majority of picture information in video has little color saturation.
Looking at points along the Black Body Curve in the CIE diagram, you should be able to see that the ability to properly perceive desaturated colors is determined by the point of origin of the gray. If the color of gray is about 9300° Kelvin, a color used for gray in some consumer sets, the entire picture will be tinted blue. In photographic terms, it will have a cool look. The color of gray used in consumer sets significantly restricts color fidelity and alters the intended display color of the incoming signal. Perceived color differences from scene to scene in consumer display devices often don’t exist in the video signal. It is the blue color of gray, that makes a “warm” scene, such as a cozy fireside, look wrong.
In many sets, the color of gray is not consistent from black to white. Some manufacturers deliberately set the color of gray at the dark end of the scale to about 7000°K and the light end of the scale to about 9300°K. This makes the influencing background color different, dependent upon the luminance intensity of the scene content. The lighter areas of the picture will tend to be colder, in photo graphic terms, than the dark areas of the picture. Black and white information may look slightly colored, as opposed to tinted, which would occur if the gray scale were fixed and uniform from black to white.
The production standard for the color of gray is 6500° Kelvin in the majority of the world’s TV systems. It is the proposed color of gray for most of the competing HDTV systems.
A lower color temperature of 5500° Kelvin has been suggested in some circles for HDTV to make it compatible with the film and print industry.
The luminance (B&W) portion of a video signal Contains the majority of picture information both in intensity and detail. Low resolution color information is added to the higher resolution black and white picture in the process of presenting a color picture.
Component and Composite Video
In the early days of black and white television, the camera at the studio had a single tube. It translated the entire spectrum of light into a 0.715 volt peak-to-peak video signal or 100 IRE units. Synchronization signals were added to form a 1.0 volt peak-to-peak signal of 140 IRE.
In the original black and white American TV system, absolute black level in a video signal was 0 volts DC. Some 0.285 volts, or 40 IRE, (units of video defined by the Institute of Radio Engineers, 140 IRE = 1 volt, 100 IRE above 0 volts, 40 IRE below 0 volts) of the total 1 volt video signal exists below that black level (now known as blanking level). The -40 IRE will completely shut off the electron beam during the horizontal and vertical retrace intervals. When color came to NTSC, the level of picture black was raised to +7.5 IRE. The higher level of black was necessary because early black and white transmitters couldn’t handle a color signal with black level at 0 volts. The NTSC system still places black level at +7.5 IRE. Japan abandoned the +7.5 IRE of NTSC in 1990. It appears as if we won’t follow until converting to a new video system.
When we move to the high definition world, there is a possibility that these levels will change slightly. Synchronization signals will be 0.3 volts and active video will be 0.7 volts. Future TV sets will have to have individual memories for each type of input as do current generations of most data and graphics grade projectors.
Back to basics. The color camera starts with three video signals, one each for red, green, and blue. Each is capable of producing 100 IRE units of active video. The video bandwidth of today’s cameras can be in the order of 6 to 8 MHz for each channel. There are proposals to go as high as 12 MHz for film to tape mastering systems.
The first task facing the NTSC system design team was, how do you cram these three channels of information into the space of one? Keep in mind that you’ll need all three back to obtain a color display. It is also necessary that this composite signal be able to provide a black and white signal out of these three color signals for compatibility with the original black and white system. How do we get 100 IRE of black and white from three channels of signals, each containing as much as 100 IRE of signal?
As a historical note, some early color cameras used four pickup tubes. The fourth produced the luminance channel needed for the NTSC color signal, because for its time, it produced better results than trying to encode the R, G, and B signals into black and white information.
In deriving a luminance signal, one could directly add R, G, and B. That would result in a single signal, but with a potential amplitude of 300 IRE. That won’t fly with the NTSC system limitation of 100 units. Some sort of amplitude reduction is obviously necessary. Taking one third of each signal is not the right answer. In deciding how and where amplitude reduction should take place, each color’s contribution to the way we see luminance information is taken into consideration.
It turns out that, because of the luminance response of our eyes, green, being in the middle of the visible spectrum, is more important than red and blue to our perception of visual information. Red is on the low end of the spectrum (long wave lengths), and blue is on the high end. We are actually most sensitive to yellow-green, part of the reason green phosphors were never actually green, even in the original idealistic days of the NTSC system. Since we are most sensitive to yellow-green, known as green when discussing most any color video system, green information from the camera should be given priority in creating the black and white signal. Following that logic, red is second in priority, and blue is last.
Again, the luminance portion of the signal should be made up of a lot of green, a little less red, and a small amount of blue. The study of light by the CIE had established the exact proportions many years earlier. Getting that part of NTSC right was a matter of incorporating work that had already been done.
In expressing luminance information, the letter Y is used in mathematical equations. The expression for the derived black and white signal is: Y = 0.3R + 0.59G + DuB.
That formula is used for all of the composite television systems. It is one of the few things our system shares with the European PAL and SECAM systems. If R, G, and B are all 100 IRE at the source, the final luminance channel will be 100 IRE in level.

--- Color Camera Head to NTSC Output
We now have a black and white signal, Y. That gets us compatibility with the black and white system of the day What about a color TV? It needs to know how much red, how much green, and how much blue to produce at any given instant. Since Y is a single signal, there is no way to figure out the size of its original parts without additional information.
So far we have one equation, Y = 0.3R + 0.59G + 0.11 B. When we have to eventually decode the signal we’ll have to solve for three unknowns, red, green, and blue. Does that ring a bell from high school algebra? We need two more equations that contain information about R, G, and B. In video they are called the color difference signals. In math, they would be stated as A=R-Y and C=B-Y, where A and C are voltage values at any given instant in time, just as Y is a voltage value at any give instant in time. If you add A to Y you’ve got R. If you add C to Y you’ve got B. Now that you know the values of R and B, and the instantaneous value of Y is always known, you can plug real numbers for R and B back into the Y equation and calculate the value of G. The NTSC to RGB decoder solves three equations for three unknowns every instant you are watching television.
We aren’t finished encoding the signal just yet. We still have three signals, not the three we started with— R, and B—but three signals nonetheless. We know that the band width of Y will fill the entire spectrum available for the video signal. What do A = R - Y and C = B - Y look like? Their bandwidth isn’t much less than the bandwidth of R, G, and B. Where are they going to fit if Y already occupies all of the allocated space?
More science from the CIE. If a reasonable amount of luminance band width is present, we can get away with presenting less color information in the composite signal. Because blue isn’t as important as red, we can get away with even less B - Y bandwidth than R - Y. In an effort to squeeze these two signals in with the black and white, their band width has to be reduced; down to 1.3 MHz for R-Y and 0.5 MHz for B-Y.
Now that we’ve reached the limit of bandwidth reduction, we still have several problems. Add the two band widths together and we are taking up a lot of spectrum space in the video, not to mention the fact that the total possible excursion in amplitude for B-Y could possibly be as high as 178 IRE units (89 units above and below the 0 IRE level) and R-Y could reach 140 IRE (70 units above and below the 0 IRE level). If we can reduce their bandwidth, can we also reduce their amplitude? Have we got a choice?
The transformed R-Y signal becomes “I” and the transformed B-V signal becomes 0” where 1=0.877 (R-Y), 0 = 0.493 (B-Y). We still have a placement and bandwidth problem. The solution is to modulate each of the two signals on their own carrier frequency and add them into the black and white.
Why is a carrier needed?
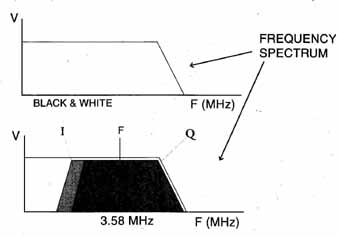
The bandwidth of the I and Q signals exists from a very low frequency up to 1.3 MHz and 0.5 MHz respectively. The space available for these signals is from somewhere above 2 MHz to 4.2 MHz. That initially came from the fact that black and white TV cameras of 1953 couldn’t generate information much above 2.8 MHz. The upper end of the transmitted video spectrum is 4.2 MHz.
If I and Q were modulated onto a carrier, say at 3.579545 MHz, which is in between those two frequencies, I and Q would occupy a space not being used by the luminance information in 1953. In putting such a system together it is also necessary to consider the fact that in the future a camera will be able to generate luminance signals occupying that space.
If both signals were modulated onto one carrier, you would never get both of them back. Two carriers are needed. In this case both have the same frequency. How is that possible? Start by generating the carrier frequency, a pure sine wave. Split it into two equal signals— and here comes the trick—phase shift one of them 90 degrees so that they are truly two different signals at the same frequency. Modulate I on one and Q on the other and add them both back into the luminance signal.
But that still doesn’t explain how the I and Q signal excursion into the negative IRE level gets resolved. One more trick:
Phase modulate the signals onto each carrier. Very simply put, when the signal goes negative it modulates the carrier in one frequency direction, when it goes positive it modulates the carrier in the other direction. The amplitude of the color carrier is determined by the absolute level of the I and Q signals. The above zero or below zero IRE is translated to a frequency shift instead of an amplitude shift.
You’ve seen color noise figures given in terms of AM and PM (and, no, it didn’t take them that long to make the measurements). Chroma AM is Amplitude Modulation, as in AM radio. The absolute value of the I and Q information deter mines the amplitude of the carrier. Chroma PM is Phase Modulation, it determines the frequency direction of the modulated carrier based on the polarity of the I and Q signals about the 0 IRE axis. It is something similar to FM, Frequency Modulation.
When the phase modulated signals are added back into the Y signal, they are added in at the exact time the corresponding luminance information occurs. Obviously, it takes a finite amount of time for the color information to be prepared. The luminance information has to be delayed exactly the same amount of time as it takes to put the color information together so that when the two signals are added together, they will exactly coincide in time. In using the test disc, you’ll find that there are test patterns for detecting errors in chrominance to luminance delay.
The modulated subcarrier is symmetrically added to the luminance information in the time domain. What does that mean? If the carrier amplitude is 40 IRE and the V value is 30 IRE, the carrier excursion in the final NTSC signal will be from 10 IRE to 50 IRE, half above and half below the 30 IRE luminance level.
We now have NTSC in its final form, but there is still at least one more problem to discuss. Between the time the color system was set out on paper and first implemented by all three networks there was information from Y occupying the space of the color signal. Luminance bandwidth now extends out to the full video bandwidth capability of the signal, 4.2 MHz for a transmitted signal, higher for other video sources.
In the beginning of the discussion of adding color into existing luminance information, provisions were made so that the color information could coexist with the luminance information. If you look at the frequency spectrum of a sine wave, there is a single spike at the fundamental frequency. If that frequency happens to be a carrier of information, as in the case of the color carrier, there will be harmonics up and down the spectrum once the carrier is modulated. There are also spikes of information in the spectrum directly related to the horizontal and vertical frequencies of the black and white signal. If those side bands of the luminance and color information happen to fall in-between each other, where they overlapped in frequency space, they could coexist.
But how do you make sure that happens? It’s actually fairly simple. You derive one fundamental frequency from the other. Since it is much more accurate to divide down from a higher frequency than to multiply up from a low frequency, the primary clock frequency should be the higher frequency. The color subcarrier becomes the master clock for the entire video system, including the vertical frequency, since it is directly related to the horizontal frequency.
The color carrier frequency is divided by 455, then multiplied by 2, in the process of deriving the horizontal clock frequency. The vertical clock is derived by dividing the horizontal rate by 525, the number of lines in the system, then multiplying by 2 because there are two vertical intervals per complete picture. Horizontal and vertical frequencies are exactly determined, including the phase of their signals, if everything is done right by the color subcarrier. The harmonics of the horizontal information will fall in-between those of the color subcarrier.
Deriving horizontal and vertical from the color subcarrier is a change from the black and white system, both in frequency and approach. The original black and white picture rates were determined by the power line frequency, 60 Hz. The horizontal frequency was derived from the vertical rate. There are 262.5 lines in each 1/60th of a second. 60 X 262.5 = 15,750 Hz for the horizontal frequency. The color horizontal frequency shifted to 15,734.26 Hz and the vertical frequency became 59.94 Hz once they were derived from the color subcarrier frequency. This was close enough to the original black and white system frequencies to work with the old black and white NTSC sets.
Getting back to the horizontal information falling in-between the color information in frequency space for a moment. Look at the diagram of the frequency spectrum. Can you spot where the term “interleaved color” comes from? If picture information were exactly vertical or exactly horizontal, the luminance information sidebands and color sidebands would each occupy their own space in the frequency spectrum, completely independent of the other. Real life doesn’t exactly work in just horizontal and vertical dimensions, so we lose some more information in the translation; in the diagonals. Just as real picture information can occupy the space of color, and may get lost in the decoding process, real color information can occupy the frequency space of luminance; and get lost in decoding. The technical term is cross-luminance or cross-color, depending on the direction you look at the error.
There is at least one more luminance problem of the color subcarrier to be discussed. That is, its frequency could be displayed as luminance information if it were phase matched from line to line. What does that mean? Lets take a simple example, a full flat field of all one color. The luminance level is flat, it really doesn’t matter at what level for this discussion, but let’s just pick 40 IRE. The color subcarrier riding on top of the luminance level is basically a line wave. Lets say its phase is 0 degrees at the beginning of every active TV line. If this were true, and luminance information can exist in the same frequency space as color, you would see vertical stripes running down the entire picture, just like the 3.58 MHz stripes in the multi-burst pattern.
Fortunately, someone designing the system thought of that. One more neat trick came along with deriving the horizontal frequency from the color subcarrier sine wave. The phase of the subcarrier changes 180 degrees at the beginning of each active TV line. Changing the color phase has an average effect on the entire picture of canceling the majority of luminance information that might be contributed by the color subcarrier. It doesn’t necessarily take care of every thing, depending on the type of decode being used to derive the RGB signals. The subject of “dot crawl” at color transition and at color to black and white transitions will be taken up in the discussion of the decode process.
It takes four fields in the NTSC system to complete a color phase cycle. In other words, while it takes two fields to complete a luminance picture, it takes four fields before line 1 of the first picture field will return to the same color phase. (It takes eight fields to complete a color cycle in PAL.)
--- NTSC Frequency Spectrum Showing Color And Luminance Sideband
Start out with R, G and B. Derive Y, the black and white signal. Generate two more signals, R-Y and B-Y so that color can be obtained. Amplitude and band limit those signals to a point that they have to be renamed I and Q. Modulate the I and Q signals on two phase shifted 3.58 MHz subcarriers and add them both back into the Y signal. That’s composite NTSC.
NTSC = Y + [ Sin (wt + 33) + I Cos (wt + 33)]
Where Y = 0.3R + 0.59G + 0.11 B = 0.877 (R - Y) & 0 = 0.493 (B - Y)
Sin (Sine) and Cos (Cosine) are the 90 degrees out of phase color difference signal carriers. The signals are further shifted 33 degrees, maintaining their 90 degree separation. The 3.579545 MHz carrier is represented by the wt. The information between the [ is the color signal. The phase shift of 33 actually means that I and Q both contain parts of R-Y and B-Y but that is far to complex for this discussion.
For those of you who still have their calculators on, you’re all set to come up with the first example of a situation that will get NTSC into trouble at the transmitter. Let’s calculate the value of 0 for 100 percent blue video. Blue in the RGB domain: R = 0, G = 0, and B = 100. Y = 11, B -Y = 89,0 = 43.877 or about 44 IRE. Here comes the problem. When the 44 IRE 0 signal on a 3.58MHz carrier is added to the 11 IRE flat field Y signal, 11 IRE of the signal level falls below the 0 IRE line, the lower limit of video information.
It so happens that the color synchronization burst on the beginning of each horizontal line goes into the luminance sync area by 20 IRE, but it is adjacent to the sync, always in a known spot. The 11 IRE of the example above could occur anywhere along the active line. In the early days of NTSC color there were a number of transmitters that could not deal with this intrusion into the territory of sync signals within the active video area. Even today, it’s not recommended.
This is about the time a +7.5 IRE setup was introduced to the black level. Moving the base line of the luminance information up in level, from 0 IRE to +7.5 IRE kept the subcarrier out of the majority of sync’s territory.
Earlier, mention was made that Japan dropped this setup in 1990. In reality, it could have been dropped as early as 1964. By that time the majority of problems with transmitters had been fixed. We are paying for that change in lost dynamic range in the video signal.
As you might well calculate, a similar problem existed on the upper end of the luminance scale, especially after the addition of black level setup. Subcarrier levels significantly above 100 IRE are possible. What do we do? Change the NTSC system again? Well, no, not this
time. The solution offered is to be careful with color video levels in program production, never allowing color saturation in the program material to exceed 100 IRE in the final NTSC video signal. This was not a problem for the majority of program material. Only daytime game shows, with all their colored lights shinning directly into the cameras caused significant problems.
Color bar test signals were changed. The SMPTE Color Bar pattern is only 75 percent saturated. As a matter of fact, until the early 1990s 75 percent saturated colors were not welcomed at disc mastering plants. They didn’t want to see the color amplitude even that high.
We now have this composite system with some limitations in program production.
See Frames 14440, 20474, and 20475 in A Video Standard to see what this looks like in the actual video signal. The pictures are taken from the wave form monitor presentations of the video signal.
[Adapted from Widescreen Review--Imaging Science Theatre 2000 (1998)]