--U-1
To Check the Output Uniformity of an Audio Oscillator or Square-Wave Generator
Equipment: AC VTVM.
Connections Required: Connect equipment as shown in Fig. 1.
Procedure: Adjust generator attenuator and meter controls to indicate voltage of output signal. Switch the generator to its various bands successively, and turn the tuning dial through its range on each band. Observe any changes in meter reading.
Evaluation of Results: A good audio oscillator or square-wave generator will have little variation in output level over the various frequency ranges. If the level is not constant, this must be considered when the frequency response of an amplifier is being checked.
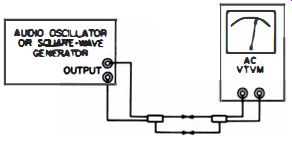
Fig. 1. Test setup.
NOTE 1
Audio-Oscillator Hum Is Highest on Low-Frequency Range of RC Bridge-type Oscillator
Sixty-cycle hum, when present in the output from an audio oscillator, will usually be most troublesome on the lowest frequency range of an RC bridge-type oscillator. This is due to the oscillator circuit resistance being very high on the low-frequency range-the grid resistance normally is 15 to 20 megohms. Consequently, the grid circuit is susceptible to pickup of stray 50-cycle fields. The remedy is better shielding of the high-resistance grid-circuit components.
--U-2
To Check the Output of an Audio Oscillator or Square Wave Generator for Hum Voltage
Equipment: Oscilloscope.
Connections Required: Connect equipment as shown in Fig. 2.
Procedure: Display sine- or square-wave pattern on scope screen.
Tune generator near--but not exactly to--60 cycles. Observe pattern on screen.
Evaluation of Results: The pattern should be completely steady.
Any writhing of the waveform on the scope screen indicates the presence of hum.
The vertical amplifier of the scope must also be free from hum before a valid test can be obtained.
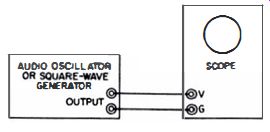
Fig. 2. Test setup.
NOTE 2
Output From Square-Wave Generator Sometimes Is Unstable
When certain types of square-wave generators are tested by feeding the generator output to a scope, the waveform displayed is sometimes unstable and distorted, and will change when the operator grasps a test lead. This is more evident when the generator attenuator is operated at maximum. The instability and distortion often can be remedied by connecting a water-pipe ground to the cases of the instruments. (See Fig. 3 for illustration of typical unstable waveform .)
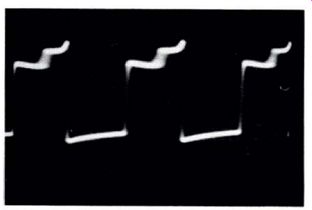
Fig. 3. Typical unstable output wave form from square-wave generator.
--U-3
To Check the Output From an Audio Oscillator for Distortion Equipment: Audio oscillator and harmonic-distortion meter.
Connections Required: Connect equipment as shown in Fig. 4.
Procedure: Tune audio oscillator to a low frequency, such as 100 cycles. Adjust meter controls to read percentage of harmonic distortion. Repeat test for medium frequency, such as 3,000 cycles, and for high frequency, such as 15 khz.
Evaluation of Results: The meter reading should be very low.
Subtract this measured distortion figure from the total distortion figure indicated when low-distortion amplifiers are being checked. If the audio oscillator has appreciable harmonic output, use a low-pass filter to minimize the harmonic distortion. A simple RC filter like the one in Fig. 5 is helpful. The values of R and C depend upon the test frequency. The lower the frequency, the larger the values must be. Figs. 6, 7, and 8 show how the fundamental waveform is suppressed by a harmonic-distortion meter.
The meter then indicates the voltage of any harmonic in the waveform under test.
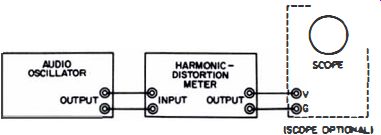
Fig. 4. Test setup.

Fig. 5. An R-e low-pass filter for removing harmonic. from audio-oscillator
output.
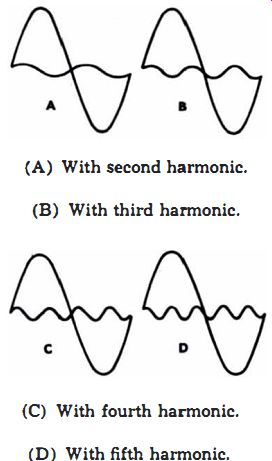
Fig. 6. Fundamental line wave with harmonics. (A) With second harmonic.
(B) With third harmonic.
(C) With fourth harmonic.
(D) With fifth harmonic.

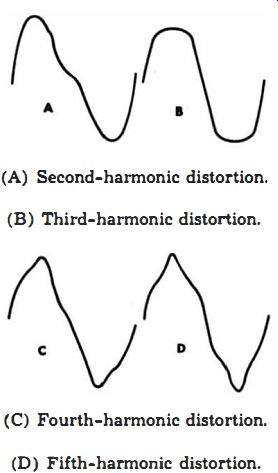
Fig. 7. Amplifier output distorted by harmonics. (A) Second-harmonic distortion.
(B) Third-harmonic distortion.
(C) Fourth-harmonic distortion.
(D) Fifth-harmonic distortion.

Fig. 8. Harmonic line-wave voltage. measured by harmonic-distortion meter,
(A) Second harmonic.
(C) Fourth harmonic.
(B) Third harmonic.
(D) Fifth harmonic.
NOTE 3
A Filter Can Improve Output Waveform from Audio Oscillator
A filter consisting of a Class-A amplifier with a parallel-T RC negative feedback loop (Fig. 9) can be used to improve the waveform from an audio oscillator. The network operates like a trap. Negative feedback occurs at all frequencies except the null frequency of the network. Therefore, the network passes one frequency only. Since there is no negative feedback at the pass frequency, considerable demand is placed upon the Class-A amplifier for distortion-free amplification. The tube must introduce negligible distortion into the signal; otherwise, the purpose of the filter will be defeated. The feedback loop can be designed to pass any audio frequency, according to the formula: where, R, C, R, f= 'h.-R,C, Rand C notations are as in Fig. 9, f is the resonant frequency of the network.
The values for a complete null at the resonant frequency are quite critical. It is advisable to use two potentiometers, one as RI other as Ro be adjusted critically, to provide a complete null at the chosen frequency.
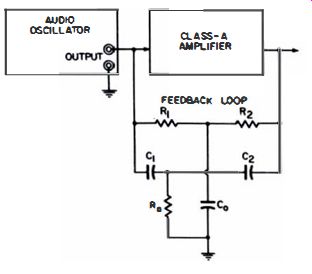
Fig. 9. An audio filter to improve the waveform from an audio oscillator.
NOTE 4
Audio-Oscillator Calibration Can Be Checked Against WWV Transmission,
We seldom need to accurately know the output frequency from an audio oscillator. However, if this becomes desirable, the instrument can be zero-beat against the WWV trans mission at 440 and 4,00 cycles. Other harmonic and subharmonic frequencies can be calibrated with Lissajous patterns.
--U-4
To Check an Audio Oscillator for Load Sensitivity
Equipment: AC VTVM and assorted fixed capacitors.
Connections Required: Connect equipment as shown in Fig. 10.
Procedure: Set audio oscillator for 10- or 15- khz output. Set attenuator for maximum output. Observe meter reading. Then shunt progressively larger capacitors across output terminals of audio oscillator. Again observe any change in meter reading. Repeat test with attenuator set at 2/3, 1/2, and 1/3 maximum.
Evaluation of Results: A load-sensitive audio oscillator will show a drop in output with relatively small shunt capacitances across the output terminals. Load sensitivity usually is most troublesome at lower attenuator settings and higher operating frequencies. It must be taken into account when audio signals are injected into circuits having shunt capacitances that can affect generator characteristics.
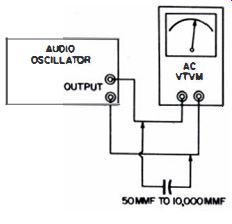
Fig. 10. Test setup.
--U-5
To Check a Square-Wave Generator for Load Sensitivity
Equipment: Oscilloscope and assorted fixed capacitors.
Connections Required: Connect equipment as shown in Fig. 11.
Procedure: Set square-wave generator controls for high-frequency square-wave output, such as 10 or 15 khz. Set generator attenuator for maximum output. Observe waveform on scope screen. Then shunt progressively higher capacitances across generator-output terminals until diagonal corners of square wave are noticeably rounded, as shown in Fig. 12. Repeat test with generator attenuator set at 2/3, ½ and 1/3 maximum.
Evaluation of Results: A load-sensitive square-wave generator will show corner rounding when comparatively small capacitances are shunted across the generator-output terminals.
In general, load sensitivity is greatest at low attenuator settings and at high frequencies. Load sensitivity must be taken into account when square-wave signals are injected into circuits having shunt capacitances that are high enough to affect generator characteristics.
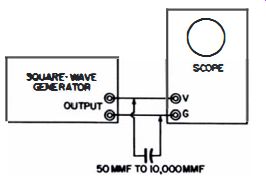
Fig. 11. Test setup.
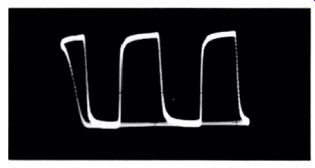
Fig. 12. Squarewave pattern with diagonal corners rounded.
--U-6
To Check the Accuracy of an Audio Wattmeter Equipment: Amplifier, audio oscillator, terminating resistor, and AC VTVM. Connections Required: Connect equipment as shown in Fig. 13.
Procedure: Drive amplifier with moderate output from audio oscillator, to avoid waveform distortion in amplifier output.
Note scale readings on wattmeter and VTVM. Reduce output from audio oscillator in steps, and note scale readings on both instruments. Repeat the tests to obtain checks at low, medium, and high frequencies.
Evaluation of Results: The VTVM should be read in rms values.
(If peak or peak-to-peak voltages are indicated by the VTVM, convert to rms values.) The power in the load resistor is given, in each test, by E' /R, when E is in rms volts.
The value of E"/R should correlate closely with the reading on the wattmeter scale in each test.
Both the VTVM reading and the wattmeter are subject to waveform error. Hence, they should be checked with a good audio oscillator and amplifier. The output waveform from the amplifier can be tested with a harmonic-distortion meter. Typical audio wattmeters have an input resistance of 10,000 ohms.
An amplifier load resistor of 16 ohms, for example, will not have its value changed appreciably when the wattmeter is connected.
On the other hand, some wattmeters have low input resistances.
If so, calculate the actual load resistance as the wattmeter input resistance and the terminating resistance in parallel.
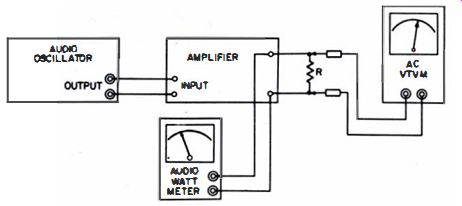
Fig. 13. Test setup.
--U-7
To Measure the Rejection Characteristic of a Harmonic
Distortion Meter
Equipment: Audio oscillator and AC VTVM.
Connections Required: Connect equipment as shown in Fig. 14.
Procedure: Set harmonic-distortion meter controls to eliminate the fundamental at a given frequency, such as 400 cycles.
Then tune the audio oscillator slowly (or in small steps) from 100 to 600 cycles. Observe voltage readings on VTVM.
Evaluation of Results: The rejection characteristic starts at the frequency at which the
VTVM reading first starts to drop off. The characteristic goes through zero and then rises again. The rejection characteristic ends at the frequency at which the VTVM reading returns to its original value.
If the meter movement in the harmonic-distortion meter is known to be accurate, the AC VTVM will not be required.
If desired, the rejection characteristic can be plotted on a sheet of graph paper as voltage versus frequency.
A very narrow rejection characteristic is undesirable. On the other hand, the characteristic should not be so broad that the second harmonic of the fundamental is appreciably attenuated.
This would cause false readings of total harmonic distortion. It is advisable to check the rejection characteristic at a low frequency, such as 60 cycles; at a medium frequency, such as 1,000 cycles; and at a high frequency, such as 15,000 cycles.
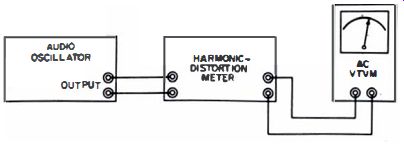
Fig. 14. Test setup.
Rejection-Frequency Curve of Harmonic-Distortion Meter
When tuned to the fundamental frequency, a harmonic-distortion meter suppresses the fundamental of a waveform. The rejection-frequency curve is made as broad as possible without appreciably attenuating the second harmonic. This insures that the rejection circuit will not ring a waveform excessively. Fig. 15 shows a typical rejection-frequency curve for a harmonic-distortion meter. The trap characteristic could be quite narrow. However, the narrower the characteristic, the greater the ringing imposed on a waveform.
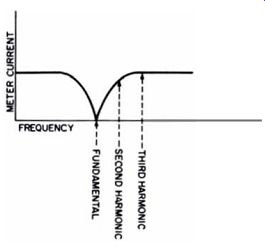
Fig. 15. Typical rejection-frequency curve for a harmonic-distortion mete"
--U-8
To Check the Frequency Response of a Harmonic-Distortion Meter
Equipment: Audio oscillator and oscilloscope.
Connections Required: Connect equipment as shown in Fig. 16.
Procedure: Set controls of harmonic-distortion meter so as to switch the filter out of the instrument circuit. This is commonly termed the Set Level function. Adjust audio oscillator and instrument level control to obtain 1/2 or 3/4 full-scale indication on the harmonic-distortion meter. Vary audio oscillator frequency from 60 cycles to an upper frequency at which the vertical deflection on the scope screen begins to decrease.
Evaluation of Results: The point at which the vertical deflection begins to decrease is the upper frequency limit of the amplifiers in the harmonic-distortion meter. Past this frequency, the instrument is not useful.
Observe also the harmonic-distortion meter indication relative to the vertical deflection on the scope screen. If the meter indication starts to fall off first, this point must be taken as the highest useful frequency for the harmonic-distortion meter. Note also that, to provide a valid test, the audio oscillator must have a uniform output. The audio oscillator can be connected directly to the scope input terminals for a cross check.

Fig. 16. Test setup.
--U-9
To Check the Consistency of Distortion Scale Indication in a Harmonic-Distortion Meter
Equipment: Audio oscillator.
Connections Required: Connect equipment as shown in Fig. 17.
Procedure: Apply low-frequency output, such as 60 hz, from audio oscillator to harmonic-distortion meter. Adjust level control of meter for full-scale indication, with sensitivity switch set at the 100% position (or Set-Level position). Then tune the filter until a very low reading, such as 1% or 2%, is obtained' (Fig. 18). Finally turn the sensitivity switch progressively to the 30%, 10%, and 3% positions. Note meter reading each time on appropriate scale. Repeat tests at 400 cycles and at 10 khz.

Fig. 17. Test setup.
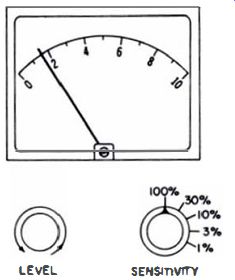
Fig. 18. Appearance of control, when operation of a harmonic distortion
meter being checked.
Evaluation of Results: The meter reading should be the same on all ranges. In actual practice, however, considerable inaccuracy may occur at very low scale positions. The accuracy of the average distortion meter will usually be higher when readings are taken on the upper % or % of the scale .
NOTE 6
Reversing Power Plug Often Reduces Residual Hum Level in Harmonic-Distortion Meter
When a harmonic-distortion meter is set for high-sensitivity indication, such as the 1% range, the pointer does not rest at zero. Instead, it fluctuates about an average position--normally 1/10 full scale. If the power plug in the outlet is reversed, the pointer will often rest nearer zero, because the residual hum level in the meter will have changed.
NOTE 7
Three Types of Scales Are Provided an Conventional Harmonic-Distortion Meters
A harmonic-distortion meter usually has three scales-VTVM, percentage of total harmonic distortion, and decibels. The VTVM ranges generally measure from zero to approximately 30 volts. The decibel ranges in most meters have a reference level of 1 milliwatt in 60 ohms.
NOTE 8
Peak Voltage of Fundamental in Square Wave Is Greater Than Peak Voltage of Square Wave
When a square wave is passed through a harmonic-distortion meter (Fig. 19) and the instrument is tuned to trap out the fundamental, the waveform of the residual voltage will be as shown in Fig. 20. The troughs of the removed fundamental sine wave cross the zero-volt axis.
This is due to the peak voltage of the fundamental frequency in a square wave being 127 times the peak voltage of the square wave itself. The harmonic-distortion meter reads a typical 28.5% on the residual voltage. Ordinary harmonic-distortion meters are not highly accurate when the harmonic content of a waveform is large.

Fig. 19. Test setup
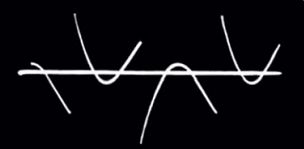
Fig. 20. Position of zero-volt level with respect to fundamental, when
harmonic-distortion meter is tuned for indication of complete fundamental
elimination.