--U-10
To Measure the Cathode Current of the Output Tubes in an Audio Amplifier
Equipment: DC milliammeter and phone plug.
Connections Required: Make connections as shown in Fig. 21.
Procedure: Turn milliammeter controls for high-current range.
Insert plug into jack 1 of amplifier. Reduce range setting on meter until 1/2 or 2/3 full-scale reading is obtained. Then repeat procedure at jack 2.
Evaluation of Results: A cathode current of approximately 60 ma can be expected in a normally operating amplifier. The current will change if the amplifier is driven into overload.
The current readings at both jacks should be equal, and should not exceed the maximum ratings for the tubes in the amplifier. If the current readings are not equal, the amplifier balance control (or controls) should be adjusted.
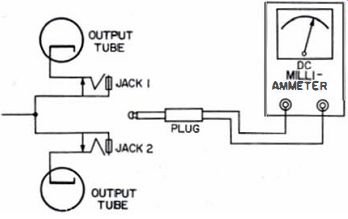
Fig. 21. Test setup.
NOTE 9
Distortion Increases When Push-Pull Stages Are Unbalanced
The push-pull output stage of an audio amplifier should be balanced to within 5%, and preferably 2%, on a cathode-current basis. When the tubes are unbalanced, hum, harmonic distortion, and intermodulation distortion increase. Sometimes output tubes must be selected which will provide a satisfactory balance adjustment. A tube tester usually will indicate whether a pair of tubes have reasonably similar characteristics. If balance cannot be obtained when similar tubes are used, check the circuit components.
NOTE 10
Hum in Amplifier Output Arise. from Various Sources Hum in the output of an audio amplifier is not always due to faulty filter capacitors or inductors. A common offender is heater-cathode leakage in tubes which have cathodes operating above ground. Tube selection is helpful, particularly in low-level stages. Some amplifiers have a hum-balance control in the heater circuit. If so, adjust the control for minimum hum. Poor ground connections, or improperly grounded units which cause circulating ground currents, are sometimes responsible.
High-impedance, low-level grid circuits can pick up stray hum fields.
To check, go through the amplifier, stage by stage, and shunt each grid to ground in succession with a large bypass capacitor. This will show whether a grid circuit is picking up hum. Sometimes a low-level audio cable needs to be grounded at one end only. At other times, hum can be reduced by grounding both ends.
--U-11
To Test the AC Balance of the Push-Pull Output Stage in an Audio Amplifier
Equipment: AC VTVM and audio oscillator.
Connections Required: Connect equipment as shown in Fig. 22.
Procedure: Adjust audio oscillator to provide nearly maximum rated output from amplifier. Tune oscillator for standard test frequency, such as 400 cycles. Apply VTVM lead, in turn, from plate 1 to ground and plate 2 to ground. Note meter readings.
Evaluation of Results: The two readings should be nearly equal.
If not, check the DC voltage readings from plate 1 to ground and plate 2 to ground. If the DC voltage readings are nearly equal but the AC voltage readings are not, check the drive circuits to the output stage. If both the AC and the DC voltage readings are unequal-and the balance control (s) are adjusted as accurately as possible-check the components in the output stage.
Unequal AC voltage readings can be expected at very low and very high audio frequencies. Here the circuit reactances begin to show up as unequal drive voltages to the grids of the push-pull tubes.
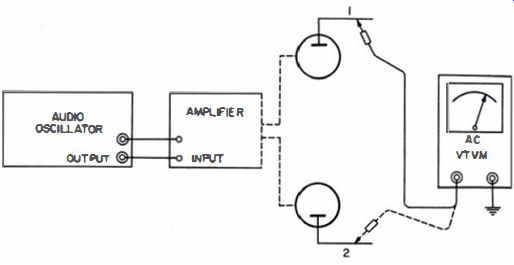
Fig. 22. Test setup.
--U-12
To Measure the Frequency Response of an Audio Amplifier Equipment: Audio oscillator, AC VTVM, power resistor, and toggle switch or clip lead.
Connections Required: Connect equipment as shown in Fig. 23.
Procedure: Set audio-oscillator controls for 50-cycle output and for maximum rated power level across load resistor R. Measure voltages at points 1 and 2. Then advance generator frequency to 200 cycles. Check voltage at point 2, and reset audio-oscillator attenuator, if necessary, for same input voltage as before. Then measure the output voltage from the amplifier at point 1 again. Repeat the procedure at progressively higher frequencies, to obtain complete frequency response of amplifier.
Evaluation of Results: Plot or tabulate the voltage-vs.-frequency measurements, and compare them with the manufacturer's amplifier specifications.
A more complete test of amplifier frequency response is obtained by repeating the procedure for low- and medium-level input voltages. The power in load resistor R can be easily found from Ohm's law: W=E2/R where, W is the power in watts, E is the rms voltage across R, R is the load resistance in ohms.

Fig. 23. Test setup.
NOTE 11
Resistor Used al Amplifier Load Must Have Adequate Power Rating A resistor or combination of resistors used as an amplifier load during tests must have a large enough power rating to handle the output from the amplifier. Two resistors can be connected in series or parallel to double the power-handling capability. Three resistors connected in series or parallel will triple the power-handling capability of an individual resistor.
Thus, two 5-watt, 8-ohm resistors can be connected in series to provide a 10-watt, 16-ohm resistive load. Or, two 5-watt, 32-ohm resistors can be connected in parallel to provide a IO-watt, I6-ohm load.
NOTE 12
Octave Is a Harmonic-Frequency Relation
Amplifiers are sometimes rated in terms of db roll-off per octave. This means the response is down this number of db for each time the frequency is doubled. The term octave in musical work designates the tone interval, e.g., from one C -note on the piano to the next C note. There are eight intervals, or one octave, between the two C notes. The two notes are practically in harmonic frequency relation on the modern, tempered scale. Thus, if an amplifier has a roll-off of 6 db per octave past 10 khz, the response will be down 50% at 20 khz.
--U-13
To Measure the Total Harmonic Distortion of an Amplifier
Equipment: Audio oscillator, harmonic-distortion meter, and optional terminating resistor for amplifier.
Connections Required: Connect equipment as shown in Fig. 24.
Use the rated value of terminating resistor for the amplifier, if the speaker is disconnected.
Procedure: Set harmonic-distortion meter to Set Level position.
Tune audio oscillator to a standard test frequency, such as 400 cycles. Adjust input signal level for full-scale meter indication. Then switch harmonic-distortion meter to suitable test position, and tune out the 400-cycle fundamental. Observe meter reading, using a higher-sensitivity range if necessary.
Evaluation of Results: The meter scale of a typical harmonic distortion meter indicates the percentage of distortion voltage, with respect to the output voltage of the amplifier.
Standard test procedure is to adjust the input signal level to the amplifier for maximum rated power output. Percentage distortion will usually be lower at lower power-output levels. For good-quality sound reproduction, total harmonic distortion should be less than 2%. (Up to 5% is considered acceptable.) Note also that an audio oscillator can have greater distortion than a low-distortion amplifier. We cannot subtract the audio-oscillator distortion from the total amplifier distortion, because we do not know whether the audio-oscillator distortion voltages are in phase, out of phase, or at some other phase to the amplifier distortion voltages. A good audio oscillator must then be used, or its output must be filtered.

Fig. 24. Test setup.
NOTE 13
Oscilloscope Can Display Waveform of Voltage Measured by Harmonic Distortion Meter
Many harmonic-distortion meters have a pair of output binding posts to which a scope can he connected (Fig. 25). The scope shows the waveform of the distortion voltage measured by the meter. This is often useful for showing whether the distortion voltage is principally second harmonic, third harmonic, etc. Fig. 26 shows the change in shape of a harmonic-distortion waveform as the distortion meter is tuned through the null point.

Fig. 25. Test setup for U13, using oscilloscope.
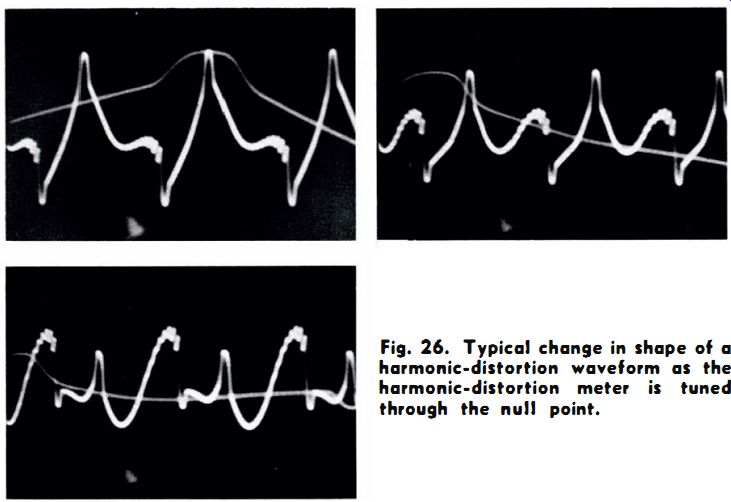
Fig. 26. Typical change in shape of a harmonic-distortion waveform as
the harmonic-distortion meter is tuned through the null point.
NOTE 14
Advantage of Using a Scope With a Harmonic Distortion Meter
There is no definite relationship between percentage of total harmonic distortion and quality of sound, as judged by the listener. Two amplifiers can have the same percentage of total harmonic distortion; yet, listeners will quickly agree that one amplifier has better quality of reproduction than the other. One theory to explain this lack of correlation is that clipping, for example, though causing a small percentage of harmonic distortion, is highly objectionable to the listener because it occurs over a small portion of the cycle only. Our ears respond more like the beam of an oscilloscope than like the pointer in a harmonic-distortion meter. In a scope pattern we sometimes can detect objectionable distortion, which would pass unnoticed in a harmonic-distortion meter test.
The general rule is:
1. A harmonic-distortion meter can measure various forms of objectionable harmonic distortion, which cannot be seen on the scope screen. A typical example is a simple mixture of a third harmonic voltage with a fundamental voltage.
2. A scope can make visible other objectionable forms of harmonic distortion which cannot be properly evaluated on a harmonic distortion meter. A typical example is peak clipping or compression of a fundamental voltage.
Clipping is the most objectionable form of harmonic distortion. A small discontinuity that causes clipping does not cause a proportionally large increase in total harmonic distortion.
Thus, in evaluating a total harmonic distortion figure, it is important to know whether clipping distortion is included. A total harmonic-distortion figure that is acceptable in the absence of clipping can be unacceptable if it refers to clipped waveforms.
A clipped sine wave is shown in Fig. 27.
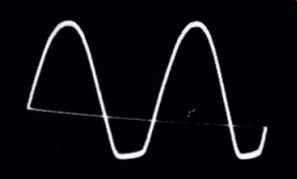
Fig. 27. Unsymmetrical clipping of a sine wave.
NOTE 15
Different Types of Filters Are Used in Harmonic-Distortion Meters
Harmonic-distortion meters commonly used in audio work have either a high-pass filter, or a rejection filter which eliminates only the fundamental frequency from the amplifier output signal. In general, the fundamental-rejection filter gives a higher meter reading because it does not eliminate circuit noise and hum voltage. Both types of harmonic-distortion meters measure what is called total harmonic distortion. Although the total harmonic-distortion voltage is applied to the meter, the reading is not exactly a true total harmonic voltage. The inaccuracy of indication results from the contact rectifiers, which respond to the average value of the total harmonic voltage. The average value can vary appreciably, depending upon the phases of the distortion voltages. A completely accurate measurement of total harmonic distortion is time consuming.
It requires a sharply-tuned pass filter to measure the various distortion voltages, one by one. Each value is then squared, and the sum of all the squares is computed. Finally the square root of the sum of the squares is taken. The square root gives the true total harmonic-distortion voltage. It is possible to use a thermocouple or a square-law VTVM indicator in a harmonic-distortion meter, to provide true indications of total harmonic-distortion voltages.
However, a thermocouple is delicate and easily burned out, and a square law VTVM is not as stable nor as easy to keep in calibration as the simpler AC meters. Hence, contact rectifiers are generally used. Ordinary total harmonic-distortion meters are very useful for comparative tests on amplifiers, although the actual reading may not be exactly correct.
NOTE 16
Harmonic-Distortion Measurements More Meaningful When Made Over a Wide Range of Operating Conditions
It is customary to give the total harmonic-distortion percentage for an amplifier under one or two conditions of power into a resistive load.
However, more meaningful data are provided by determining the total harmonic-distortion percentage over a wide range of operating conditions.
Measurements should include:
(1) low output level, (2) medium output level, (3) high output level, (4) low input frequency, (5) medium input frequency, (6) high input frequency, (7) low gain-control setting, (8) medium gain-control setting, (9) high gain-control setting, and (10) typical speaker, instead of resistive, load in all of the foregoing tests.
NOTE 17
Total Harmonic-Distortion
Figure 15 Inconclusive Amplifiers cannot be compared solely on the basis of total harmonic distortion. The reason is that high-order harmonic distortion is more objectionable to the listener. Accordingly we need to know the percentages of second, third, fourth, fifth, etc., harmonic distortions. To avoid this difficulty, compare the amplifiers on the basis of intermodulation distortion, in order to obtain a better evaluation of reproduction quality.
NOTE 18
Noise and Hum in Output Signal Can Be Measured in Scope Pattern
Fig. 28 shows noise and hum voltages superimposed on the output waveform from an amplifier. The vertical excursion of the "fuzz" riding on top of the waveform can be measured if the scope is calibrated. The excursion of the complete waveform also corresponds to a certain voltage, which can be measured when the deflection sensitivity of the scope is known.

Fig. 28. Examples of large hum and noise voltages in the distorted output
from an amplifier.
--U-14
To Check for Amplifier Distortion With a Scope
Equipment: Audio oscillator, terminating resistor, and oscilloscope.
Connections Required: Connect equipment as shown in Fig. 29A.
Procedure: Advance output from audio oscillator until the straight line on the scope screen just begins to curve at one or both ends, as shown in Fig. 29B. Then, using calibrating facilities of scope, determine the voltage across terminating resistor R.
Evaluation of Results: According to a rule of thumb, there will be approximately 1% harmonic distortion in the amplifier output when the straight line just begins to curve noticeably.
The power in the load at this point is given by the formula, W = E^2/R. Power measurements are made by calibrating the scope in rms values.
The frequency or frequencies of test must not exceed the capability of the scope, if a narrow-band scope is used. The horizontal amplifier in the scope is usually the limiting factor. For audio work, a scope with identical vertical and horizontal amplifiers is preferred.
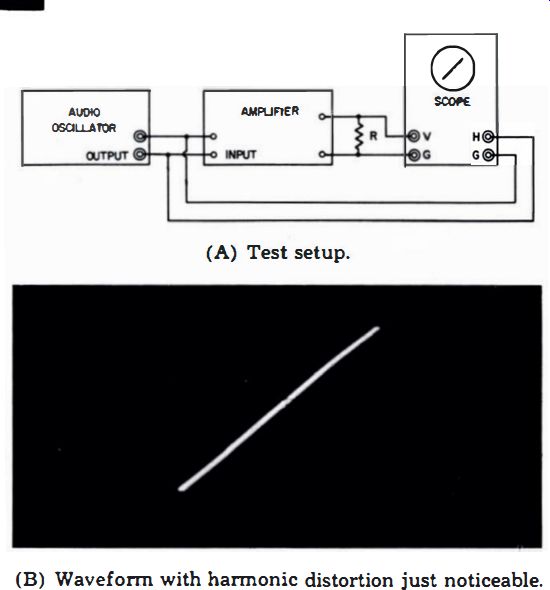
Fig. 29. Checking amplifier distortion. (A) Test setup. (B) Waveform with
harmonic distortion just noticeable.
--U-15
To Measure Amplifier Phase Shift With an Electronic Switch
Equipment: Audio oscillator, electronic switch, oscilloscope, and terminating resistor.
Connections Required: Connect equipment as shown in Fig. 30.
Procedure: Adjust audio-oscillator output for desired operating level, below maximum rated output of amplifier. Set electronic-switch and scope controls for convenient pattern display. Tune audio oscillator through the passband of the amplifier, while watching the two sine-wave displays for shift along the horizontal base line.
Evaluation of Results: In the midband range an audio amplifier will show an output waveform which· is either in phase or 180 deg. out of phase with the input waveform. On the other hand, at the low-frequency and high-frequency ends of the passband, the output waveform will progressively lag or lead the input waveform (see Fig. 31). Lag or lead often occurs in the midband range because of faulty crossover or feedback networks.
Phase shift can be disregarded in amplifiers not designed for high-quality reproduction. On the other hand, discriminating listeners find phase shift objectionable in high-fidelity amplifiers.
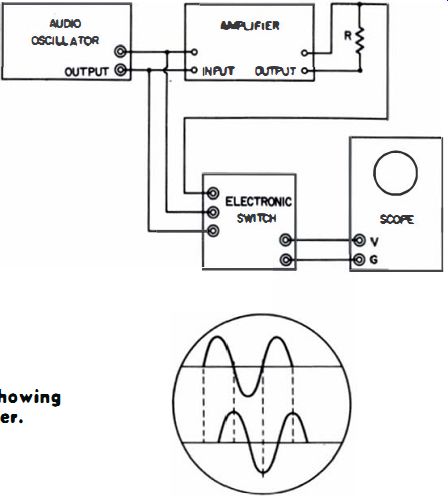
Fig. 30. Test setup.
Fig, 31. Typical waveform, showing phase shift through an amplifier.
--U-16
To Measure the Maximum Power Output From an Amplifier (Harmonic-Distortion Meter Method)
Equipment: Audio oscillator, harmonic-distortion meter, terminating resistor, and AC VTVM.
Connections Required: Connect equipment as shown in Fig. 32.
Procedure: Advance output from audio oscillator in successive steps, each time checking the total harmonic distortion with the harmonic-distortion meter. When the percentage of harmonic distortion reaches a chosen maximum, such as 1%, observe the VTVM reading.
Evaluation of Results: The power in the load is given by Ohm's law-W = E"/R-where W is the power in watts, E is the voltage in rms volts, and R is the resistance of the terminating resistor in ohms.
When the maximum total harmonic distortion chosen is small, a good audio oscillator must be used. Otherwise, the audio oscillator can have more distortion than the amplifier. The output waveform from an audio oscillator can be improved by using the low-pass filter shown earlier in Fig. 5.
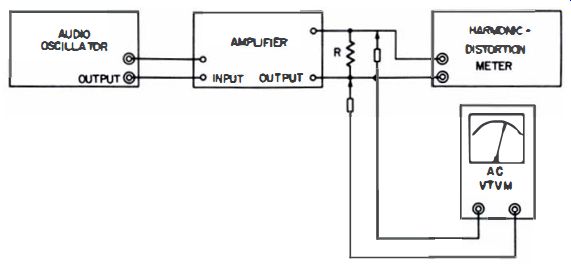
Fig. 32. Test setup.
NOTE 19
Input Circuit of Harmonic-Distortion Meter Has No Blocking Capacitor
A blocking capacitor ordinarily is not provided in the input circuit of a harmonic-distortion meter. Hence, the test leads must not be connected to the plate of an amplifier tube or other source of DC voltage. The input circuit is commonly a 500-ohm potentiometer, and is suitable for connection to low-impedance sources only. If a blocking capacitor is required, it must be large enough to pass the lower audio frequencies without attenuation. For example, to couple a 60-cycle signal into a 500 ohm potentiometer with only 10% loss requires a coupling capacitor of approximately 500 mfd.
--U-17
To Measure the Intermodulation Distortion of an Amplifier Equipment: IM distortion meter.
Connections Required: Connect equipment as shown in Fig. 33.
Procedure: Set load switch of IM meter to terminate amplifier correctly. (If IM meter does not have load facilities, an external load resistor must be provided.) Set IM test signal to a desired level not exceeding the rated maximum power output of the amplifier. Preliminary IM tests are usually made at the maximum rated output. Adjust IM distortion meter control to the set-level reference position. Switch the IM distortion meter to %IM on the function dial. Advance range switch as required for ½ or 1/3 full-scale reading.
Evaluation of Results: Compare percentage of IM distortion on meter scale with value specified by receiver manufacturer.
Note that IM distortion often increases rapidly if the maximum rated output of the amplifier is exceeded.

Fig. 33. Test setup.
NOTE 20
Conventional Method of Measuring Harmonic Distortion Not Always Accurate
The conventional method of measuring harmonic distortion is reasonably accurate when the distortion voltage has a sine waveform. On the other hand, if the distortion voltage is nonsinusoidal, the total harmonic distortion indication may be greatly in error. Hence, intermodulation measurements are preferred over conventional harmonic-distortion measurements.
NOTE 21
No Correlation Between Distortion Figures Obtained by Total Harmonic Distortion and Intermodulation Test Methods
An amplifier with practically no intermodulation distortion can have considerable harmonic distortion.
There is no known basis of comparison between the figures obtained by the two methods. Hence, a thorough test of amplifier distortion must include both methods. Each is helpful in comparing the performance of other amplifiers.
NOTE 22
Instruments With Full-Wave Contact Rectifiers Indicate AC Voltages Which Depend Upon Waveform
For accurate measurements, the effect of the waveform must be observed on readings of instruments having contact rectifiers. The values shown in Fig. 34 are those indicated by meters with full-wave contact rectifiers.
The pointer indicates the effective value on the scale. The meter movement responds to the average value of the waveform. The waveforms illustrated (sine, triangular, and square) have equal peak voltages.
On the other hand, note how the indicated (effective) values differ. In general, meters with contact rectifiers indicate true rms voltages for pure sine waves only.
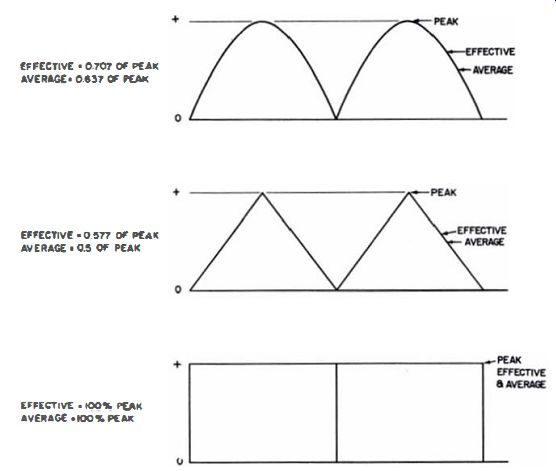
Fig. 34. The peak, effective, and average value, of various waveform,
when palled through equipment using full-wave contact rectifiers.
NOTE 23
Mixture of Second Harmonic With Fundamental Gives Some Result as Clipping the Fundamental
Clipping a sine wave results in the generation of even harmonics. This fact can be readily demonstrated by mixing a fundamental with a second harmonic voltage. as from a pair of audio oscillators. The mixed waveform (Fig. 35) has the shape of a fundamental that has been clipped while passing through an amplifier.
Whether second-harmonic distortion is noticeable or not depends upon the amplifier input signal. A pure sine wave can undergo considerable second-harmonic distortion before the listener finds the distortion objectionable. On the other hand, if two sine-wave voltages are applied to the amplifier, a relatively small amount of second-harmonic distortion will become objectionable.
The difference is due to generation of intermodulation frequencies by the two sine-wave voltages while passing through the amplifier.
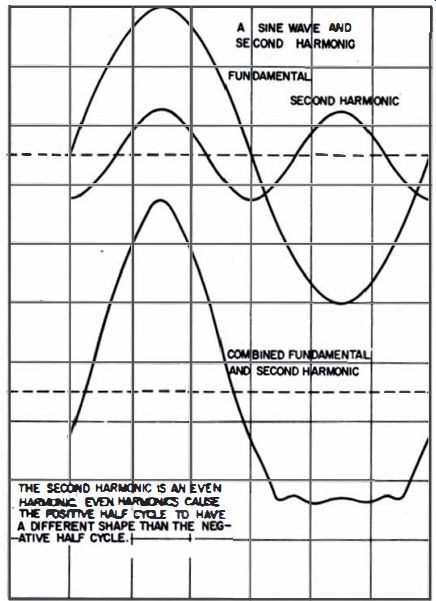
Fig. 35. A fundamental line wave distorted by the second harmonic.
NOTE 24
How Amplitude Nonlinearity Caules Intermodulation Distortion
Intermodulation is the modulation of one frequency by another frequency.
It occurs whenever the amplitude is nonlinear. The nonlinearity is not necessarily in an amplifier tube or transistor. Speakers. for example, have amplitude nonlinearity, particularly when operated at high output.
A basic example of intermodulation occurs when a waveform is clipped, as illustrated in Fig. 36. This wave form consists of two frequencies 60 and 2,000 cycles. The ,2000-cycle voltage is reduced in amplitude during the clipping interval, and sideband frequencies are generated.
The 2,000-cycle tone from the amplifier is mixed with a 2,060- and a 1,940-cycle frequency. These intermodulation frequencies are more objectionable to the listener than harmonic-distortion frequencies.
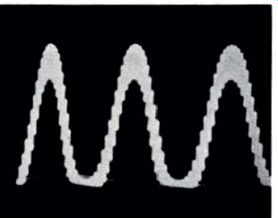
Fig. 36. A waveform with intermodulation distortion.
--U-18
To Determine Whether the Output Signal From an Amplifier Is in Phase or Out of Phase with the Input Signal Equipment: Audio oscillator, oscilloscope, terminating resistor, 10K resistor, 1K resistor, and 100K potentiometer.
Connections Required: Connect equipment as shown in Fig. 37.
Procedure: Apply a medium-level signal, such as 1,000 cycles, to the amplifier. Vary the potentiometer adjustment while watching the scope pattern.
Evaluation of Results: If adjusting the pot reduces the vertical deflection to zero, the output signal is 180 degrees out of phase with the input signal. On the other hand, if the vertical deflection is not reduced to zero (no null point on the pot) , the output signal is in phase with the input signal.
When one is assembling units for a stereophonic amplifier, this test is useful for phasing the speakers correctly. An audio amplifier supplies an output signal that is either in phase or 180 deg out of phase with the input signal. The output phase depends upon the number of stages and the types of circuits in the amplifier.
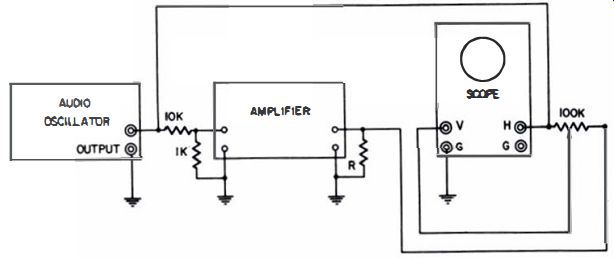
Fig. 37. Test setup.
NOTE 25
Direct-Reading Phase-Shift Meter
A direct-reading phase-shift meter is a simple device using the typical circuit shown in Fig. 38. This instrument has a special scale calibrated in degrees of phase shift. To use the instrument, feed the signal input of an amplifier under test to the Signal 1 terminals. Feed the output signal from the amplifier to the Signal 2 terminals. Adjust the attenuators of the phase-shift meter to give equal readings when the switch is turned from position 1 to position 2. Throw the switch to position 3. The reading on the meter scale at this position is the degrees of phase shift.
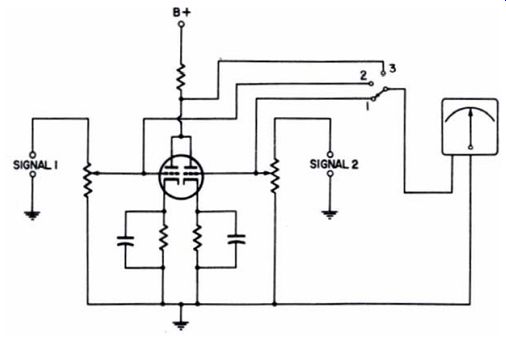
Fig. 38. Typical circuit configuration for a direct-reading phase-shift
meter.
--U-19
To Make a Square-Wave Test of an Audio Amplifier
Equipment: Square-wave generator, oscilloscope, switch or clip lead, and terminating resistors.
Connections Required: Connect equipment as shown in Fig. 39.
Procedure: Adjust output of square-wave generator to approximately the normal operating level of amplifier. Tune generator to a low frequency, such as 50 cycles. Observe output and input waveforms on scope screen, by throwing the switch from position 1 to position 2. Repeat test, at progressively higher frequencies, to approximately 10 khz.
Evaluation of Results: A good amplifier will not show appreciable ringing or overshoot at any square-wave frequency. In almost any amplifier, tilt will occur at very low test frequencies, and corner rounding will occur at very high test frequencies.
NOTE 26
Overshoot and Ringing of Amplifier Should Be With Reference to Rise Time of Square-Wave Generator
The amount of overshoot and ringing in an audio amplifier depends greatly upon the rise time of the square-wave generator. U the generator has a slow rise time, the amplifier will be free from overshoot and ringing. On the other hand, the same amplifier can overshoot and ring strongly when tested with a generator having a fast rise time.
Hence, a statement that an amplifier has an overshoot of 10% needs to be correlated with the rise-time figure of the square-wave generator.
The amplifier should be tested at a rise time corresponding to the minimum rise time of transients in the signals normally handled by the amplifier. This is determined primarily by the frequency response or bandwidth of the signal source, whether it is a record player, a tape recorder, a wire recorder, an instrument pickup, or an FM or AM receiver.
--U-20
To Localize Distorting Stage By Signal-Injection Method
Equipment: Audio oscillator, blocking capacitor, and harmonic distortion meter.
Connections Required: Connect equipment as shown in Fig. 40. Procedure: First measure the total harmonic distortion for the complete amplifier, in the usual manner. If the distortion figure is high for the particular amplifier, proceed with signal-injection tests. Stage-by-stage tests can often be made in order to localize the source of distortion. Connect a blocking capacitor in series with the audio-oscillator output lead; then check progressively from grid to grid, as indicated in the diagram. The output voltage from the audio oscillator should be adjusted in each case to provide the same Set Level reading on the harmonic-distortion meter.
Evaluation of Results: The signal-injection method permits the increased distortion contributed by each stage in the amplifier to be measured. Thus, a stage which contributes excessive distortion can be localized.
The signal-injection method becomes uncertain in amplifiers having over-all feedback, because the impedance of the audio oscillator output cable disturbs the normal input voltage to the grid.
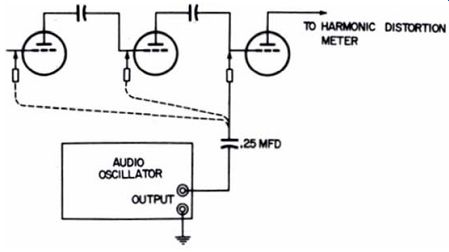
Fig. 40. Signal-injection method for locating the distorting stage.
NOTE 27
Signal Tracing Can Be Accomplished With Overall Feedback Loop Opened
When a scope is used to signal-trace an amplifier, a faulty stage can sometimes be located more easily by opening the over-all feedback loop.
The gain goes up; the input signal to the amplifier must be reduced accordingly, to avoid overload. Disconnecting the over-all feedback loop also increases the distortion. In a typical amplifier the distortion figure doubles whenever the feedback loop is opened. Keep this in mind when checking the amplifier.
--U-21
To Make a Tone-Burst Test of an Amplifier
Equipment: Audio oscillator, electronic switch, and oscilloscope.
Connections Required: Connect equipment as shown in Fig. 41A.
Procedure: Tune audio oscillator to a suitable test frequency, such as 10 khz. Adjust electronic switch to supply tone bursts of the approximate form shown in Fig. 41B. Observe pattern on scope screen for distortions of tone-burst waveshape.
Evaluation of Results: The tone-burst signal places more exacting demands upon the ability of the amplifier to reproduce transients than the ordinary square-wave test does. The tone burst signal shows the amplifier response to a suddenly applied AC voltage as well as to a suddenly applied DC voltage.
Tone-burst tests are more informative when the tone-burst frequency is varied over a wide audio range. This helps to locate regions of faulty response in crossover and feedback networks. It is also good practice to check the tone-burst pattern for distortion at low-, medium-, and high-input signal levels.
(A) Test setup.
(B) Typical tone-burst signal.

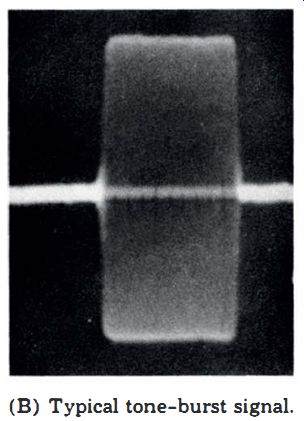
Fig. 41. Tone-burst test of an amplifier.
NOTE 28
Double-Ended Scope Required When Both Sides of Voice Coil Operate Above Ground
In some audio amplifiers, both ends of the voice coil operate above ground. A single-ended scope cannot be used to check the voltage across the voice coil, because the amplifier may be seriously disturbed or damaged. A double-ended scope must be used instead.
--U-22
To Check on Amplifier for Parasitic Oscillation
Equipment: Audio oscillator, oscilloscope, and terminating resistor.
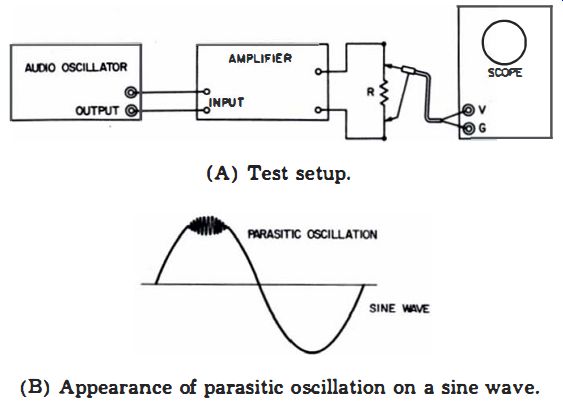
Connections Required: Connect equipment as shown in Fig. 42A.
Procedure: Adjust audio-oscillator controls for low-frequency output, such as 60 cycles, and low-level input to the amplifier.
Adjust amplifier controls for normal operation. Adjust scope controls to display sine-wave pattern on screen. Then advance output voltage from audio oscillator, and reduce attenuator setting of scope. Observe pattern for "ballooning" at any point, particularly on the peaks (Fig. 42B). Repeat test at several levels until the amplifier is delivering its maximum rated output. Repeat the test again at medium and at high audio frequencies.
Evaluation of Results: When a "balloon" or "bulge" appears in the trace, parasitic oscillation is occurring during the "bulge" interval. This oscillation is most likely to occur when grid current flows in an amplifier circuit.
A complete check for parasitic oscillation can be made by using a speaker load instead of a resistive load for the amplifier, and by repeating the test for different settings of the amplifier controls. Parasitic oscillation can usually be eliminated by connecting 50- to 500-ohrn resistors in series with the tube electrodes in the circuit in which the oscillation is occurring.
(A) Test setup.
(B) Appearance of parasitic oscillation on a sine wave.
Fig. 42. Checking an amplifier for parasitic oscillation.
NOTE 29
Signal Tracing an Amplifier With Parasitic Oscillation
Parasitic oscillation causes "rattle" in the sound. To localize the tube causing the parasitic oscillation, use a scope to check through the amplifier from grids to plates of successive tubes. Often, the output stage is the offender. It is advisable to use a low capacitance probe with the scope, because the input capacitance of a direct cable can be sufficient to "kill" the parasitic oscillation and falsely indicate that the stage is functioning normally.
--U-23
To Measure the Output Impedance of an Amplifier
Equipment: Audio oscillator, variable power rheostat, and AC VTVM. Connections Required: Connect equipment as shown in Fig. 43.
Procedure: Set switch to position 1 and amplifier controls to normal operating positions. Adjust audio-oscillator output to avoid excessive output voltage, which could cause arc-overs or breakdown. With VTVM switched to AC function, note scale reading. Then set switch to position 2. Adjust rheostat for half of first scale reading.
Evaluation of Results: Measure resistance of rheostat. This resistance is equal to the output impedance of the amplifier.
For a comprehensive test, repeat the foregoing procedure for low-, medium-, and high-frequency output from the audio oscillator. This method of measuring output impedance is based upon the connection of the load rheostat in series with the amplifier output impedance. Thus, the rheostat and the output impedance are a voltage divider. When both values are equal, the VTVM will read half voltage.

Fig. 43. Test setup.
--U-24
To Measure the Damping Factor of an Amplifier Equipment: Audio oscillator, AC voltmeter, and IS-ohm wire-wound variable resistor.
Connections Required: Connect output from audio oscillator to input terminals of amplifier. Connect AC voltmeter across amplifier output terminals, as shown in Fig. 44. In second part of test, also connect resistor across amplifier output terminals.
Procedure: Apply relatively low output voltage from audio oscillator to amplifier (to avoid overload and possible arc-over on open-output circuit). A 50-cycle test frequency is suitable.
Observe voltmeter reading. Next adjust the wirewound resistor to the nominal impedance of the amplifier. Connect resistor across amplifier output terminals, and again note meter reading. The nominal impedance of the amplifier is the value of load into which the amplifier normally works.
The recommended nominal impedance is often marked on the amplifier. In any event, the nominal impedance is the value of the actual load impedance used with the amplifier.
Evaluation of Results: The damping factor of the amplifier is equal to the full-load voltage divided by the difference between the no-load and the full-load voltages.

Fig. 44. Test setup.
--U-25
To Measure the Input Impedance of an Amplifier
Equipment: Audio oscillator, rheostat, SPDT switch, AC VTVM, and terminating resistor.
Connections Required: Connect equipment as shown in Fig. 45.
Procedure: Set switch to position 1. Adjust amplifier controls for normal operation. Note reading on meter scale. Then set switch to position 2. Adjust rheostat for half of first meter reading.
Evaluation of Results: Measure the rheostat resistance. This is the amplifier input impedance.
In transistor amplifiers the output resistance of the common circuits is changed by the generator and rheostat resistance. Hence, the load resistor chosen must terminate the amplifier correctly, taking into account the generator and rheostat resistance. The rheostat resistance and the generator resistance add together to increase the output resistance of a transistor amplifier.
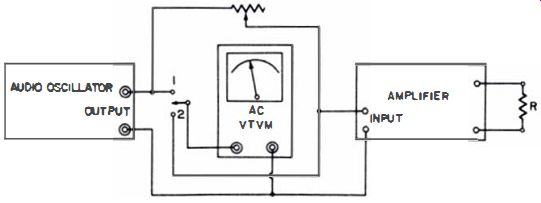
Fig. 45. Test setup
NOTE 30
Amplifier Input Impedance Often Differs at Low and High Frequencies
The input impedance of an amplifier often changes with frequency. Hence, for a comprehensive test of input impedance, measure at a low, a medium, and a high frequency. As a rule we are concerned with only the magnitude of the input impedance; we do not break the input impedance down into its resistive and reactive components. However, it is the reactive component that causes the input impedance to change with frequency.
--U-26
To Measure the Noise Level of an Amplifier
Equipment: Audio oscillator, harmonic-distortion meter, and terminating resistor.
Connections Required: Connect equipment as shown in Fig. 46.
Procedure: R should have the recommended value for terminating the amplifier. The voltage across R can be read directly on most harmonic-distortion meters. To measure the noise level of the amplifier, select a suitable reference power level for the amplifier. For example, this might be 4 watts or 5.7 volts across 8 ohms. Note db reading on distortion meter scale. Then turn audio oscillator off. Switch distortion meter to higher sensitivity position, to obtain db reading of noise-voltage output from the operating amplifier. Again note db reading.
Evaluation of Results: Take the ratio of the two db readings. This is the noise level of the amplifier. It is customarily expressed as so many db below so many watts (for example, 61 db below 4 watts). Most distortion meters in audio work have contact rectifiers, with a meter that responds to the average value of the rectified waveform. See Note 22.

Fig. 46. Test setup.
NOTE 31
Relationship of Dbm and VU Measurements
A dbm measurement is a decibel measurement of a sine-wave voltage, made with a db meter having a reference level of 1 milliwatt in 60 ohms. A VU (volume unit)measurement is a decibel measurement of a complex voltage. It is made with a db meter having a reference level of 1 milliwatt in 60 ohms, and with such damping that pointer overshoot is not greater than 1.5% in response to a suddenly applied voltage. That is, a dbm measurement is made on a steady sinewave signal; thus, meter damping is not important. On the other hand, a VU measurement is made on musical or vocal waveforms; meter damping must be controlled before a valid level indication can be obtained.
As a general rule, most harmonic distortion meters have a dbm scale.
The db scale (or scales) on a harmonic-distortion meter may have a zero-db reference level of 1 milliwatt in 60 ohms. When this reference level is used, the scale readings are often called dbm instead of db.
The term dbm refers to the reference level.
NOTE 32
Correction of Db Reading When Measuring Across Different Load Impedance.
The db scales on a harmonic-distortion meter can be used in measuring db gain or loss across any load impedance, provided suitable correction factors are applied. The individual measurements are not necessarily correct. However, the difference between the two db measurements will be the correct number of db, after a suitable correction factor is taken from the chart in Fig. 47.
Example: The db scales of the harmonic-distortion meter are calibrated for a reference level of 1 milliwatt in 60 ohms. If we measure db at the input and output of an amplifier, we might find 1 db at the input terminals and 1 db at the output terminals. If the input impedance of the amplifier is 100,00 ohms and the output impedance is 500 ohms, the ratio of the impedance is 200-to-1.
From the chart, we see that 23 db must be added to the difference between the two db readings (1-1+23 = 23-db gain).
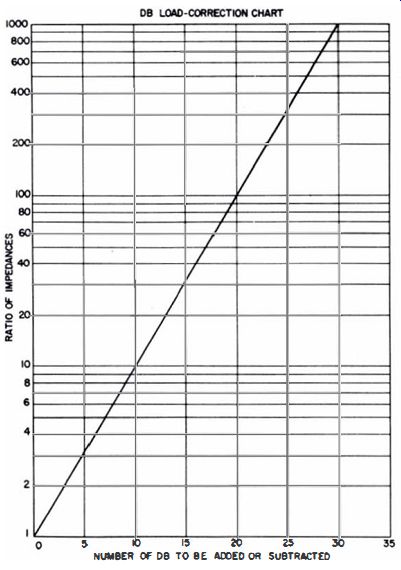
Fig. 47. Db load-correction chart.
--U-27
To Monitor on Audio Amplifier for Circuit Loading During Voltage Checks
Equipment: Oscilloscope, VTVM, and audio oscillator.
Connections Required: Connect equipment as shown in Fig. 48.
Procedure: Observe scope pattern before and after VTVM probe is applied at a test point in the amplifier circuit.
Evaluation of Results: Any change in the scope pattern indicates the amplifier operation is disturbed by application of the VTVM.
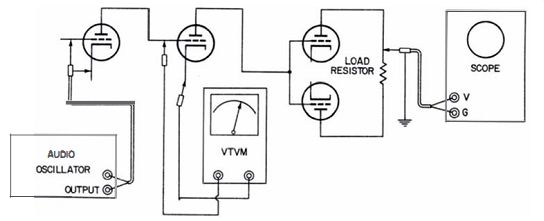
Fig. 48. Test setup.
--U-28
To Use Two Audio Oscillators as Signal Sources for Intermodulation-Distortion Tests
Equipment: Two audio oscillators (at least one with double-ended output) , four 300-ohm resistors, and an oscilloscope.
Connections Required: Connect resistors into a bridge circuit.
Connect audio oscillators to bridge, as shown in Fig. 49.
Procedure: Tune audio oscillators to test frequencies chosen. The low-frequency signal may be 50 to 100 cycles, and the high frequency signal may be 1,000 to 6,000 cycles. (In another method, two high frequencies are used, such as 3,000 and 3,200 cycles.) Set the high-frequency signal to one-fourth the voltage of the low-frequency signal, or use equal voltages.
Evaluation of Results: With a scope, check the output waveform from the bridge, in order to observe the voltage ratios of the two signals.
The bridge circuit is particularly useful for mixing when the two generators are set to approximately the same frequency. The bridge minimizes the tendency of the generators to "pull," to "lock," or to supply a distorted waveform. One generator must have double-ended output, to prevent the bridge from being grounded out.
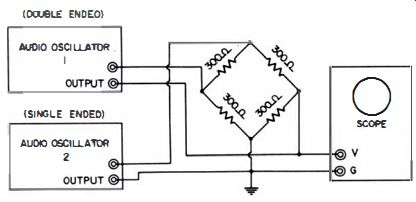
Fig. 49. Bridge connections used to minimize "pulling" and "locking" of
two audio oscillators.
NOTE 33
Audio Analyzers Combine Functions of Several Testers
Instead of individual audio test instruments, an audio analyzer can be used to minimize the number of test leads and connections required to check out an amplifier. A typical audio analyzer is a package unit containing an audio VTVM, audio wattmeter, intermodulation meter, and two fixed-frequency signal sources. Standard terminating resistors are provided inside the analyzer. The VTVM has dbm scales.
Thus, practically all necessary amplifier tests, except harmonic-distortion measurements, can be made with the one instrument.
To Measure the Hum and Noise Output Voltage from an Amplifier
Equipment: Audio VTVM, and resistor with a value equal to the normal source impedance for amplifier.
Connections Required: Connect equipment as shown in Fig. 50.
Procedure: The amplifier should be normally loaded by a speaker, or by a terminating resistor of a suitable value. Set amplifier controls to normal operating positions. Observe reading on scale of audio VTVM. The input resistor, if of high value, is susceptible to hum pickup from stray fields. This can result in abnormally high meter readings.
Evaluation of Results: The meter reading is useful chiefly as a basis for comparing different amplifiers. It can be stated as the number of db below rated maximum power output of the amplifier, noting also the output load impedance and power output .
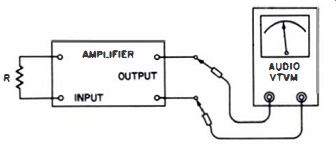
Fig. 50. Test letup.
NOTE 34
Amplifier Input Impedance May Differ from Recommended Source Impedance Value
It is desirable to operate high-fidelity amplifiers from a driving source having an impedance equal to the amplifier input impedance. On the other hand, higher gain can often be obtained by mismatching the driving source impedance to the amplifier input impedance. Thus, the rated in put impedance for some amplifiers may differ from the measured input impedance. To determine whether impedance mismatching causes appreciable distortion, check the frequency response and total harmonic distortion, using impedance-transfer pads, as depicted in Fig. 51.
(A) Increasing the source resistance. (B) Decreasing the source resistance.

Fig. 51. Changing the source resistance of the audio oscillator.
NOTE 35 How to Measure the Source Resistance of an Audio Oscillator
The source resistance of an audio oscillator can be easily measured, as shown in Fig. 52. The potentiometer is first opened and the reading noted on VTVM. Then the potentiometer is connected and adjusted for half the original voltage reading.
The resistance of the potentiometer is then equal to the source or internal resistance of the audio oscillator. This measurement must often be made if the attenuator setting is changed, because some audio oscillators do not have a constant source resistance at all attenuator settings.
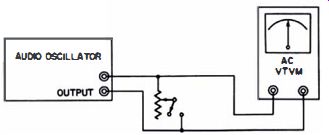
Fig. 52. Test setup.
NOTE 36
Two Impedance. Can Be Matched to Each Other With an L Pad L pads (Fig. 53) can be used to match two impedances to each other in an audio circuit. The high impedance to be matched is R,; the low impedance is R2. The series resistor in the L pad is R.; the shunt resistor is R The required values of R. and R. are found from the basic formulas:
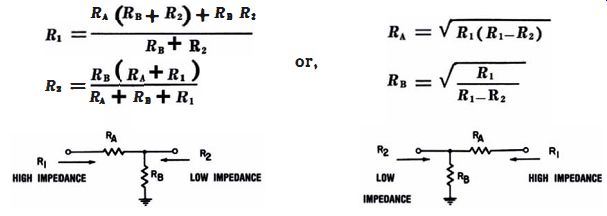
Fit. 53. L pad., used for impedance matching.
--U-30
To Check the Frequency Response of an Amplifier With Transformer Input
Equipment: Audio oscillator, matching resistor, terminating resistor, AC VTVM, and switch or clip lead.
Connections Required: Connect resistor of suitable value in series or shunt with audio-oscillator output, to match input impedance of amplifier (see Figs. 54 and 51). Connect terminating resistor of rated value across amplifier output terminals. Connect VTVM and switch, as shown in Fig. 54.
Procedure: Adios audio-oscillator output for maximum rated power output of amplifier. Make first test at a low frequency, such as 50 cycles. Switch VTVM from position 1 to position 2 for comparative readings. Then increase audio-oscillator frequency in progressive steps, each time checking the input voltage (switch in position 2). If necessary, reset the audio oscillator attenuator in order to maintain the same input voltage on each test.
For a more complete frequency checkout, repeat the foregoing procedure at medium- and low-output levels.
Evaluation of Results: The output voltages can be plotted against frequencies on a sheet of graph paper. In this way an overall picture of the amplifier frequency response can be obtained. Providing correct source impedance from the audio oscillator to a transformer input amplifier applies also to total harmonic-distortion and intermodulation tests. Otherwise, the test results may be misleading. In general, the apparent distortion of a transformer input amplifier increases as the impedance of the driving source differs from the matching value.
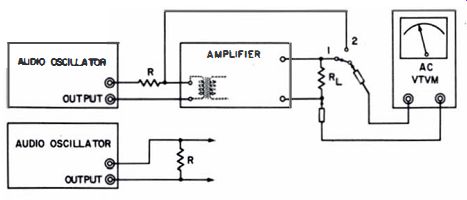
Fig. 54. Test setup.
--U-31
To Check an Amplifier for Cross Talk Between Inputs
Equipment: Audio oscillator, AC VTVM, and terminating resistor.
Connections Required: Terminate amplifier with the proper load.
Connect VTVM across load as shown in Fig. 55. In first test, connect audio-oscillator output to input 1 of amplifier. In second test, connect audio-oscillator output to input 2 of amplifier.
Procedure: With audio oscillator connected to input 1, switch amplifier to input 1. Advance output from audio oscillator for rated power output from amplifier. Tune audio oscillator to 1 khz. Test for cross talk by switching amplifier to input 2.
Observe meter reading, if any. In second test, connect audio oscillator to input 2. With amplifier switched to input 2, adjust the audio-oscillator output for rated power output from amplifier. Test for cross talk by switching amplifier to input 1. Observe meter reading, if any.
Evaluation of Results: Cross talk is given by the number of db difference between meter readings when the amplifier is switched from one input to the other.
Some amplifiers are designed to operate with one input shorted when the other input is in use. Other amplifiers have signal sources connected to each input, so that one input is not shorted when the other is in use.

Fig. 55. Test setup.
--U-32
To Check for Cross Talk Between Stereophonic Amplifiers
Equipment: Audio oscillator, two terminating resistors, and AC VTVM.
Connections Required: Connect equipment as shown in Fig. 56.
Procedure: Adjust audio oscillator for rated power output from amplifier. With audio oscillator connected to input A, run a frequency response for amplifier A (VTVM connected to output of amplifier A). Then connect VTVM to output of amplifier B. Without changing the audio-oscillator output, note the output voltage (if any) from amplifier B, and run a frequency response. Repeat the procedure with the audio oscillator output connected to input B.
Evaluation of Results: The cross-talk figure is the number of db difference between the two VTVM readings at the frequency of maximum cross talk.
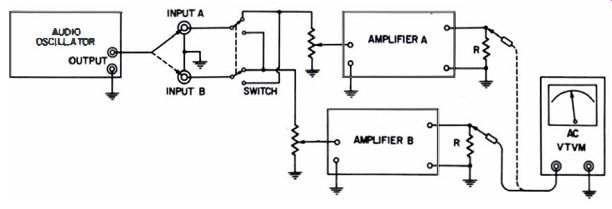
Fig. 56. Test setup.
--U-33
To Check the Load Tolerance of an Amplifier
Equipment: Audio oscillator, assortment of power resistors to terminate Amplifier, and AC VTVM.
Connections Required: Connect equipment as shown in Fig. 57.
Procedure: Terminate the amplifier with the rated resistance.
Adjust level of audio-oscillator signal to provide maximum rated output from the amplifier. Run a frequency response.
Then change the rated load resistance (R) 20%. Again adjust the audio oscillator for maximum rated amplifier output.
Run a frequency response with the changed load resistance.
Repeat test with rated load resistance 40% higher and 40% lower. If amplifier has several output impedances, the test can be repeated at each output.
Evaluation of Results: In general, the frequency response of an amplifier is best when the amplifier is working into its rated load resistance. In some instances, however, a variation of the recommended resistance will improve the frequency response because of component tolerances.
A speaker provides a varying load value at different frequencies. Accordingly, if a speaker is used to load the amplifier, the results of the frequency run will usually be poorer than if a resistive load is used. The impedance of a speaker at various frequencies is affected by the type of enclosure.

Fig. 57. Test setup.
--U-34
To Check the Regulation of the Power Supply in an Amplifier
Equipment: Square-wave generator, oscilloscope, and terminating resistor.
Connections Required: Connect equipment as shown in Fig. 58.
Procedure: Adjust square-wave generator for normal input voltage to amplifier. Tune generator to low frequency such as 20 cycles. Observe the pattern on the scope screen.
Evaluation of Results: The amplitude of any distorted squarewave pattern on the scope screen shows how incomplete the regulation of the power supply is. Note, however, that complete regulation is not required for satisfactory amplifier operation. The test is useful for comparison, when poor regulation is suspected as a cause of distortion.
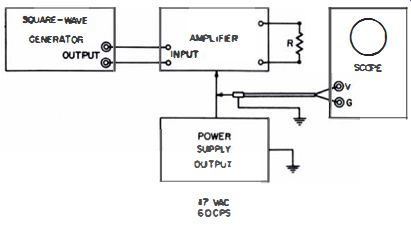
Fig. 58. Test setup.