--U-35
To Determine the Line-Voltage Tolerance of an Amplifier
Equipment: Audio oscillator, harmonic-distortion meter, Variac, and terminating resistor.
Connections Required: Connect equipment as shown in Fig. 59.
Procedure: Set Variac for 117 volts output. Adjust audio-oscillator level to obtain rated power output from amplifier, as indicated on VTVM range of harmonic-distortion meter.
Tune audio oscillator to 400 cycles. Measure harmonic distortion. Then reduce output voltage from Variac in steps of 10%. Readjust audio-oscillator output for rated power output from amplifier. Recheck harmonic distortion on each step.
Evaluation of Results: Harmonic distortion generally increases when the amplifier supply voltage is reduced beyond a certain level. The line-voltage tolerance is the amount the amplifier supply voltage can vary before the harmonic distortion level increases appreciably.
For a more complete test, make a frequency run on each step.
(Use the VTVM function of the harmonic-distortion meter as an output indicator.)
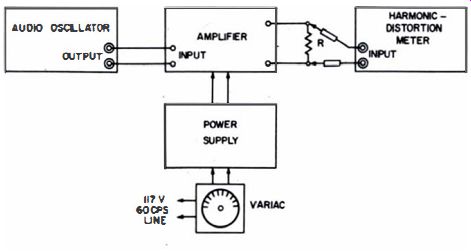
Fig. 59. Test setup.
NOTE 37
Automatic Line? Voltage Regulating Transformer
Stabilizes Amplifier Operation
When an amplifier is susceptible to line-voltage variation and must be operated with varying supply voltage, an automatic line-voltage regulating transformer is helpful. The transformer must be of the automatic saturable-reactor type. An adjustable transformer is of little value, because it requires attention each time the line voltage changes. The transformer must also have an adequate power-output rating for the amplifier. When noise is present in the line and interference feeds through into the amplifier circuits, an automatic line-voltage regulating transformer will also help suppress the noise.
--U-36
To Check the Amplitude Linearity of an Amplifier Equipment: Audio oscillator, AC VTVM, terminating resistor, and switch or clip lead.
Connections Required: Connect equipment as shown in Fig. 60. Procedure: Set audio oscillator to a very low output, and tune to 400 cycles. Measure input voltage (position 2). Then measure the output voltage at position 1. Repeat test as output from audio oscillator is varied in equal steps, up to the maximum rated output of the amplifier.
Evaluation of Results: If the amplifier is free from amplitude distortion, the same ratio of output/input readings will be obtained in each test.
This is a useful check when a harmonic-distortion or IM meter shows excessive signal distortion. If amplitude distortion is present, check the resistances and operating voltages in the amplifier circuits.
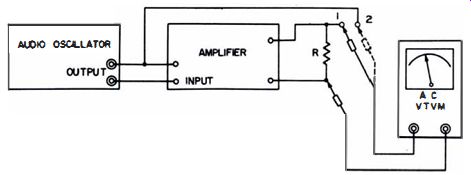
Fig. 60. Test setup.
NOTE 38
Amplitude Distortion Sometimes Caused by Poor Power-Supply Regulation
When the power-supply regulation is poor, the Class-AB or -B amplifier tubes operate at lower plate and screen voltages, since current drain increases with an increasing level.
Bias voltages often change also. The amplification factor of some tube types varies with supply-voltage changes. In turn, amplitude nonlinearity results. Hence, when amplitude nonlinearity is found, do not forget to check the regulation of the power supply. Regulation can be improved by using larger filter and decoupling capacitors.
NOTE 39
Staircase Generator Provides a Rapid Amplitude-Distortion Check
Amplitude-distortion checks by input-output measurements are time consuming. Therefore, a busy shop may prefer to use a staircase generator. This generator supplies the waveform shown in Fig. 51A. The voltage output has a square waveform, and increases in amplitude equally at each step. A scope is used as an indicator at the amplifier output. If the amplifier is free from amplitude distortion, the output amplitude will increase equally at each step. If amplitude nonlinearity is present, the steps of the output waveform will be unequal in height, as shown in Fig. 61B.
(A) Output waveform from staircase generator.
(B) Typical amplifier output waveform when amplitude distortion is present.
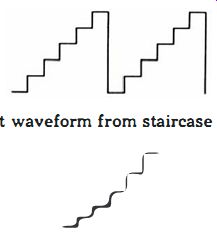
Fig. 61. Staircase generator may be used to check for amplitude distortion
in an amplifier.
To Measure the Effect of a Reactive Load on an Amplifier
Equipment: Audio oscillator, terminating resistors, assorted capacitors and inductors, and harmonic-distortion meter.
Connections Required: Connect equipment as shown in Fig. 62.
Procedure: Adjust audio oscillator for maximum rated power output from amplifier. Measure the harmonic distortion without the reactor in the load circuit. Check at a low, a medium, and a high frequency. Then connect the reactor in the load circuit and repeat the measurement. Finally repeat tests with larger values of reactors, to determine the tolerance of the amplifier to reactive loads. The total harmonic-distortion test just described should be supplemented by a frequency run and by IM distortion and square-wave tests. They will provide a complete evaluation of the amplifier tolerance to reactive loads. In certain feedback amplifiers, reactive loads also affect the amplitude linearity.
Evaluation of Results: The total harmonic-distortion rating of many amplifiers is for resistive loads only. The inclusion of small reactances can give some amplifiers a higher total harmonic-distortion figure than the rated value. On the other hand, other amplifiers are quite tolerant to reactive loads.
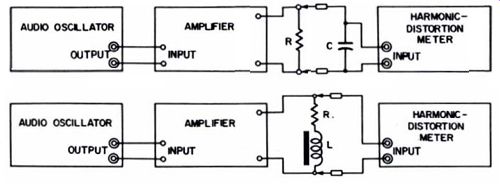
Fig. 62. Test setup.
To Make a Peak-Overload Test of an Amplifier
Equipment: Oscilloscope, terminating resistor, capacitor, and square-wave generator that can provide an unsymmetrical square-wave (pulse) output.
Connections Required: Connect equipment as shown in Fig. 63.
Procedure: Adjust output from generator to provide 50% greater peak voltage across load resistor than for rated power output.
Tune generator to a frequency differentiated by the capacitor, so that the amplifier is driven with a sharply peaked pulse. Observe pattern on scope screen.
Evaluation of Results: The same waveshape should be observed at the input and output of the amplifier. If the spike is clipped or changed in shape, the amplifier does not have peak-overload capability, and cannot reproduce musical transients without distortion.
This type of test is preferred over the steady-state test of peak overload capability, because the pulse simulates actual requirements. Critical listeners object to amplifiers which clip peak overloads during the reproduction of musical passages, although average listeners often overlook this form of distortion.
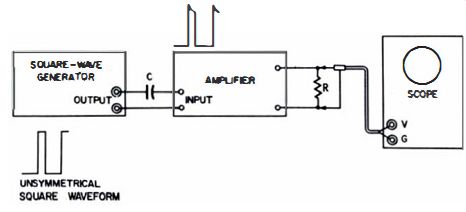
Fig. 63. Test setup.
NOTE 40
Differentiated Square Wave Can Be Used in Peak-Overload Test
An ordinary square-wave generator can be used to make a peak-overload test if an unsymmetrical square-wave generator is not available. Adjust the value of C (Fig. 63) to provide a sharply peaked waveform, as illustrated in Fig. 64. Follow the procedure outlined in U38.
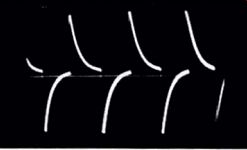
Fig. 64. A differentiated square wave.
-- To Use an Audio Analyzer as a Signal Source in a Harmonic-Distortion Test Equipment: Audio analyzer, harmonic-distortion meter, and terminating resistor.
Connections Required: Connect equipment as shown in Fig. 65.
Procedure: Switch output signal from audio analyzer to Low Frequency Test. Measure total harmonic distortion with the harmonic-distortion meter, in the usual manner. Then switch output signal from audio analyzer to High Frequency Test.
Again measure total harmonic distortion with the distortion meter, in the usual manner.
Evaluation of Results: This method gives measurements of total harmonic distortion at two frequencies only, e.g., 60 cycles and 6 khz. However, it is quite useful when an audio oscillator is not available.
Some audio analyzers do not provide low-distortion test signals for IM testing. Hence, before using these signals for total harmonic-distortion tests, check the signal purity, as explained in Note 41.

Fig. 65. Test letup.
NOTE 41
Checking and Improving Waveform from Audio Analyzer.
To check the output waveform from an audio analyzer, connect the signal output directly to a harmonic-distortion meter, as shown in Fig. 66A. U the total harmonic distortion is high (e.g., 2% or 3%), it can be reduced considerably by using an RC filter (Fig. 66B). If the improvement is not great enough to test a low-distortion amplifier, use an audio filter, as shown in Fig. 66C. Placing an RC filter ahead of the audio filter (Fig. 66 ) will lessen the burden on the audio filter.
Some audio analyzers have cross talk between the high- and the low frequency signals. One way of killing the cross talk is to pull the high-frequency oscillator tube while using the low-frequency output signal. A low-pass filter or an audio filter will also reduce cross talk to a negligible level. If a reading is objectionably high when the audio-analyzer signal is being checked with a harmonic distortion meter, cross talk can be suspected.
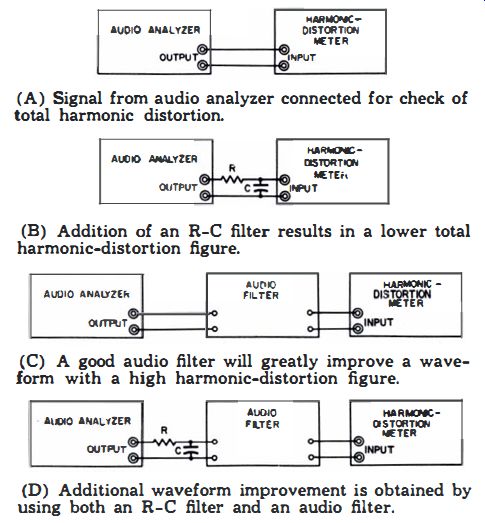
Fig. 66. Improving the output signal from an audio analyzer. (A) Signal
from audio analyzer connected for check of total harmonic distortion. (B)
Addition of an R-C filter results in a lower total harmonic-distortion
figure. (C) A good audio filter will greatly improve a waveform with a
high harmonic-distortion figure. (D) Additional waveform improvement is
obtained by using both an R-C filter and an audio filter.
--U-40
To Measure the Amplifier Input Resistance
Equipment: Audio oscillator, AC VTVM, terminating resistor, and potentiometer (approximately 1 meg for high-impedance amplifiers; or if low-impedance input, approximately 1,000 ohms).
Connections Required: Connect equipment as shown in Fig. 67.
Procedure: Set audio oscillator to a low frequency, such as 60 cycles. Reduce potentiometer resistance to zero, and note meter reading. Then turn potentiometer arm until meter reading drops to one-half.
Evaluation of Results: Disconnect pot and measure its resistance.
This is the input resistance of the amplifier.
The test does not measure the input impedance of the amplifier.
It measures the resistive component of the input impedance, because the test frequency is 60 cycles and the reactive components are negligible.

Fig. 67. Test setup.
--U-41
To Measure the Input Capacitance of an Amplifier
Equipment: Audio oscillator, AC VTVM, terminating resistor, and trimmer capacitor.
Connections Required: Connect equipment as shown in Fig. 68.
Procedure: Tune audio oscillator to approximately 10 khz. Short trimmer capacitor, and note meter reading. Then remove short from trimmer capacitor, and adjust it for one-half the original reading.
Evaluation of Results: Measure trimmer capacitance on a capacitor tester or bridge. This is the input capacitance of the amplifier.
The input capacitance of the amplifier must be distinguished from the input impedance. The input capacitance is the reactive component of the input impedance. The input impedance is a combination of the input resistance and the input capacitance.
The ohms of input impedance will differ at each frequency. For rapid calculation of reactance, a reactance slide rule (like the one manufactured by Shure Brothers) is recommended.

Fig. 68. Test setup.
--U-42
To Measure the Input Resistance and the Capacitance or Inductance of an Amplifier With Transformer Input
Equipment: Impedance bridge and terminating resistor.
Connections Required: Connect equipment as shown in Fig. 69.
Procedure: Turn amplifier on. Adjust bridge controls for impedance balance. Switch bridge to resistive and reactive functions, to determine the input resistance and the value and sign of input reactance.
Evaluation of Results: The measurement is valid for only the test frequency of the bridge and the test-signal level applied by the bridge. However, it is a good, average test.

Fig. 69. Test setup.
--U-43
To Check an AmplifierFor Crossover and Notch Distortion
Equipment: Audio oscillator, oscilloscope, and terminating resistor.
Connections Required: Connect equipment as shown in Fig. 70.
Procedure: Adjust audio oscillator for maximum power output from amplifier, as measured on screen of calibrated scope.
Tune audio oscillator to approximately 3,000 cycles. Observe pattern on scope screen.
Evaluation of Results: Crossover and notch distortion occur near the zero-volt line of the output waveform. Crossover distortion is symmetrical and occurs on each side of a half cycle.
On the other hand, notch distortion occurs on only the negative-going portion of the waveform. Crossover distortion indicates excessive bias on the push-pull output tubes. Notch distortion is caused by the leakage reactance in the output transformer resonating with the stray capacitance in the primary circuit.
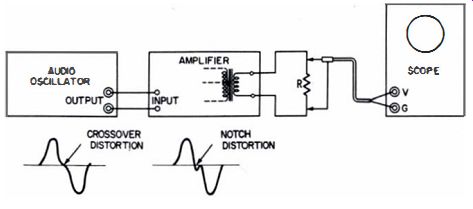
Fig. 70. Test setup.
--U-44
To Test a Phase Inverter for Distortion and Unbalance
Equipment: Audio oscillator, oscilloscope with low-capacitance probe, and terminating resistor.
Connections Required: Connect equipment as shown in Fig. 71.
Procedure: Advance output from audio oscillator for maximum rated output from amplifier. Apply low-capacitance probe at points (1) and (2). Observe waveform and peak-to-peak voltages. Also check at points (3) and (4). Repeat checks at low, medium, and high audio frequencies.
Evaluation of Results: A good sine waveform should be observed.
Peak-to-peak voltages should also be practically the same at the four test points. If distortion or unequal voltages are found, check the associated circuit components.
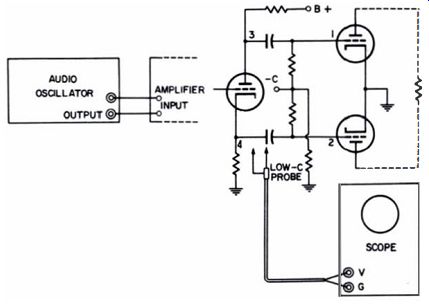
Fig. 71. Typical phase-inverter circuit. Test at indicated points in order
to localize distortion and unbalance.
--U-45
To Measure the Phase Shift Around a Feedback Loop
Equipment: Audio oscillator, oscilloscope (preferably with identical vertical and horizontal amplifiers), and two low-C probes.
Connections Required: Connect equipment as shown in Fig. 72.
Procedure: Adjust audio-oscillator output for normal amplifier operation. Observe scope pattern as audio-oscillator frequency is varied from 60 hz to upper frequency at which no more output is obtained from amplifier.
Evaluation of Results: At certain frequencies the scope will display an inclined line. This shows there is no phase shift through the feedback and amplifier systems. At other frequencies (particularly at high frequencies) , ellipses will be observed. They may open into circles and back into ellipses with opposite inclination. Excessive phase shift causes regeneration or oscillation (positive feedback) and resulting instability. Phase shift can be caused by reactive components anywhere within the feedback loop and amplifier circuit.
Use low-capacitance probes when testing at high frequencies, to avoid misleading indication due to circuit loading.
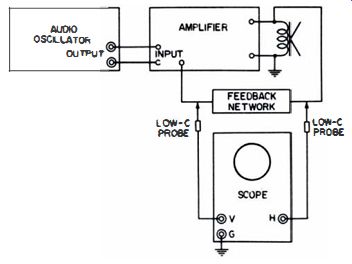
Fig. 72. Test setup.
NOTE 42
Individual Feedback Loops Can Be Opened to Determine Phase Shift of Each
If multiple feedback loops are used in the amplifier in U45, excessive phase shift can be located by opening each loop and observing the change in phase shift. Whenever a feedback loop is opened, the output from the audio oscillator must be reduced to prevent amplifier overload.
--U-46
To Check the Balance of a Phase Compressor
Equipment : Audio oscillator, harmonic-distortion analyzer, oscilloscope, and terminating resistor.
Connections Required: Connect audio-oscillator output to amplifier input terminals. Connect terminating resistor, harmonic-distortion meter, and scope, as shown in Fig. 73.
Procedure: Apply standard test frequency, such as 400 cycles, to amplifier. Adjust audio oscillator for maximum rated output from amplifier. Tune harmonic-distortion meter to eliminate fundamental (400 cycles). Observe scope pattern.
Evaluation of Results: No discernible second-harmonic output should appear in scope pattern. Third- and fifth-harmonic residues will be visible at high scope gain. If second and other even-harmonic residues appear, check the circuit for faulty components causing the unbalance.
The phase-compressor type of output stage has R-C circuitry to cancel even harmonics, just as push-pull transformer coupling cancels even harmonics.
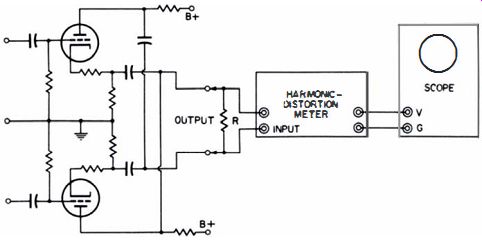
Fig. 73. Test setup.
NOTE 43
Waveshape of Distortion Signal at Output of Harmonic-Distortion Meter Differs from Waveshape in Input Signal
The waveshape of the distortion signal at the output of a harmonic-distortion meter differs from the one at the input. The change in waveshape is caused by phase shift in the filter circuit of the meter. The filter removes the fundamental from the input signal and passes the second harmonic. However, in passing the second harmonic, the filter circuit shifts its phase. The third harmonic is likewise shifted in phase, although not as much as the second harmonic.
Thus, the output signal has phase distortion. In turn, the meter indication is not entirely accurate. The reason is that phase shifts of the components in a complex waveform can vary the reading -10 to +16% in a full-wave contact-rectifier instrument. Fig. 74 shows how phase shift of a third harmonic, with respect to the fundamental, changes the waveshape. To measure the phase shift of a harmonic passing through a harmonic-distortion meter, use the test setup in Fig. 75.
(A) Fundamental and its third harmonic 1800 out of phase.
(B) Fundamental and its third harmonic in phase.
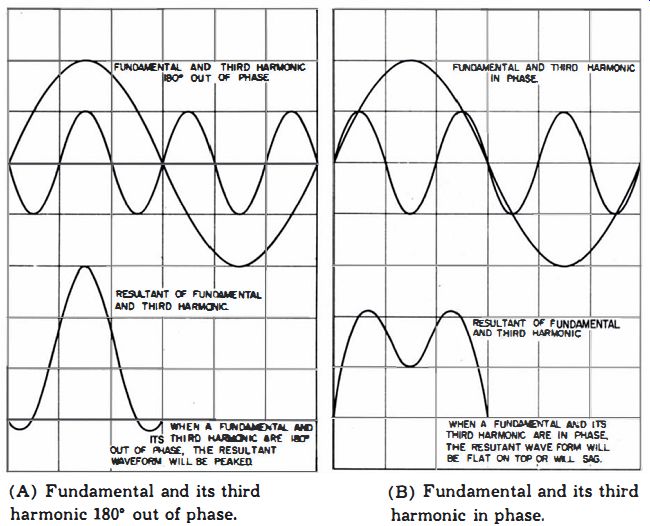
Fig. 74. Phase relationships between the fundamental and third-harmonic
frequencies.
The audio oscillator is tuned to 1000 cycles, for example, and the harmonic-distortion meter is tuned from 2,000 to 8,00 cycles. An elliptical scope pattern shows phase shift.
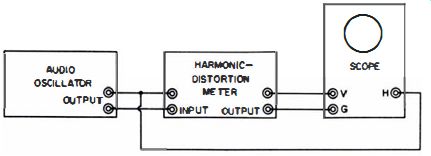
Fig. 75. Test setup.
NOTE 44
Filter Phase Shift in Harmonic-Distortion Meter Can Cause Strong Ringing in Transient Voltages
The phase shift caused by the filter in a harmonic-distortion meter can cause strong ringing in transient voltages. Phase shift is present, even though the filter is tuned to a frequency lower than the fundamental of the transient. Thus, if a 2- khz square wave is applied to a typical harmonic-distortion meter (Fig. 76A), good reproduction of the waveform will be obtained when the filter is switched out of the amplifier circuit.
On the other hand, with the filter switched into the circuit, strong ringing may be observed (Fig. 76B), regardless of the filter tuning.
(A) Test setup.
(B) Ringing in square waveform.
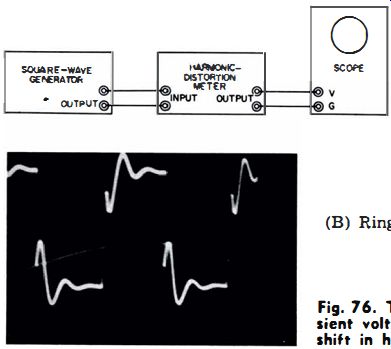
Fig. 76. To check for ringing in transient voltage, caused by filter phase
shift in harmonic-distortion meter.
--U-47
To Check an Amplifier Tube for Grid-Current Flow
Equipment: Audio oscillator, DC VTVM, and terminating resistor.
Connections Required: Connect equipment as shown in Fig. 77.
Procedure: Advance audio-oscillator output until meter reading starts to rise. Note meter reading. Then advance audio oscillator attenuator to obtain maximum rated power output from amplifier. Again note meter reading.
Evaluation of Results: Grid current starts to flow at the signal level at which meter reading first starts to rise. The grid current flow can be calculated from Ohm's law if the grid leak resistance is known.
When capacitive coupling is used to the grid, damping on positive signal peaks can cause considerable distortion unless the capacitor is large enough to supply the grid-current demand.
An oscilloscope check at the grid will reveal whether the positive signal peaks are flattened during the grid-current interval.
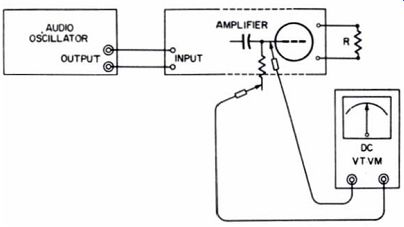
Fig. 77. Test setup.
NOTE 45
Classes of Amplifier Operation
Audio-amplifier tubes operate in Class A, AB, or B. Class-A tubes operate over the complete cycle (at maximum power output) without plate-current cutoff. Class-AB tubes operate at higher bias than Class A. They are used only in push-pull circuits which balance out the even harmonic distortion. Class-B tubes are biased almost to plate-current cutoff. Class-A amplifiers are designated Class A, or Class A, (at maximum power output). A Class-A, tube draws no grid current. A Class A? tube draws grid current over part of the signal cycle. Similarly, a Class-AB tube draws no grid current, and a Class-AB:! tube draws grid current on positive signal peaks.
--U-48
To Determine Whether Screen Bypassing Is Adequate
Equipment: Audio oscillator, oscilloscope, and terminating resistor.
Connections Required: Connect equipment as shown in Fig. 78.
Procedure: Tune audio oscillator to a low frequency, such as 60 cycles. Advance audio-oscillator output for maximum rated amplifier output. Measure the peak-to-peak screen voltage on a calibrated scope.
Evaluation of Results: AC voltage at the screen grid lowers the gain at the test frequency and reduces the shielding effect of the grid. The AC voltage can be reduced by increasing the value of the screen bypass capacitor.
The same test can be used to check the effectiveness of decoupling capacitors between the amplifier circuits and the power supply.

Fig. 78. Test setup.
--U-49
To Check for Equality of Time Constants in the R-C Circuits of an Amplifier Equipment: Square-wave generator, oscilloscope, and terminating resistor.
Connections Required: Connect equipment as shown in Fig. 79A. Procedure: Advance square-wave generator output for maximum rated power output from amplifier. Tune generator to a low frequency, one at which a differentiated square wave (Fig. 79B) will be seen on the scope screen when the scope is applied across an R-C circuit in the amplifier. Check, in turn, each of the cathode bypass, screen bypass, and decoupling bypass capacitors in the amplifier.
Evaluation of Results: The same differentiated square wave should be observed at each R-C circuit. If greater or lesser differentiation occurs at various R-C circuits, the transient response of the amplifier will not be optimum on peak overloads. The time constants can be adjusted by choosing suitable capacitor values.
(A) Test setup.
(B) Desired scope pattern.
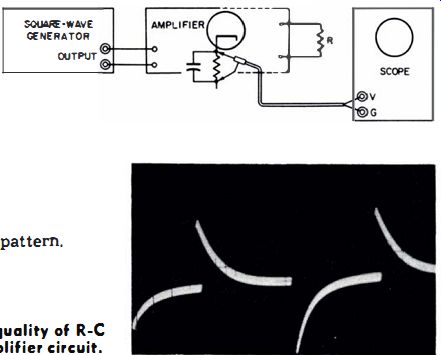
Fig. 79. Checking the equality of R-C time constants in an amplifier circuit.
--U-50
To Measure the Relative Hum and Distortion Voltages From an Amplifier
Equipment: Audio oscillator, harmonic-distortion meter, oscilloscope, and terminating resistor.
Connections Required: Connect equipment as shown in Fig. 80A. Procedure: Tune audio oscillator to standard test frequency, such as 400 cycles. Adjust output voltage to chosen level of test.
Tune out fundamental on harmonic-distortion meter. Set scope controls for 30- or 60-cycle horizontal deflection.
Evaluation of Results: The audio residue has a much higher frequency than the hum voltage, and appears as a thickening of the pattern. Fig. 80B shows the relative hum and distortion voltages present in the waveform.
The relative proportions of hum and distortion voltages vary widely from one amplifier to another. However, the same method of evaluation applies in each case.
(A) Test setup.
(B) Distorted waveform.
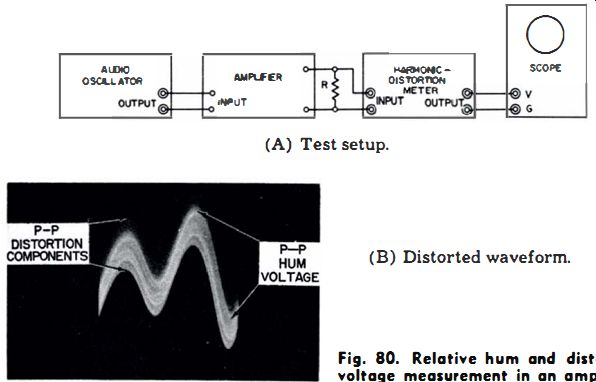
Fig. 80. Relative hum and distortion voltage measurement in an amplifier.
--U-51
To Test an Amplifier for Grid-Blocking Distortion
Equipment: IM signal source, oscilloscope, and terminating resistor.
Connections Required: Connect equipment as shown in Fig. 81.
Procedure: Set signal input level to obtain maximum rated power output from amplifier. Observe waveform on scope screen.
Evaluation of Results: The output waveform from the amplifier may appear as shown in Fig. 82. If the high-frequency component disappears along the falling excursion of the waveform, grid blocking is occurring in one of the stages.
Grid blocking results from grid-current flow on positive signal peaks, combined with a relatively slow recovery time. In other words, if a tube is driven far into grid current and the time constant of the grid-capacitor and grid-leak circuits is long, the grid will remain blocked by the high negative bias left after the signal peak has passed.
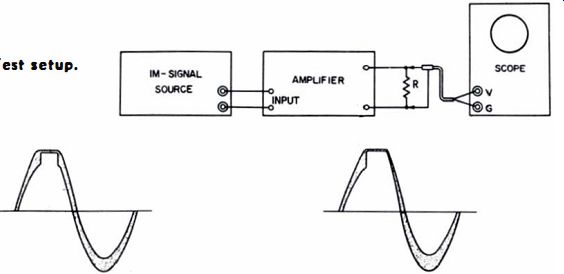
Fig. 81. Test letup.
Fig. 82 Grid clipping and blocking distortion.
(A) Clipping and no grid blocking. (B) Clipping and grid blocking.
--U-52
To Measure the Reduction in Hum and Harmonic Distortion Resulting from Negative Feedback
Equipment: Audio oscillator, harmonic-distortion meter, oscilloscope, and terminating resistor.
Connections Required: Connect equipment as shown in Fig. 83.
Procedure: In the first test, leave the feedback loop (or loops) connected, and measure as explained in U50. In the second test, open the feedback loop (or loops) , and reduce the audio oscillator output to provide the same power output as before.
If necessary, retune the harmonic-distortion meter in order to obtain a minimum reading.
Evaluation of Results: Compare the peak-to-peak voltages of the hum and distortion components in the two patterns. The ratios between the voltages give the reduction in hum and distortion resulting from negative feedback.
To measure the reduction in hum and distortion caused by negative feedback across an unbypassed cathode resistor, eliminate the negative feedback by shunting the resistor with a large bypass capacitor, as shown in Fig. 84.

Fig. 83. Test setup.
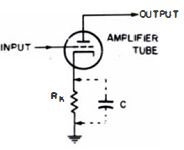
Fig. 84. Method 01 eliminating negative feedback.
NOTE 46
Feedback Loops May Supply B + Voltage to Tube Electrodes
In some amplifier circuits, the feedback loop also conducts DC supply voltage to a tube electrode. If so, the feedback lead cannot merely be open-circuited. It must be connected to a suitable DC voltage source, so that the tube will operate properly. For example, the feedback loop in Fig. 85A can be open-circuited without considering the DC voltage. The loop operates in an AC-coupled circuit.
On the other hand, the loop in Fig. 85B not only feeds back AC signal voltage to the screen grid of the input tube, but also supplies DC voltage to the screen. In this example, open the loop at X, and then connect it at a suitable point in the power supply. This will provide normal operating voltage to the screen grid. The feedback loop can be connected to the B+ line, at the center tap on the output-transformer primary.
(A) Loop operated in AC-coupled circuit.
(5) Loop that is also part of the DC supply line.
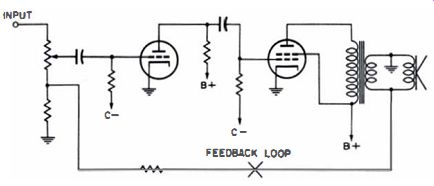
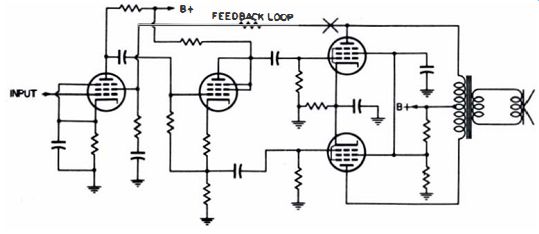
Fig. 85. Opening the feedback loop.
NOTE 47
Normal Operation of Feedback loop Can Depend Upon Correct Generator Source Resistance
When negative feedback is made to the input circuit of an amplifier, the audio oscillator may be included in the feedback network, as seen in Fig. 86. If so, the generator must have the same source resistance as the driver circuit or the unit which the generator replaces. A resistor (R) can be added in series with the audio-oscillator output lead, for example, to provide a higher source resistance. See also U25, Note 30, Note 34, Note 35, Note 36, U30, U40, U41, and U42.
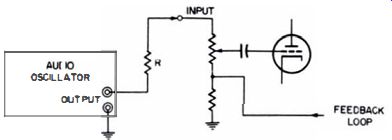
Fig. 86. Audio oscillator connected within the feedback network.
--U-53
To Check the Loudness-Control Response in a Preamplifier
Equipment: Audio oscillator, AC VTVM, and terminating resistor.
Connections Required: Connect equipment as shown in Fig. 87.
Procedure: Set preamplifier controls for flat response. Set loudness control to extreme end of its range. Adjust the audio oscillator and the preamplifier volume control for normal output from the amplifier. Determine the frequency response of the preamplifier. Then reset loudness control to progressively higher positions. Maintain same amplifier output by readjusting the volume control. Determine the frequency response of the preamplifier for each setting of the loudness control.
Evaluation of Results: Unlike the volume control, the loudness control does not have a flat frequency response. It is a special type of compensated volume control which normally provides a progressive bass boost as it is set for higher sound output (and may also provide a certain amount of treble boost at higher output settings). Typical Fletcher-Munson curves are shown in Fig. 88.
The phon is the unit of loudness as sounds are heard by the ear. We normally do not hear low frequencies as well at low volume levels as we do at high levels. Since a disc is generally recorded at a different level than it is reproduced, the loudness control makes the frequency response at the reproduction level correspond to the ear's response at the recording level.

Fig. 87. Test letup.
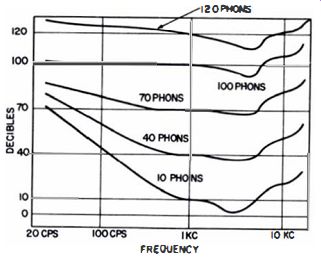
Fig. 88. Typical Fletcher-Munson curves.
NOTE 48
Loudness Is a Judgment, Not a Direct Knowledge of Sound Energy
Do not suppose that the loudness of a sound is anything other than a mental judgment. For instance, if a speaker is operating in a room and you stop up one ear, does the loudness of the sound change? Not one bit! Yet only half as much sound energy is entering your ears. It is the same as if you close one eye while reading this page. Does the brightness of the page change? Again, not a bit! Yet only half as much energy is entering your eyes. The loudness of a sound corresponds to sound waves in the air. However, we do not need sound waves in order to perceive sound. In conversations "heard" in our dreams, we experience sound-including softness and loudness-hut these experiences obviously have no basis in air vibrations. Likewise, if we take heavy doses of certain drugs, we experience buzzing and ringing sounds of varying loudness; yet these sounds, too, have no basis in air waves.
Thus, we conclude that hearing and sound are mental judgments. They do not give us direct knowledge of the physical data with which we work.
--U-54
To Check the Response of a Scratch Filter in a Preamplifier
Equipment: Audio oscillator, AC VTVM, and terminating resistor.
Connections Required: Connect equipment as shown in Fig. 89.
Procedure: Switch scratch filter on. Set preamplifier controls for flat response. Adjust the audio oscillator and the preamp volume control for normal output. Run a frequency response of the preamplifier.
Evaluation of Results: The high-frequency response should be approximately as shown in Fig. 90. There should be noticeable attenuation, starting at 7 khz and falling to approximately -35 db at the 10- khz point.

Fig. 89. Test letup
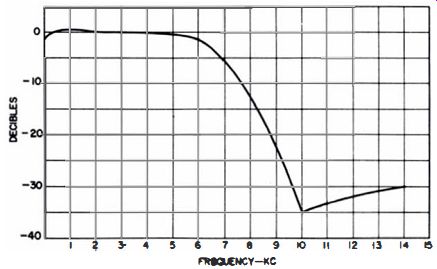
Fig. 90. Typical frequency response for a commercial scratch filter.
--U-55
To Check the Response of a Rumble Filter in a Preamplifier
Equipment: Audio oscillator, AC VTVM, and terminating resistor.
Connections Required: Connect equipment as shown in Fig. 91.
Procedure: Switch rumble filter on. Set preamplifier controls for flat response. Adjust the audio oscillator and the preamplifier volume control for normal output. Run a frequency response of the preamplifier.
Evaluation of Results: The low-frequency response should be approximately as in Fig. 92, with an initial slope of 10 or 12 db per octave. (From 10 cycles to 20 cycles, for example, is one octave:) The high-frequency response should not be affected by the rumble filter.
Rumble is heard as either a low-frequency tone or a series of slow, random pulses from substandard or faulty record players.
Arm resonance or mechanical-drive vibration can also cause rumble. The rumble filter in a preamplifier attenuates or eliminates the rumble distortion, but at the expense of low-frequency response. However, the acoustic effect is not as severe as might be concluded from Fig. 92. The reason is that the ear can generate a synthetic bass when harmonics of a bass tone are passed by the amplifier. Synthetic bass, however, becomes less evident at lower volume levels.

Fig. 91. Test setup.
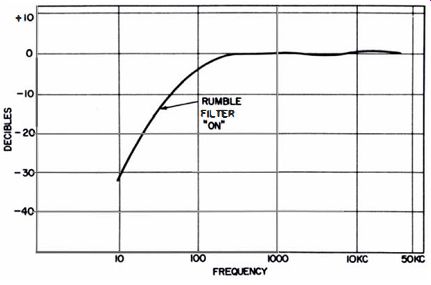
Fig. 92. Normal frequency response for a preamplifier with rumble filter
operating.
--U-56
To Check the Response of a Presence Control in a Preamplifier
Equipment: Audio oscillator, AC VTVM, and terminating resistor.
Connections Required: Connect equipment as shown in Fig. 93.
Procedure: Switch presence control on. Set preamplifier controls for flat response. Adjust the audio oscillator and the preamplifier volume control for normal output. Run the frequency-response curve of the preamplifier.
Evaluation of Results: The low-frequency response should be essentially flat, although a rising midrange response of 5 or 6 db should appear, as indicated in Fig. 94. The high-frequency response should be about the same as with the presence control switched off.
A rising midrange response, as provided by a presence control, is sometimes desired when vocal selections with a musical background are being reproduced. Since this actually departs from true high fidelity, its use involves artistic judgment.
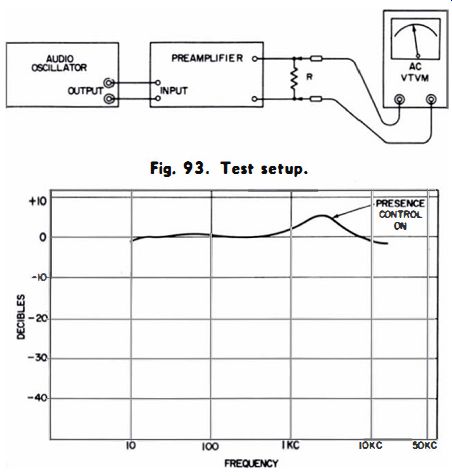
Fig. 93. Test setup.
Fig. 94. Typical frequency-response curve for a preamplifier, with tone controls set for flat response and the presence control turned on.
NOTE 49
Distinction Between Loudness- and Presence-Control Characteristics
The beginner must not confuse loudness-control with presence-control characteristics. As shown in Fig. 94, a presence control provides a typical midrange boost, but does not affect the low-frequency response. A loudness control, on the other hand, provides a low-frequency boost, but does not affect the high-frequency response (Fig. 95). In addition to the low-frequency boost, some loudness controls in elaborate amplifiers provide a small high-frequency boost.
The high-frequency boost makes the loudness characteristic conform more closely to the Fletcher-Munson curves. However, high-frequency boost is not too important to most listeners. For this reason, it is often omitted.
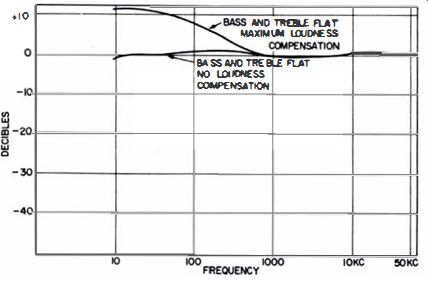
Fig. 95. Typical frequency response curve for a preamplifier, with tone
controls let for flat response and the loudness control at maximum.
--U-57
To Check the Response of Boss-Boost, Bass-Cut, Treble Boost, and Treble-Cut Controls
Equipment: Audio oscillator, AC VTVM, and terminating resistor.
Connections Required: Connect equipment as shown in Fig. 96.
Procedure: Adjust all preamplifier controls for a flat response, except the control under test. Adjust the audio oscillator and the preamplifier volume control for normal output. Run a frequency response of the preamplifier.
Evaluation of Results: Typical frequency responses for boost and cut tone controls are shown in Fig. 97. Observe that treble boost is not the same as bass cut, nor is bass boost the same as treble cut. The difference can be heard distinctly if the preamplifier controls are varied while music is playing.
The frequency distortions caused by bass and treble boosts and cuts are a matter of artistic judgment and individual preference.
The frequency responses in Fig. 97 are free from interaction between tone controls. In other words, bass boost and cut controls do not affect the treble response. Nor do the treble boost and cut controls affect the bass response. In some preamplifiers the bass and treble controls will interact noticeably.

Fig. 96. Test setup.
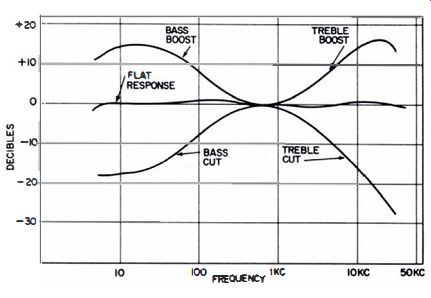
Fig. 97. Typical frequency-response curves for the bass and treble tone
controls.
--U-58
To Measure the Frequency Response of a Crossover Network
Equipment: Audio oscillator, VOM, and terminating resistors.
Connections Required: Connect output terminals of audio oscillator to input terminals of amplifier. Connect suitable values of terminating resistors in place of the woofer and the tweeter. In first test, connect VOM across one terminating resistor. In second test, connect VOM across the other terminating resistor. (See Fig. 98.) A VOM should be used in place of a VTVM, because of ground capacitance.
Procedure: Adjust audio oscillator for maximum rated output from amplifier. First run a frequency-response curve for the woofer load. Then run a frequency-response curve for the tweeter load.
Evaluation of Results: Compare the roll-off characteristics of the crossover network with the manufacturer's specifications.
Roll-off rates are chosen at widely different values by various designers. The important point is that the high-frequency and low-frequency roll-offs should be consistent, so that the overall frequency response will be flat. You will find roll-off rates from 6 db to 18 or 24 db per octave. In general, transient response is better with slow roll-off, although a greater demand is placed upon the tweeter for power output.
A speaker is not a purely resistive load. Hence, the roll-off characteristic, when measured with a load resistor, may not be quite the same as when measured with a speaker as the load. Fig. 98. Test setup.
NOTE 50
Variations in Crossover Network Design and Triple-Output Systems
In some amplifiers the crossover network is connected to intermediate stages instead of directly to the speakers. Likewise, a few amplifiers have electronic crossovers instead of LC filters, as shown in Fig. 98. However, the same test is appropriate for both. Elaborate systems have a woofer, midrange (squawker), and tweeter arrangement. In such systems, run three frequency-response curves instead of two. The combined responses should always show an over-all flat frequency characteristic.
--U-59
-- To Measure the Weighted Noise Level of an Amplifier
Equipment: An R-C differentiating network with a 1-millisecond time constant (Fig. 99) ; and a db meter that has an amplifier with a bandwidth of 15 to 15,000 cycles and a frequency response flat within ±1 db.
Connections Required: Short circuit the input terminals of the amplifier, preferably with a shielded connector. Terminate the amplifier in a rated load, if required. Connect R-C circuit across load. Connect output from R-C circuit to input terminals of meter amplifier.
Procedure: Set amplifier controls at predetermined positions for maximum rated output from amplifier. Measure noise voltage on db meter.
Evaluation of Results: The weighted noise level is the number of db below the normal output voltage from the amplifier.
Compare measured value with manufacturer's specifications.
Preamplifiers are often rated for weighted noise level from more than one input. Switch amplifier to various inputs, as required. Thus, a preamp might be rated with a weighted noise level of better than 80 db below 2 volts for one input, and better than 54 db below 2 volts for another input. The weighted noise input is considered to be more in accordance with acoustic values than a noise measurement without low-frequency attenuation.
Weighted noise-level ratings of preamplifiers are often given on the basis of total noise and hum. However, many engineers prefer to separate the two. If a scope is connected across the noise meter, the ratio of noise voltage to hum voltage can be evaluated.
When checking manufacturer's specifications, distinguish between the two rating methods.

Fig. 99. An R-C differentiating network used to measure the weighted noise
level of on amplifier.
--U-60
To Test the Operation of a Bridging Control in a Preamplifier Equipment: Audio oscillator, terminating resistors, and AC VTVM. Connections Required: Connect equipment as shown in Fig. 100. Procedure: Set preamplifier controls for normal output level.
Run a frequency response of the preamplifier with the bridging control set at low, medium, and high positions. Repeat test with signal input connected to channel A and meter connected to the output of channel B. Evaluation of Results: The output voltage should increase proportionally with the setting of the bridging control. The frequency response of the amplifier should be within rated limits at any setting of the bridging control.
The purpose of the bridging control is to inter-mix the two stereo channels. This minimizes or eliminates the "hole in the middle" due to speaker placement or recording characteristics.

Fig. 100. Test setup.
--U-61
-- To Check the Equalization-Control Characteristic in a Preamplifier
Equipment: Audio oscillator, AC VTVM, and terminating resistor.
Connections Required: Connect equipment as shown in Fig. 101.
Procedure: Adjust all preamplifier controls for flat response, except for the equalization control, which is set to AES response. Adjust audio oscillator and volume control for normal output. Run a frequency response of the preamplifier.
Evaluation of Results: The frequency response should correspond to Fig. 102. Both the treble and bass end of the characteristic can be varied by adjusting the boost and cut controls, although not sufficiently to match the characteristics of some older recordings. Fig. 103A is the RIAA recording curve.
The equalizer in the preamp has the opposite characteristic, so that a flat frequency response is obtained from the record to the equalizer output.
Fig. 103B shows the standard RIAA playback curve. When the frequency response of an equalizer is being checked on the RIAA position, this curve should be reproduced within ±2 db.

Fig. 101. Test setup .
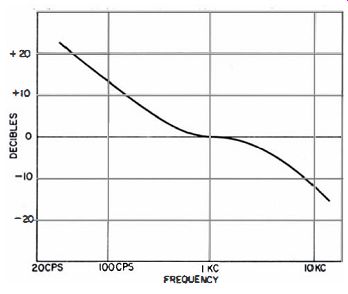
Fig. 102. Equalization characteristic recommended by the AES for record
playback.
(A) RIAA recording curve.
(B) RIAA playback curve.

Fig. 103. Standard RIAA curve
--U-62
To Test an Amplifier for Microphonics
Equipment: Audio oscillator, terminating resistor, and audio VTVM. Connections Required: Disconnect speaker from amplifier. Connect load resistor of suitable value across amplifier output terminals. Connect audio VTVM across load resistor. Connect output from audio oscillator to speaker terminals. (See Fig. 104.) Procedure: Drive speaker over the audio-frequency range, and note any reading on the VTVM. Place stylus in a record groove. (Do not operate record player, because the test is for checking reproduction of vibrations from speaker.) Evaluation of Results: If the amplifier and player are free from microphony, the meter reading does not increase when the speaker is energized.
To test the amplifier by itself, disconnect the pickup and substitute a suitable fixed resistor.
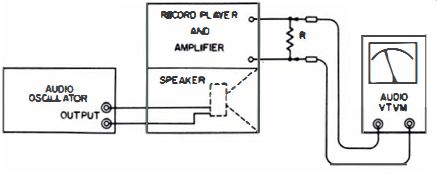
Fig. 104. Test setup.
--U-63
To Check for Regeneration in an Over-all Feedback Loop
Equipment: DC milliammeter.
Connections Required: Insert milliammeter in the B+ lead to the output transformer (Fig. 105).
Caution: Set meter to high current range first.
Procedure: Disconnect the feedback loop, and observe the meter reading.
Evaluation of Results: If the B+ current to the output stage decreases when the feedback loop is disconnected, look for incorrect component values in the feedback circuit.
Regeneration (positive feedback) occurs in a negative-feedback loop when component values change and introduce a phase shift at certain frequencies; this phase shift makes the feedback positive instead of negative. Unsuspected phase shifts can occur in the amplifier components themselves, and can cause regeneration when all components in the feedback loop have correct values.
Some amplifiers have extended high-frequency response beyond the audible range. Unless carefully controlled, stray capacitances can cause regeneration in such amplifiers.
Negative feedback is often expressed in db. That is, an amplifier may be said to have 25 db negative feedback. This means the amplifier has 25 db less gain than if the negative feedback were removed. For example, if an overall feedback loop is used, the amplifier gain will increase 25 db when the feedback loop is opened. In turn, the amplifier response will be much poorer without negative feedback.
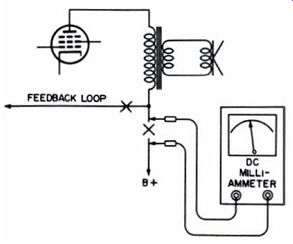
Fig. 105. Milliammeter inserted in 8 + line to output transformer.
NOTE 51
(A) Unsymmetrical dipping generates even harmonics.
(B) Symmetrical clipping generates odd harmonics.

Fig. 106. The generation of harmonics by distorted waveshape.
Negative Feedback Cannot Reduce Clipping Distortion
Clipping distortion cannot be reduced by negative feedback; instead, the clipped waveform comers are sharpened. This inability to correct the waveform results from the fact that the amplifier gain is suddenly reduced to zero during the clipping interval. Clipping is heard as a knocking sound. The only remedy for clipping is to operate the amplifier below the overload point. Fig. 106 shows some clipped waveforms.
Whether even harmonics (Fig. 106A) or odd harmonics (Fig. 106B) are generated depends upon the waveshape of the distorted signal.