--U-88
To Check the Frequency Response of a Tape Recorder
Equipment: Audio oscillator, AC VTVM, and switch or clip lead.
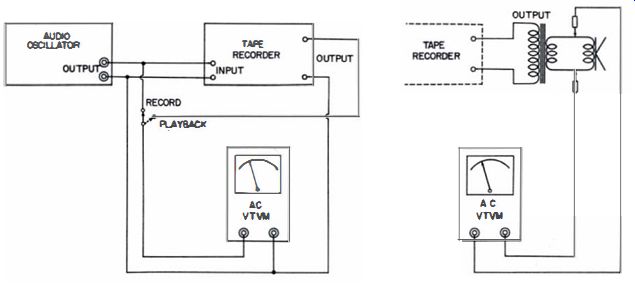
Connections Required: Connect audio-oscillator output to amplifier input in tape recorder. Connect VTVM to audio oscillator output in first part of test (Fig. 135A). Connect VTVM across speaker voice coil (or load resistor) in second part of test (Fig. 135B). Procedure: Adjust audio-oscillator output to normal recording level, avoiding excessive input. Tune audio oscillator to a low frequency, such as 50 cycles. Record the signal, and note VTVM reading. Next tune audio oscillator to successively higher frequencies, and record the signals at the original level indicated by the VTVM. Finally connect VTVM to amplifier output (Fig. 135B) , and play the tape back. Note VTVM readings as the recording frequency changes.
Evaluation of Results: If the system has a flat frequency response, the VTVM readings will be constant. The measured frequency response depends upon the setting of the tone control. Hence, a complete test includes frequency runs at different settings of the tone control.

Fig. 135. Frequency-response check of a tope recorder.
(A) AC VTVM connected across audio oscillator output.
(B) AC VTVM connected across speaker voice coil.
--U-89
To Measure the Low-Frequency Noise from a Record Player, Preamplifier, and Amplifier
Equipment: Decibel meter, terminating resistor, and test record.
Connections Required: Connect equipment as shown in Fig. 136.
Procedure: Use the 1000-cycle tone of the test record. Adjust the volume so that the amplifier operates within its power limit.
Turn the bass control to zero. The initial measurement should be such that the meter can indicate at least -50 db less output. Note db reading. Then place the stylus in an unrecorded groove. Turn the bass control up to normal setting.
Do not change the amplifier gain. Again note the db reading.
Evaluation of Results: The db reading obtained with the 1000 cycle tone is the reference db reading. The db reading obtained with the unrecorded groove is the comparative low frequency noise level. Subtract the two readings to obtain the low-frequency noise level in db below the reference level.
Since the db measurements are made across a fixed terminating resistor, the difference in db readings will be the actual number of db below the reference level. On the other hand, neither of the individual db readings is necessarily correct by itself.

Fig. 136. Test setup.
--U-90
To Make a Sweep-Frequency Test of a Record Player, Preamplifier, and Amplifier System
Equipment: Gliding-tone test record, terminating resistor, and AC VTVM or scope.
Connections Required: Connect equipment as shown in Fig. 137.
Procedure: Adjust amplifier controls for normal output. Observe meter reading or scope deflection as gliding-tone record drives the preamp through the audio-frequency range.
Evaluation of Results: The variation in instrument indication shows the flatness (or lack of flatness) of the combined pickup, preamp, and amplifier system.
A gliding-tone test record is an audio-frequency sweep-signal source. A typical record starts at 14 khz and ends at 10 hz.
Another starts at 10 khz and ends at 50 hz. Still another has five 1- khz bands at increasing output levels, followed by alternate gliding and constant frequencies from 3 khz to 30 hz. Numerous other combinations are available for making any specialized tests desired.

Fig. 137. Test setup.
--U-91
To Test the Over-all Transient Response of a Tape Recorder
Equipment: Square-wave generator and oscilloscope.
Connections Required: Connect output from square-wave generator to mike-input connector of recorder. Connect vertical input terminals of scope to voice-coil terminals of speaker.
(See Fig. 138.)
Procedure: Set square-wave generator output for normal recording level. Run recorder. Vary square-wave generator frequency slowly from 20 hz to 10 khz. Then play back, and observe scope pattern. Increase the horizontal-deflection rate as the square-wave frequency increases.
Evaluation of Results: The scope pattern shows the system response to transient voltages. Typical distortions are tilt, curvature, corner rounding, overshoot, and ringing.
Better square-wave reproduction is observed when the speaker is disconnected and a suitable load resistor substituted. This eliminates the distortion introduced into the pattern by the motional impedance of the speaker.

Fig. 138. Test setup.
--U-92
To Test the Over-all Tone-Burst Response of a Tape Recorder
Equipment: Tone-burst generator and oscilloscope.
Connections Required: Connect output from tone-burst generator to mike-input connector of recorder. Connect vertical input terminals of scope to voice-coil terminals of speaker.
(See Fig. 139.) Procedure: Set tone-burst generator output for normal recording level. Run the recorder. Vary tone-burst generator frequency slowly from 20 hz to 10 khz. Then play back, and observe scope pattern. Increase the horizontal-deflection rate as the tone-burst frequency increases.
Evaluation of Results: The tone-burst pattern observed on the scope screen corresponds in a general way to the patterns observed in a square-wave test. However, the tone-burst test is a more critical test, since the tone signal exalts a given harmonic in the square wave, and provides a more pronounced reaction to minor defects in the tape-recorder system.
To obtain a more comprehensive evaluation of tone-burst response, gradually vary the tone-burst frequency from a low value to the upper limit at which the amplifier output starts to fall off.
Some amplifiers will distort a tone burst at a certain frequency, but will pass an undistorted burst at other frequencies.

Fig. 139. Test setup.
--U-93
To Measure the Peak-Overload Capability of a Tape Recorder
Equipment: Square-wave generator, R-C differentiating network, terminating resistor, and oscilloscope.
Connections Required: Connect differentiating network between square-wave generator and microphone-input jack of tape recorder. Use suitable R and C values, to obtain approximately 50% decay of the square wave (as shown by a scope check). Terminate the playback amplifier with a suitable load resistor. Connect scope input terminals across load resistor.
(See Fig. 140.)
Procedure: Record on tape the differentiated square wave in progressively higher voltage steps, noting the recorder-level indication on each step. Next play the tape back, and observe pattern on scope screen.
Evaluation of Results: The level at which the top of the reproduced waveform is no longer pointed, but rounded or clipped, is the peak-overload capability of the recorder.
Use of a load resistor instead of a speaker eliminates excessive noise during the test. On the other hand, the peak-overload capability is generally less with a speaker. The speaker has a reactive component of impedance, which causes the load line on the output-tube characteristic to become an ellipse instead of a straight line. In turn, the tube starts to overload and distort earlier than with a resistive load.

Fig. 140. Test setup.
--U-94
To Measure the Total IM Distortion of a Tape-Recorder System
Equipment: IM signal source (may be obtained from audio analyzer or from two audio oscillators and a bridge mixing network, as shown in Fig. 141) , broadcast-quality microphone, good preamplifier, and IM distortion meter.
Connections Required: Connect equipment as shown in Fig. 141.
Procedure: Record output from IM signal source at maximum recording level. Then play the tape back at normal output level. Place microphone on axis of speaker and back far enough for normal operating level of microphone. (Test is preferably made in open air.)
Measure percentage of IM distortion on IM distortion meter.
Evaluation of Results: The percentage of IM distortion read on the IM distortion meter is the resultant of the individual system distortions. It is the most useful IM measurement, because it represents the total IM distortion in the actual operation of the recorder.
The percentage of IM distortion read on the meter is not the simple sum of the individual IM distortions. The individual distortions can be combined by the system networks in phase, out of phase, or in some intermediate phase. If the audio-signal sources are variable (as when two audio oscillators are used) , it is helpful to make total IM distortion readings at different frequencies. In the first test, set one generator at a low audio frequency and the other at a high audio frequency. In the second test, set both generators to different high frequencies, if the IM meter permits.

Fig. 141. Test setup.
--U-95
To Measure the Total Harmonic Distortion of a Tape
Recorder System
Equipment: Audio oscillator, broadcast-quality microphone, good
quality preamplifier, and harmonic-distortion meter.
Connections Required: Connect equipment as shown in Fig. 142.
Procedure: Record audio tone at maximum recording level. Then play tape back. Place microphone on axis of speaker, at the distance for normal microphone output when recorder is reproducing at normal output. Measure percentage of total harmonic distortion on harmonic-distortion meter.
Evaluation or Results: The reading on the harmonic-distortion meter gives the resultant of the system harmonic distortions.
This is not necessarily the simple sum of the individual distortions. It is the most useful measurement of harmonic distortion, because it represents the total harmonic distortion encountered in actual operation of the recorder.
The percentage of total harmonic distortion generally varies with the test frequency. Hence, make tests at low, medium, and high audio frequencies. The reading on the harmonic-distortion meter often varies greatly at different recording levels and at different settings of the volume control. Therefore, these factors should also be determined in a complete test run.

Fig, 142. Test setup.
--U-96
To Check a Stereophonic System for Balance
Equipment: Audio test record and stereo balance meter (or noise level meter).
Connections Required: None.
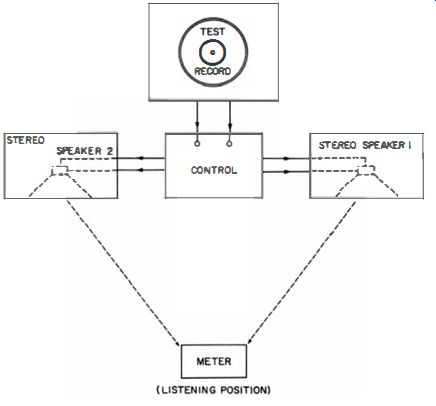
Procedure: Place meter in position of the listener, in front of the two speakers, as shown in Fig. 143. Reproduce a 400 or 1000-cycle tone from the test record at normal level.
Apply the tone signal to each channel in turn, and observe meter readings. Adjust the stereo balance control for equal readings.
Evaluation of Results: A midrange balance is obtained when meter readings are equal at a midrange test frequency.
However, other settings of the stereo balance control may be necessary at low and high audio frequencies. An average balance setting can be determined from three tests made at 100, 1000, and 8000 cycles.
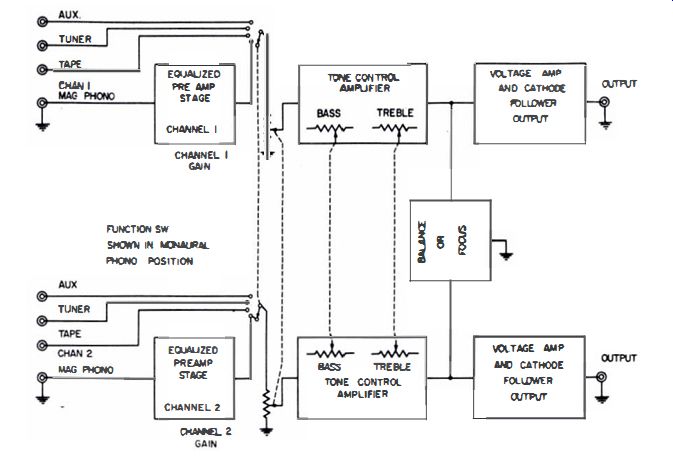
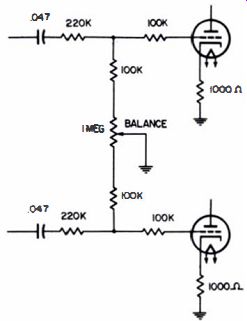
A block diagram of a basic stereo amplifier, with a pair of identical sound channels, ganged controls, a balance network, and function switch, is shown in Fig. 144. The balance-control circuit used between stereo preamplifier channels is illustrated in Fig. 145.

Fig. 143. Test setup.

Fig. 144. Block diagram of a basic stereo amplifier.

Fig. 145. Circuit diagram for a balance control between stereo preamplifier
channels.
--U-97
To Check the Frequency Response of an AM Tuner and Hi-Fi Amplifier
Equipment: Audio oscillator, RF signal generator, terminating resistor, and AC VTVM. Connections Required: Connect equipment as shown in Fig. 146.
Procedure: Adjust output from audio oscillator for approximately 30% modulation of the RF signal. Set signal generator for average input to AM tuner (avoid overload). Tune generator to suitable frequency. Vary audio-oscillator frequency in steps, from 50 cycles to 15 khz. Observe meter readings at each step.
Evaluation of Results: The frequency response should be reasonably flat up to 10 khz. If the high-frequency response is poor, check the RF tuner alignment.
For accurate test results, the modulator section of the RF signal generator must not distort the audio signal and must have flat frequency response through the audio range.

Fig. 146. Test setup.
--U-98
To Measure the Total Harmonic Distortion of an AM Tuner and Hi-Fi Amplifier
Equipment: AM signal generator, terminating resistor, and harmonic-distortion meter.
Connections Required: Connect equipment as shown in Fig. 147.
Procedure: Set generator for 30% internal modulation. Set output level from generator for normal operation of tuner (avoid overload). Tune generator and AM tuner to the same frequency. Adjust amplifier for normal output. Measure percentage of total harmonic distortion on harmonic-distortion meter.
Evaluation of Results: If a good AM tuner is used, the reading of the harmonic-distortion meter will not be much higher than the reading of the amplifier alone. Note that some AM generators have substandard internal modulators. They can introduce more harmonic distortion than the tuner and amplifier.

Fig. 147. Test setup.
--U-99
To Measure the Total Intermodulation Distortion of an AM Tuner and Hi-Fi Amplifier
Equipment: IM signal source, RF signal generator, IM distortion meter, and terminating resistor (unless IM distortion meter contains internal load resistors). Connections Required: Connect equipment as shown in Fig. 148.
Procedure: Adjust output from IM signal source for 30% modulation of the RF signal generator. Set output level from generator for normal operation of AM tuner. Tune generator to same RF frequency as AM tuner. Adjust hi-fi amplifier for normal output. Measure total IM distortion on IM distortion meter.
Evaluation of Results: This method gives the total IM distortion of the system, exclusive of the speaker. To include the speaker distortion, connect the speaker at the amplifier output in place of the terminating resistor. With a broadcast quality microphone, pick up the speaker output and feed it to a good-quality preamplifier. Measure the total distortion from the preamp with the IM distortion meter.

Fig. 148. Test setup.
--U-100
To Make a Tone-Burst Test of an AM Tuner and a Hi-Fi Amplifier
Equipment: Tone-burst generator (or audio oscillator and electronic switch) , RF signal generator, oscilloscope, and terminating resistor.
Connections Required: Connect equipment as shown in Fig. 149.
Procedure: Adjust output from tone-burst generator to obtain 30% modulation of the RF signal. Set output from RF signal generator for normal operation of the AM tuner. Tune generator and AM tuner to the same RF frequency. Set hi-fi amplifier for normal output. Observe tone-burst pattern on scope screen.
Evaluation of Results: The tone-burst pattern should be almost the same as when the amplifier is tested by itself. For a complete check, vary the tone-burst frequency through the audio range. At the low end of the RF band, the AM tuner response sometimes differs from the response at the high end. Hence, this should also be checked.

Fig. 149. Test setup.
--U-101
To Test the Square-Wave Response of an AM Tuner and Hi-Fi Amplifier
Equipment: Square-wave generator (or audio oscillator and electronic switch), RF signal generator, oscilloscope, and terminating resistor.
Connections Required:
Connect equipment as in Fig. 150. Procedure: Adjust output from square-wave generator to obtain 30% modulation of the RF signal. Set output from RF signal generator for normal operation of the AM tuner. Tune generator and AM tuner to the same RF frequency. Set hi-fi amplifier for normal output. Observe square-wave pattern on scope screen.
Evaluation of Results: The square-wave reproduction of the AM tuner and hi-fi amplifier should be almost as good as the square-wave reproduction of the hi-fi amplifier by itself. If the square-wave distortion is excessive, check the AM tuner alignment.
FM tuners are often used to drive high-fidelity amplifiers; however, the foregoing tests are impractical in the average service shop because of the in-availability of true FM signal generators.
Therefore, an FM tuner should be checked out as an individual unit, using a sweep generator and an oscilloscope.

Fig. 150 Test setup.