--U-64
To Check the Output From a Phono Cartridge
Equipment: Audio VTVM and test record.
Connections Required: Connect the audio VTVM across the normal load resistor for the cartridge, as shown in Fig. 107.
Procedure: inspect the stylus with a 50-power stylus inspection microscope. If it shows signs of wear, replace it before playing the test record. Set the audio VTVM to a suitable range, such as 30 millivolts. Place the test record on the changer, and observe the reading on the VTVM.
Evaluation of Results: A variable-reluctance cartridge should provide 0.01- to 0.03-volt output; a ceramic cartridge, 0.5 to 1.2 volts; and crystal cartridges, 0.5 to 5 volts. To determine the frequency response of a cartridge, check the comparative output voltages obtained from the various frequency ranges of the test record.
The frequency response of a good ceramic or crystal cartridge should extend from 50 cycles to 12 or 15 khz. Some types of high output cartridges have a frequency response to only 7 or 8 khz.
Variable-reluctance cartridges should have a response to 15 or 20 khz.
The frequency response of a pickup is affected by the shunt capacitance of the connecting cable, the value of the load resistance, and-with some designs, such as variable-reluctance pickups--the inductance of the unit itself. Hence, if the frequency response of a pickup is unsatisfactory, it is often worthwhile to try different values of load resistance and different diameters of connecting cable.
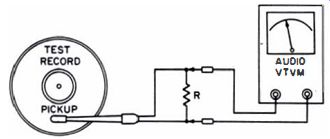
Fig. 107. Test setup.
NOTE 52
Most Pickup Cartridges Operate on the Velocity Principle
In a record that is cut to have equal velocities at all frequencies, the movement of the needle perpendicularly to the grove is inversely proportional to the frequency. In other words, the cut is small at low frequencies and large at high frequencies. The high frequencies are boosted. This gives a good signal-to-noise ratio at high frequencies. and avoids overcutting of the groove walls at low frequencies. The low frequencies contain most of the sound energy. The db output from an RIAA (Recording Industry Association of America) record versus frequency is shown in Fig. l03A. An equalizer with an inverse characteristic is used to provide a flat response from a pickup cartridge. The equalizer is usually contained in the preamplifier. Most modem records will be played in the RIAA position of the equalizer, since they are based upon the characteristic shown in Fig. 103A.
--U-65
To Check for Optimum Needle Pressure
Equipment: Needle-pressure gauge.
Connections Required: None.
Procedure: Place gauge under stylus, and read pressure on grams scale.
Evaluation of Results: As a preliminary step, check the scale reading against the manufacturer's specifications. Thus, if 6 to 8 grams is specified, any reading between these limits is acceptable. On the other hand, an IM analyzer may show less tracking distortion (e.g., when the pressure is 8 grams rather than 6 grams). No set rules can be stated. Optimum pressure (within specified limits) can be determined only by measurement with a test record and an IM analyzer.
Even if the needle pressure is optimum, distortion will occur if the stylus angle is incorrect. It is good practice to check the stylus angle against the manufacturer's specifications.
The needle-pressure gauge should be so placed that it indicates the normal playing level of the pickup. This level may vary in a changer; however, the pressure can be measured at the average playing level. The needle should rest freely in the cup. The pressure usually increases as the pickup is raised and decreases as the pickup is lowered. However, a variation of more than 2 grams (or 25% of rated pressure) indicates a fault in the arm assembly.
NOTE 53
Low-Distortion Reproduction Requires Correct Tracking Angle.
An ideal tone arm and pickup would track a record so that the stylus always moved perpendicularly to the tangent at the groove. In practice, this can occur at only one point on the record, since the pickup moves on a curve from the outer to the inner grooves. A reasonably good test of the tracking angle is to place the stylus at the outer grooves, then at an intermediate groove, and finally at an inner groove, and observe whether the edge of the cartridge is reasonably tangent to the groove.
A tracking error of 3° or 4 degrees is normally expected at the outer and inner grooves. (An experienced eye is required to evaluate such a small tracking error.) Large tracking errors are plainly visible. Excessive errors in tracking angle cause second-harmonic distortion in reproduction, as illustrated in Fig. 105.
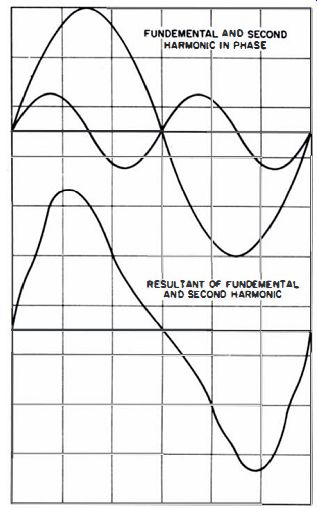
Fig. 108. Second-harmonic distortion, caused by error in tracking angle.
--U-66
To Measure the Intermodulation Distortion of the Pickup and Preamplifier
Equipment: Two-tone test record, preamplifier, and intermodulation-distortion meter.
Connections Required: Connect equipment as shown in Fig. 109.
Procedure: Measure percentage of IM distortion (in the same manner as if a two-frequency signal were being applied to the preamplifier).
Evaluation of Results: Evaluate the percentage of IM distortion in the light of the preamplifier IM distortion (if measureable) , plus any wow and flutter contributed by the player.
Make separate measurements to determine these factors.

Fig. 109. Test setup.
--U-67
To Measure the Static Compliance of a Stylus
Equipment: Calibrated shadowgraph and sensitive balance.
Connections Required: None.
Procedure: Mount pickup in shadowgraph, and project image of stylus on screen. Load stylus laterally with a small loop of wire (or other convenient weight) to obtain a readily measurable deflection on the screen. Then measure the weight with a sensitive balance.
Evaluation of Results: The static compliance is given in centimeters of deflection per dyne of force. In other words, divide the deflection measured on the screen by the applied force required to produce the deflection. A dyne is 1/980 gram when acted upon by gravity.
NOTE 54
Arm Resonance Is Related to Compliance of Stylus:
Distortion at low audio frequencies can be caused by unsuitable combinations of pickups and arms. Arm resonance is the resultant of the mass and construction of the angle with respect to the compliance of the stylus. Any arm resonance is objectionable. Therefore, if a frequency-response check (described in U64) shows that a resonant rise occurs at a frequency higher than 25 cycles, it is advisable to try another combination of pickup and arm. If a test record with frequencies low enough to check for arm resonances is not available, any record can be run at a slower speed. If a record is run at half the speed at which it was recorded, for example, all recorded frequencies will be halved.
--U-68
To Measure Turntable Speed
Equipment: Stroboscopic disc and 60-cycle lamp.
Connections Required: None.
Procedure : Place stroboscopic disc (Fig. 110) on turntable. Set player at desired speed. Observe disc under 60-cycle lighting.
Evaluation of Results: The markings that appear to stand still show the exact speed of the turntable. If the markings appear to move clockwise, the speed is too fast. If they appear to move counterclockwise, the speed is too slow.
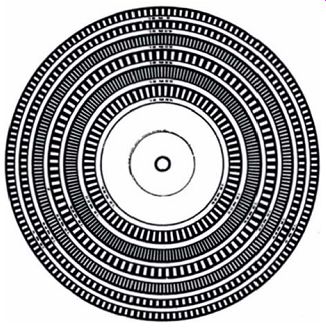
Fig. 110. A typical stroboscopic disc.
--U-69
To Measure the Intermodulation Distortion of a Pickup
Equipment: Two-tone test record, IM analyzer, terminating resistor, and preamplifier (optional).
Connections Required: Connect equipment as shown in Fig. 111.
Omit preamp if pickup has sufficient output to drive IM analyzer effectively. If the preamp is omitted, however, the pickup must work into its normal load resistance with a specified equalizer.
Procedure: Operate IM analyzer in the same manner as if an amplifier were being tested with two audio oscillators.
Evaluation of Results: Any nonlinearity in the pickup response is a corresponding percentage of IM distortion. In most cases the IM distortion of the preamp is low enough to be neglected. On the other hand, if the preamp has measurable IM distortion, the test results will be in error. Intermodulation distortion rises rapidly with poor tracking. This is the best test when you are adjusting stylus pressure to a critical optimum value.
It is not practical to subtract preamplifier IM distortion from pickup distortion, for this reason. We do not know whether the two distortion residues are in phase, out of phase, or combined at some intermediate phase angle.

Fig. 111. Test setup.
--U-70
To Check A Record Player for Rumble
Equipment: Test record, audio VTVM, preamplifier, and terminating resistor.
Connections Required: Connect terminating resistor to preamplifier output (if required). Connect VTVM to preamp output terminals, as shown in Fig. 112.
Procedure: Reproduce the 1- khz tone from the test record. Set preamp controls for fiat response. Adjust volume control for normal output from preamp. Then place the needle in an unrecorded groove. Increase VTVM sensitivity, until a reading is obtained. Finally, lift pickup from record, and note any change in VTVM reading. (See also U71.)
Evaluation of Results: The difference between VTVM readings with the needle in an unrecorded groove and with the pickup lifted from the record can be regarded as a rough measure of rumble. The measurement can be expressed as the number of db below rated amplifier output.
Rumble becomes noticeable in normal reproduction as a noise "like furniture moving around upstairs" during low-volume passages or while the needle is in an unrecorded groove. Rumble is a series of random pulses (not a cyclic low-frequency interference) ; it can thus be distinguished from wow and flutter. To avoid confusing rumble with wow and flutter, connect a sensitive scope at the amplifier output. The waveform will show whether the interference is random or cyclic. Rumble is caused by vibrations within the record player.

Fig. 112. Test setup.
--U-71
To Check a Record Player for Rumble (Filter Method)
Equipment: Low-pass filter with a cutoff frequency of approximately 300 cycles, test record, audio VTVM, and terminating resistors. (See Note 55.)
Connections Required: Connect equipment as shown in Fig. 113.
Procedure: First disconnect low-pass filter. Reproduce 1- khz tone from test record. Adjust preamp controls for maximum rated output and flat response. Then connect filter. Increase VTVM sensitivity until a reading is obtained. Observe readings as tone bands from 1 to 10 khz are fed to the preamp. Finally, lift pickup from record, and observe any change in reading.
Evaluation of Results: The difference between the VTVM readings with the needle tracking the test record and with the pickup lifted from the record is an approximate measure of rumble. The rumble interference is expressed as the number of db below maximum rated output from the amplifier.
This test is somewhat more accurate than the one in U70, because the low-pass filter eliminates any spurious midrange and high-frequency output. To distinguish between random rumble interference and wow or flutter, use a sensitive scope, as noted in U70.

Fig. 113. Test setup.
NOTE 55
Construction of Low-Pass Filters
Simple T-section low-pass filters can be easily constructed in the shop.
The circuit and component values for a low-pass T-section filter are shown in Fig. 114. Note carefully that required values of L and C depend upon the value of filter terminating resistor R. To obtain a sharp cutoff characteristic, use several T sections connected in series and terminated with R. Mount the coils in the sections at right angles, or shield them, so that they do not couple into one another. The value of L can be determined with an inductance bridge. Close-tolerance capacitors are readily available. Different values can be connected in series or parallel, if necessary. for an accurate odd value.

Fig. 114. A low-pass T-section filter.
--U-72
To Measure the Wow and Flutter of a Record Player
Equipment: Test record, and wow and flutter meter.
Connections Required: Connect output from phono cartridge (through suitable equalizer) to wow and flutter meter.
(See Fig. 115.)
Procedure: Reproduce the 1- khz tone band of the test record.
Adjust controls on wow and flutter meter, as required.
Evaluation of Results: The meter reads "percent of flutter." The reading is given as: average frequency where, maximum frequency is the highest deviation from average frequency, minimum frequency is the lowest deviation from average frequency due to wow or flutter.
A reading of less than 1% is considered acceptable. A good player may show a reading of as low as 0.1%. Wow and flutter meters are complex instruments, and are usually beyond the budget of the average shop. However, a person with a critical and experienced ear can roughly estimate wow and flutter by listening to a 1-khz tone from a test record.
Wow and flutter are essentially similar distortions, except that wow is low-frequency FM, and flutter is higher-frequency FM variation in tone reproduction. Both wow and flutter are caused by imperfect mechanical-drive systems in the player. (A more remote cause of wow is an off-center record).

Fig. 115. Test setup.
--U-73
To Check the Phasing of Speakers
Equipment: Flashlight cell or an ohmmeter.
Connections Required: Connect 1.5-volt source to speaker voice coil, as shown in Fig. 116.
Procedure: Note whether cone moves out or in when current flows through the voice coil. Reverse connection, if necessary, to make cone move out when current is applied. Then mark the positive terminal on the speaker. Repeat procedure for each speaker to be operated in parallel with the first speaker.
Evaluation of Results: The marked terminals are a guide to correct phasing of the speakers. Feed all marked terminals from the same bus, and all unmarked terminals from the other bus.
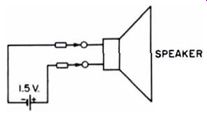
Fig. 116. Test setup.
NOTE 56
Pseudo-Basic Fundamental Generated by the Ear
If the fundamental is removed from a bass tone and the remaining overtones (harmonics) fed to a loudspeaker, the fundamental does not seem to disappear entirely. An illusion exists that the fundamental is still present. This is called pseudo bass, and is a characteristic of the hearing process. It can be compared with the illusion of three dimensions on a television screen. Both the seeing process and the hearing process strive to complete the visual or auditory clues provided.
NOTE 57
Proper Placement of Two Speakers Gives Pseudo-Stereophonic Sound
When two speakers are fed from the same source and are properly placed with respect to the listener, a pseudo-stereophonic effect results. (See Fig. 117.) The listener must be much closer to one speaker than to the other, and the levels must be suit ably adjusted. The essential feature is the time delay imposed upon one of the sound sources. Because of room acoustics, speaker locations are critical and must be determined experimentally.
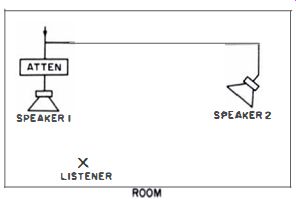
Fig. 117. Typical arrangement for producing pseudo-stereophonic sound.
--U-74
To Measure the Impedance of a Speaker
Equipment: Audio oscillator, audio VTVM, 30-ohm wire wound rheostat, and toggle switch or clip leads.
Connections Required: Connect equipment as shown in Fig. 118.
Procedure: Tune audio oscillator to 400 cycles. Set attenuator for approximately 1-volt output to speaker voice coil. Throw switch from position 1 to position 2. Adjust rheostat R until the voltage reading is the same in both switch positions.
Then disconnect R and measure its resistance.
Evaluation of Results: The resistance of the rheostat is the impedance of the speaker at 400 cycles. The speaker impedance can be similarly evaluated at steps over the complete audio range.
The impedances measured at different frequencies depend upon the baffle or enclosure used with the speaker. Hence, this method is useful for comparing the merit of one enclosure with another.
This technique gives the magnitude of the impedance, which is of chief interest.
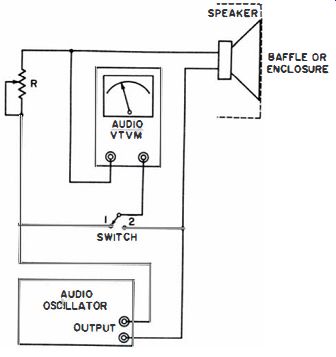
Fig. 118. Test setup.
--U-75
To Measure the Critical Damping Resistance of a Speaker
Equipment: Oscilloscope, crystal diode, 120K resistor, 0.5-mfd capacitor, 50-ohm wirewound rheostat, SPST switch, and dry cell.
Connections Required: Connect equipment as shown in Fig. 119.
Procedure: Alternately vary the rheostat, and open and close the switch. Observe any change in the ringing pattern on the scope screen.
Evaluation: The critical damping point is reached when the rheostat is adjusted to a point at which the pulse pattern on the scope shows no ringing when the switch is opened. The critical damping resistance is then the resistance of the rheostat at that particular setting.
For the most accurate determination, the speaker should be enclosed in its baffle.
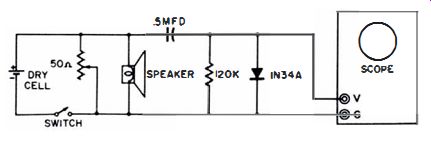
Fig. 119. Test setup.
NOTE 58
Damping-Factor Control Used in Some Amplifiers To Adjust Speaker Damping
Speaker damping is controlled principally by the source resistance from the output stage. This source resistance is coupled to the voice coil of the speaker (in most cases) through the output transformer. If the source resistance is low, the speaker damping will be large. On the other hand, if the source resistance is high, little damping will be imposed upon the speaker. This is electrical damping, as distinguished from mechanical damping imposed by air in the speaker enclosure. Variable damping is used in some amplifiers. This damping is provided by changing the amount of negative feedback in the amplifier system. The source resistance presented by the output stage varies with the amount of feedback. The damping factor can be changed in either direction by varying the amount of current feedback and voltage feedback. A typical circuit with a damping-factor control is shown in Fig. 120. Negative feedback occurs in the current-feedback circuit, which is connected from the common (C) tap, through R1B, to ground. When R1B is moved toward the cathode, current feedback is decreased as R1B is progressively shorted out. Damping increases as negative-current feedback decreases.
Negative feedback also occurs in the voltage-feedback circuit, which is connected from the top (l6-ohm tap) of the output transformer, through feedback resistor H2, to control R1A. As the control is turned toward the cathode, negative-voltage feedback increases, and even more damping is obtained. Controls R1A and R1B are ganged, for easier damping-factor adjustment.
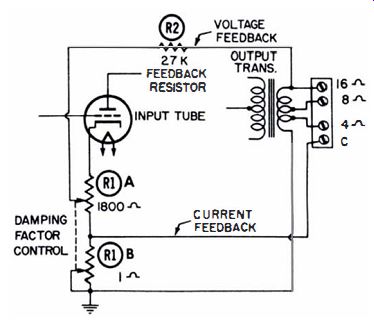
Fig. 120. Amplifier stage using a ganged damping factor control.
--U-76
To Check the Frequency Response of a Volume Control
Equipment: Audio oscillator and AC VTVM. Connections Required: Connect equipment as shown in Fig. 121.
Procedure:
Adjust audio oscillator and VTVM controls for approximately 3/4 full-scale reading when volume control is set to its maximum position. Then vary audio-oscillator frequency from, for example, 60 cycles to 15 khz. Observe any variation in meter reading. This is the reference-frequency response. Next reduce setting of volume control to around 2/3 of maximum. Advance output from audio oscillator for approximately 3/4 full-scale reading on the VTVM. Again vary audio-oscillator frequency over the range selected. Observe any variation in meter reading. Repeat the test with the volume control at about midrange and 1h of maximum.
Evaluation of Results: If the volume control has no frequency distortion, the reference-frequency response will be found at each control setting.
This is a particularly useful test when a shielded cable from a volume control is very long. The cable shunts capacitance across the control. If the capacitance is excessive, compared with the resistance of the control, the frequency response will be different at each control setting. The remedy is to reduce either the shunt capacitance or the resistance of the volume control.
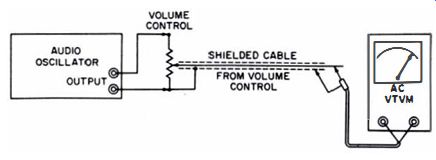
Fig. 121. Test setup.
--U-77
To Measure the Impedance of an Audio Component
Equipment: Audio oscillator, AC milliammeter, and AC VTVM. Connections Required: Connect equipment as shown in Fig. 122.
Procedure: Set audio oscillator to a standard test frequency, such as 400 or 1000 cycles. Keep output from oscillator at a relatively low level, in order to avoid waveform distortion due to generator loading, and core saturation when testing components with iron cores. Note VTVM and milliammeter readings.
Evaluation of Results: The impedance of the component is given by the formula:
Z=E+I
An audio VTVM has lower voltage scales than ordinary service VTVM's. On the other hand, at extremely low levels the measurement can become inaccurate because of stray-field pickup by the VTVM. Hence, when using an audio VTVM, make sure the test-signal level is not so low that stray pickup becomes noticeable. Note also that the impedance value at 400 cycles will not be the same as the impedance value at 1000 cycles, unless the component is purely resistive.
When an AC milliammeter is not available, an AC VTVM can be used in combination with a resistor to determine the amount of current flow, as shown in Fig. 123. Thus, if R is equal to 1000 ohms, the VTVM will indicate one volt for each milliampere of current. The accuracy of the measurement is no better than the accuracy of the resistor. Hence, a precision resistor should be used.
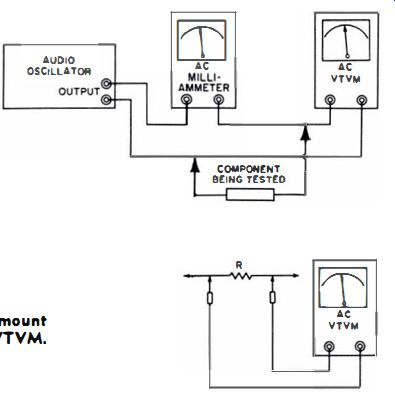
Fig. 122. Test setup.
Fig, 123. Determining the amount of current flow with an AC VTVM.
--U-78
To Measure the Phase Angle Between Voltage and Current in an Audio Component (Direct-Reading Electronic Phase-Meter Method)
Equipment: Audio oscillator, small value resistor, and electronic phase meter.
Connections Required: Connect equipment as shown in Fig. 124.
Procedure: Use the smallest value series resistor possible in order to minimize measurement error. Tune audio oscillator to desired test frequency, such as 400 cycles. Adjust phase meter attenuators to equalize input voltages. Switch meter to the Read position. Observe scale reading.
Evaluation of Results: The phase-shift meter indicates the angle between voltage and current directly in degrees.
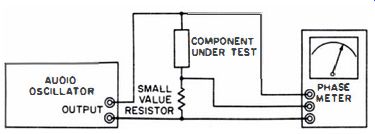
Fig. 124. Test setup.
--U-79
To Measure the Phase Angle Between Voltage and Current in an Audio Component (Oscilloscope Method)
Equipment: Audio oscillator, oscilloscope, and small value resistor.
Connections Required: Connect equipment as shown in Fig. 125.
Procedure: Use the smallest value resistor possible in order to minimize measurement error. Adjust scope gain controls for convenient pattern width and height. Set audio oscillator to desired test frequency (400 cycles is a standard test frequency). An ellipse should appear on the scope screen.
Evaluation of Results: The proportions of the ellipse give the phase angle between voltage and current.
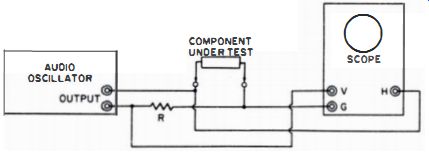
Fig. 125. Test setup.
--U-80
To Measure the Bass Resonant Frequency of a Speaker
Equipment: Audio oscillator, AC VTVM, and resistor with a value approximately ten times the nominal speaker impedance.
Connections Required: Connect equipment as shown in Fig. 126.
Procedure: Vary the frequency applied to the amplifier input in steps, noting the VTVM reading on each step. If desired, plot the readings versus frequency on a sheet of graph paper.
Evaluation of Results: A definite peak (or peaks) will appear somewhere at the low-frequency end of the audio range.
A typical frequency response for a small speaker is shown in Fig. 127. If the speaker is not mounted in a baffle or enclosure, the curve will show the actual resonant frequency of the speaker. On the other hand, if the speaker is in a baffle or enclosure, the response will be modified.
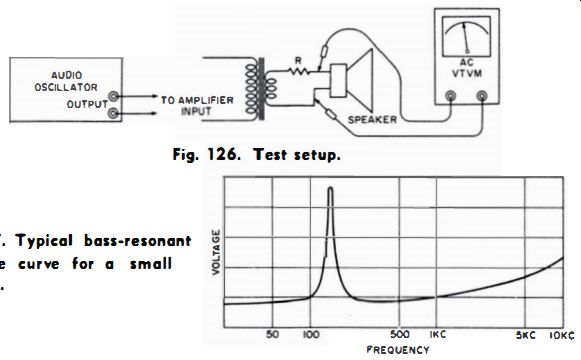
Fig. 126. Test setup.
Fig. 127. Typical bass-resonant response curve for a small speaker.
--U-81
To Measure the Compliance of a Speaker
Equipment: Audio oscillator; AC VTVM; resistor with a value about ten times the nominal speaker impedance; and an additional known weight, such as a dime (2.5 grams). Connections Required: Connect equipment as shown in Fig. 128.
Procedure: Measure the bass resonant frequency of the speaker, as explained in U80. Then tape a known weight (such as a dime, 2.5 grams) to the cone, near the voice coil. Again measure the bass resonant frequency.
Evaluation of Results: The compliance of the speaker is given by: where, C is the compliance in cm/ dyne, F, is the unloaded resonant frequency, F,w is the loaded resonant frequency, m is the added mass in grams, pi= 3.1416.

Fig. 128. Test setup.
To Measure the Intermodulation Distortion of a Speaker
Equipment: IM signal source (may be contained in an audio analyzer, or use two audio oscillators), low-distortion amplifier, good-quality microphone, microphone amplifier (low-distortion type) , and IM distortion analyzer.
Connections Required: Connect equipment as shown in Fig. 129.
Procedure: Make test in open air, to avoid reflection of sound from possible nonlinear reflecting surfaces. Drive speaker from IM signal source at normal output. Place microphone on speaker axis, and at a distance, to obtain normal output.
Measure percentage of IM distortion with IM distortion analyzer.
Many speakers have a relatively high percentage of intermodulation distortion. The distortion increases rapidly with high sound output. However, the amplifiers in the test must have a much lower IM distortion figure than the speaker. Otherwise, the test results will be invalid. A laboratory-quality microphone is not required; a good broadcast-type microphone will have a much better characteristic than most speakers.

Fig. 129. Test setup.
--U-83
To Measure the Erase Current in a Tape Recorder
Equipment: Audio VTVM and 100-ohm precision resistor.
Connections Required: Open the ground lead to the erase head, and insert the 100-ohm resistor. Connect the audio VTVM across the resistor (Fig. 130). Procedure: Note rms voltage reading on VTVM scale.
Evaluation of Results: Use Ohm's law to determine the erase current. Each volt drop across the 100-ohm resistor corresponds to 10 ma of current flow. Compare current value with manufacturer's specifications. If more than 200/ 0 low, check circuit components. Typical erase-current values range from 15 to 75 ma, depending upon design.
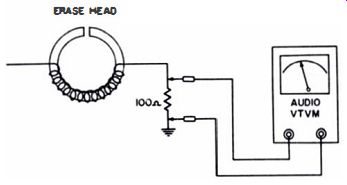
Fig. 130. Test setup.
--U-84
To Measure the Bias Current in the Recording Head
Equipment: Audio VTVM and 100-ohm resistor.
Connections Required: Open the return lead from the recording head, and insert a precision 100-ohm resistor. Connect audio VTVM across resistor, as shown in Fig. 131.
Procedure: Note the rms voltage reading on the VTVM scale.
Evaluation of Results: Calculate the bias current from Ohm's law.
Each volt dropped across the 100-ohm resistor corresponds to 10 ma. Compare the value of bias current with the value recommended by the recorder manufacturer. The correct bias current ranges from less than 1 ma to several ma, depending upon the design of the recording head.
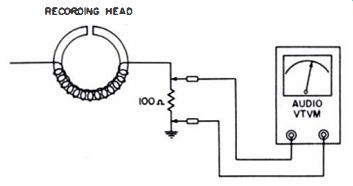
Fig. 131. Test setup.
--U-85
To Check for an Open or Shorted Coil in a Recording Head
Equipment: Audio oscillator, oscilloscope, and 100-ohm resistor.
Connections Required: Connect output terminals of audio oscillator to input terminals of recorder preamp. Connect vertical input terminals of scope across the recording head, as shown by solid line in Fig. 132. Pull bias-oscillator tube; otherwise, a false pattern will be displayed on the scope screen.
Procedure: Drive the preamp with approximately one volt at 400 cycles from the audio oscillator. Observe pattern on scope screen.
Evaluation of Results: No signal on the scope screen indicates' a short in the winding. To check for an open, connect the 100-ohm resistor in series with the ground lead of the head.
Apply the scope across the resistor. No signal on the scope indicates an open winding.
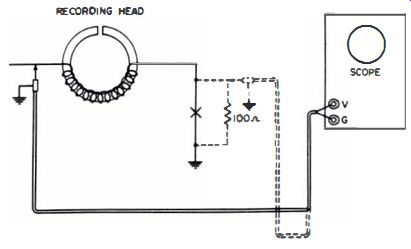
Fig. 132. Test setup.
--U-86
To Make a Tone-Burst Test of a Speaker
Equipment: Tone-burst generator (or audio oscillator and electronic switch) , terminating resistor, broadcast microphone, and oscilloscope.
Connections Required: Connect a suitable value load resistor across amplifier output terminals, and connect scope across resistor. Connect output from tone-burst generator to amplifier input terminals, as shown in Fig. 133A. In second test, replace load resistor with speaker. Connect scope input terminals to microphone (Fig. 133B). Procedure: With amplifier terminated in the load resistor, observe the tone-burst response of the amplifier. If noticeable distortion occurs, note the waveform. Check at steps over the complete audio-frequency range. Next, with speaker and microphone connected (Fig. 133B) , repeat the tone-burst tests.
Evaluation of Results: If the speaker has no tone-burst distortion, the patterns will be identical in the two tests. On the other hand, most speakers show appreciable tone-burst distortion.
The better the speaker, the more nearly the same are the patterns in the two tests.
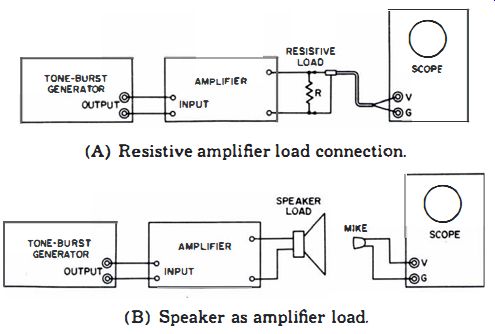
Fig. 133. Test setups for a tone-burst test of a speaker.
(A) Resistive amplifier load connection. (B) Speaker as amplifier load.
--U-87
To Test a Matched Pair of Audio-Output Tubes
Equipment: AC VTVM, audio oscillator, and terminating resistor.
Connections Required: Connect equipment as shown in Fig. 134.
Procedure: Adjust audio oscillator for a frequency of approximately 1 khz. Drive amplifier to maximum rated output, and observe reading on VTVM. Then interchange tubes T1 and T2. Again observe meter reading.
Caution: Turn amplifier off when interchanging tubes.
Evaluation of Results: If the tubes are exactly matched, the VTVM reading does not change when the tubes are interchanged.

Fig. 134. Test setup.