Signal-tracing is one of the principal troubleshooting methods used in radio-receiver servicing. Although ordinary signal tracers are quite useful, they fall short of the oscilloscope's information capability. A scope is the best radio signal tracer, because it gives both distortion data and exact amplitude measurements. Scope patterns show where distortion originates, and indicate the type of distortion present, which in turn helps to pinpoint the defective component. Accurate gain measurements can also be made, and these measurements cannot be approximated by an ordinary signal tracer.
Only a-m receiver troubleshooting is covered in this SECTION. Techniques applying to fm receivers are basically the same as those discussed in the SECTION on sound sections of tv receivers. Test signals for a-m radio troubleshooting should be supplied by an a-m generator.
Broadcast signals are difficult to work with because of their transient characteristics. Even a grid-dip meter is a more satisfactory signal source than a broadcast antenna.
SCOPE REQUIREMENTS
Conventional a-m chassis can be serviced with any scope which is adequate for black-and-white tv work. The highest signal frequency of interest is 1.5 MHz. A simple high-frequency probe must be used with the scope in order to avoid objectionable circuit loading and detuning. The configuration shown in Fig. 11 -1 meets these requirements.

Fig. 11-1. Tubular-ceramic trimmer capacitor serves as a high-frequency probe.
A tubular ceramic trimmer capacitor is convenient in making up a shop-constructed probe. The head is clipped from the adjusting screw, which is ground to a probe point. The unit is then placed in a small housing as shown, and connected to the coax input cable to the scope. Be sure to include the housing to shield the exposed surface of the trimmer. Otherwise, pickup of stray fields will be excessive, and tests in low-level circuits will be impractical. The adjusting screw should be turned out as far as possible, while permitting adequate deflection on the scope screen. This ensures that the circuit under test will not be loaded too much. In low-level circuits, the trimmer must be adjusted for a higher capacitance value.
Calibration is not often required, but is easily made when the occasion arises. The probe should be calibrated at the frequency of interest, such as 455 kHz, or other test value. To calibrate, use a signal generator or another receiver which is operating normally. A peak-to-peak reading vtvm is used to measure the voltage of the signal source.
If a radio receiver is used, connections are made for 455-kHz calibration, as shown in Fig. 11 -2.
The detector input circuit is heavily loaded, and the peak-to-peak vtvm indicates considerably less than the true signal voltage. However, this is not a matter for concern. It is necessary to work only from a known signal voltage. The vertical-gain control of the scope is adjusted for a convenient number of deflection intervals on the screen, and the reading of the peak-to-peak vtvm is noted. Signal amplitudes, in turn, can be measured on the scope screen until the probe adjustment is to be changed.
GAIN MEASUREMENTS

Fig. 11-2. Calibrating the probe and the scope.
An uncalibrated scope can be used for gain measurements, because the gain figure is merely a ratio. Connect the output from an a-m signal generator to the antenna input terminals of the receiver, or couple the output via a small coil into the loop antenna'. When the high-frequency probe of the scope is transferred from the grid to the plate terminal of an i-f stage, for example, the comparative heights of the two displays give a measure of stage gain, as seen in Fig. 11-3.
This is a basic display, but it is difficult to work with because the first waveform has a comparatively low amplitude. The decade attenuator of the scope is utilized accordingly. A simple example is this: if the first waveform has the same amplitude as the second waveform when the decade control is advanced one step for the first test, the stage gain is 10. The gain of a stage in normal operation depends on the avc bias voltage, and this in turn depends on the signal level. The receiver is therefore stabilized, preferably with a standard avc clamp voltage such as -1.5 volts.

Fig. 11-3. Basic gain displays. (A) Input. (B) Output.
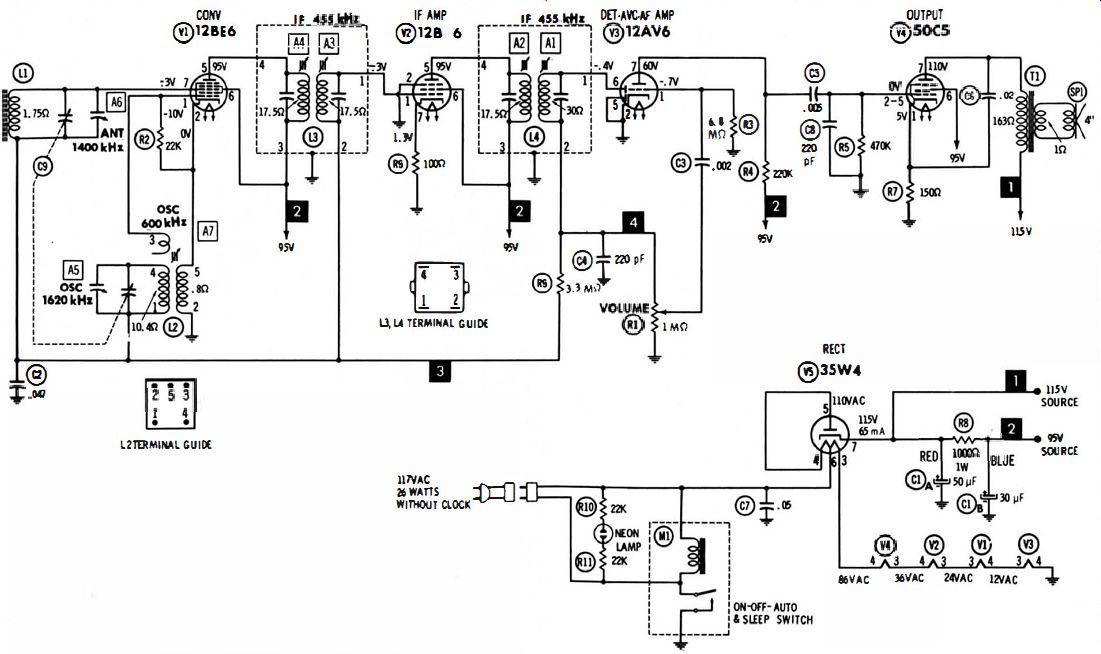
Fig. 11-4
It is important to be accurate in making gain measurements, and not to use the probe with an excessively high capacitance adjustment.
This detunes an i-f transformer objectionably, and also makes the gain figure incorrect. Also, do not overload the receiver with a high input signal from the generator. The signal will be clipped, and a false gain figure will be obtained. The normal gain for an i-f stage cannot be calculated easily, and reference should be made to the receiver service data or to a comparative check in a normally operating receiver.
The difficulty in making gain calculations is seen from an inspection of the circuit diagram in Fig. 11-4. Although the tube type is known, its mutual conductance .depends on the avc clamp voltage.
This information can sometimes be obtained from a tube manual, but the plate-load impedance into which the tube works can be determined only with lab-type equipment. Reliance must be placed, there-
fore, on service data for the particular receiver configuration, or on comparative data obtained from a similar receiver which is operating normally.
TYPE OF TEST SIGNAL
An amplitude-modulated test signal is illustrated in Fig. 11-3.
Modulation is necessary when using an ordinary signal tracer, but an unmodulated (cw) signal can be used when checking through the rf and i-f circuits with a scope. Patterns appear in such a case as in Fig. 11 -5. This photo shows individual i-f cycles because the horizontal deflection rate is used when displaying patterns such as are shown in Fig. 11-3. Internal sync is used to lock the pattern, in either case.
A cw signal is, of course, not suitable for checking the circuit past the detector, even if a dc scope is used. Although the detector generates a dc output voltage in response to a cw signal, this output is blocked by the audio coupling capacitor. Therefore, an amplitude-modulated signal must be used in these tests. A modulation depth of 30 percent is standard, but is not necessary.
The shape of the modulation envelope may change greatly as the generator is tuned through the receiver passband (see Fig. 11 -6). This is the result of incidental fm in the output of the a-m generator. The photos were made using a poor-quality generator having excessive incidental fm. The situation is aggravated by using a high percentage of modulation. As shown in Fig. 11-7, less change in envelope shape results with tuning when the modulation percentage is reduced, because the incidental fm is then less.
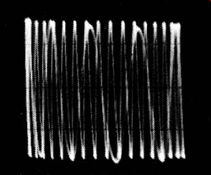
Fig. 11-5. The unmodulated output from the signal generator.
OSCILLATOR DEFECTS
The applied test signal is of no concern when checking the oscillator because it is a self -generating circuit. If the oscillator is not dead, a pattern such as in Fig. 11-5 is observed, regardless of whether or not an input signal is present. The normal amplitude of the oscillator output may be given in the receiver service data, or a comparative test can be made in another receiver with the same tube lineup as the receiver under test.

Fig. 11-6. Envelope changes with receiver tuning due to incidental fm.
A defective oscillator circuit occasionally has an output signal of normal amplitude, but runs off-frequency, making the receiver appear to be dead. This is a particularly difficult trouble condition when appreciable pre-selection is used in the receiver. It is a simple matter, however, to measure the oscillator frequency with a scope. Observe the number of peaks in the oscillator waveform. Then, apply the signal-generator output directly to the scope, and tune the generator for the same number of peaks. The reading on the generator dial is then the same as the oscillator frequency. In normal operation, the oscillator frequency will differ from the rf input frequency by 455 kHz. Even though the receiver dial may not be highly accurate, this procedure serves as a rough guide in evaluating oscillator operation.

Fig. 11-7. Envelope variation at lower-percentage modulation.
For a more accurate determination, apply an rf signal from the generator to the receiver, and connect the scope probe to the preamplifier output. Then tune the generator for maximum scope deflection.
If the circuit is operating properly, the reading of the generator dial will differ 455 kHz from the oscillator frequency.
If the oscillator frequency measures incorrectly (usually too high), look for an open capacitor in the circuit. A defective oscillator coil is a less frequent trouble cause, but is a possibility. To summarize, a preliminary scope test of the oscillator in case of a "dead receiver" complaint can often save considerable time.
I-F STAGE TROUBLES
Trouble symptoms in i-f circuits range from weak and/or distorted output to regeneration and spurious oscillation. Weak output is easily pinpointed by stage-gain checks. When a weak stage is located check the de voltages at the associated tube. A leaky screen bypass capacitor or an increase in value of a dropping resistor can reduce the screen voltage and cause a weak output. An open screen bypass capacitor does not change the dc screen voltage appreciably, but it does reduce stage gain because of negative feedback.
Excessive control-grid bias reduces gain, and can occur when an avc decoupling resistor is broken or otherwise open. The associated grid then "floats" and develops a high negative dc voltage from rectification of stray-field voltage. An open grid-return circuit has an extremely high impedance, and couples strongly into stray fields.
Check also the i-f transformer at the low-gain point, if advisable or necessary. Corrosion or mechanical defects can cause excessive signal loss. Such defects usually make it impossible to peak the transformer, although this is not always the case.
Low gain occurs in many receivers when a plate decoupling capacitor is open. This forces the plate signal to return to ground through the power supply, which can have an objectionably high impedance at 455 kHz. Circuits in which a plate decoupling capacitor does double duty can also develop low gain because of out-of-phase feedback from another circuit. Leakage in the decoupling capacitor results in low dc plate voltage. This does not reduce gain greatly at low signal levels, but compresses and distorts the signal at normal operating levels.
Receivers like the one shown in Fig. 11-4 have a multiple-duty screen bypass capacitor. If the capacitor is low in value, regeneration can develop. This causes the receiver to tune very sharply and distort a broadcast signal. The bandwidth of an i-f stage is reduced greatly when regeneration occurs. Use the scope to check for signal voltage across the bypass capacitor. If appreciable signal is present, replace the capacitor.
Again, if a multiple-duty screen bypass capacitor opens completely, the receiver can break into violent oscillation. Symptoms vary from a motorboating sound to a "dead" receiver. In the latter case, a dc voltage measurement at the detector output will show a very high value (the detector rectifies the high-level oscillation voltage). The scope shows a high-level i-f signal, with no rf signal applied to the receiver input.
If the receiver oscillates with the avc clamp voltage removed, but stabilizes when the clamp voltage is connected, look for an open bypass capacitor on the avc line. A leaky avc bypass causes overload distortion until the clamp voltage is applied, after which the receiver operates satisfactorily on normal signal levels.
AUDIO STAGE TESTS
If signal-tracing shows that the circuits up to the detector are operating normally, exchange the high-frequency probe for a low capacitance probe, and then proceed to check the waveforms past the detector. If there is weak or no output from the detector, the charging capacitor is first suspected. The capacitor may be leaky, shorted, or open. A cathode resistor which is open or greatly increased in value will cause weak or no output. An open detector decoupling resistor, or one which has increased in value, is a less common cause of weak or no detector output.
Audio stage-gain tests are made in the manner described previously. A typical pair of patterns is shown in Fig. 11 -8. In this example, the input waveform is not a true sine wave because of the generator characteristic. However, the output waveform is considerably different in shape from the input waveform, because the stage is distorting.
In economy-type receivers, such distortion is unavoidable and does not cause customer dissatisfaction. On the other hand, in an expensive receiver, an investigation would be made to determine the cause.
In case the gain is low and/or distortion excessive, check the dc voltages and circuit resistances first. Follow up with tests for open capacitors in the faulty stage. In the case of an open coupling capacitor, the scope will show normal signal at the input end of the capacitor, but little or no signal at the output end. In tracking down a distorted audio signal, do not be confused by inversion of the signal from grid to plate. A conventional amplifier shifts the phase of the input signal 180·. Thus, a waveform which is clipped at the' top in a grid circuit will be clipped at bottom in the plate circuit.

Fig. 11-8. Gain check of an audio-output stage. (A) Input. (B) Output.
HUM TRACING
When there is objectionable hum in the speaker output, check the power-supply ripple first. A filter capacitor may have marginal value, or a filter choke may be defective. If the ripple is not abnormally high, the hum voltage is probably entering at some point in the signal circuits. Trace back from the speaker with the scope to find where the hum first appears. A shielded lead in the audio-input stage, for example, may be poorly grounded. Or a defective socket can inject hum voltage from the heater into a cathode circuit which operates above ground. Socket leakage between heater and grid terminals also causes audible hum.
FM STEREO MULTIPLEX TESTS AND TROUBLESHOOTING
Although fm stereo multiplex servicing is somewhat more complicated than standard am or fm radio servicing, it can be performed quite easily with the proper test equipment. The basic test consists of a separation check, as illustrated in Fig. 1 1-9. A multiplex receiver has two outputs, called the left (L) and the right (R) channel. It is advisable to disconnect the two speakers, and load the output terminals with resistors of rated value. A scope is connected across each load resistor in turn, and the channel response is checked with a signal from an fm multiplex generator; the output from the generator is connected to the antenna input terminals of the receiver.

Fig. 11-9. Basic 1m stereo separation check. (B) Left-channel output. (A)
Test setup. (C) Right-channel output.
The generator usually has a fixed-frequency output, such as 100 MHz. Hence, the multiplex receiver must be tuned to this frequency.
First, set the generator controls for L-channel output, with the scope connected across the left-channel load resistor. Adjust the separation control on the receiver to obtain maximum pattern height, as shown in Fig. 11 -9B. Then, set the generator for R-channel output; if complete separation is obtained, only a horizontal line will be displayed on the scope screen, as shown in Fig. 1 1-9C. However, a small pattern will usually be observed; therefore, adjust the separation control slightly to minimize the amplitude of the pattern.
Separation is rated in dB by the receiver manufacturer. Observe the relative amplitudes of the L- and R-channel responses. The ratio of these amplitudes is the voltage ratio, which corresponds to dB values.
After the dB separation is measured for the left channel, repeat the test for the right-channel load resistor. If the dB separation is less than the manufacturer's rating, there is probably a defect in the multiplex receiver. Look for a faulty tube first; transistors and semiconductor diodes are less likely to cause trouble than tubes. However, if a tube is not the cause, capacitors should be checked.
Capacitors are more common troublemakers than resistors or coils.
It is also possible that poor separation is due to misalignment; however, we check alignment last. Some fm multiplex generators have a built-in rf sweep generator, so that alignment can be checked with the same equipment that is used to check separation. The service data for the receiver should be consulted to determine the proper connection points for the scope when a sweep-alignment test is made. Note that an external marker generator may be required if the fm multiplex general or does not have built-in marker facilities.
After prolonged service, the generator may require touch-up of its maintenance controls. To check the generator, the composite audio signal is fed to the vertical-input terminals of a scope, as shown in Fig. 11-10. Normal waveforms with and without the 19-kHz pilot signal are illustrated in Fig. 11-10B and C. If the waveforms are distorted, the generator maintenance controls should be readjusted as explained in the instruction manual for the generator. Of course, any defective tubes in the generator must be replaced before correct waveforms can be obtained.
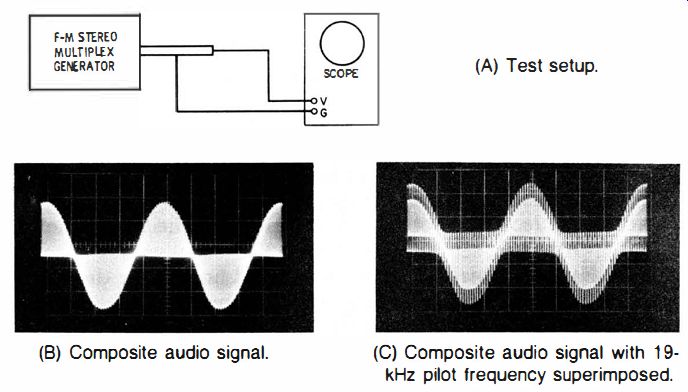
Fig. 11-10. Multiplex generator output check. (A) Test setup. (B) Composite
audio signal. (C) Composite audio signal with 19 kHz pilot frequency superimposed.
The normal composite audio signal has the waveshape illustrated in Fig. 11 -10. This waveform is built up as follows: Suppose that the generator is set for L-channel output; the L-channel signal will be a sine wave, as shown in Fig. 11-11A, and the R-channel signal will be zero, as shown in Fig. 11 -1 1 B. To form the composite audio signal, the L and R signals are first added together to obtain an L + R signal.
It follows from Fig. 11 -1 1 that the L + R signal is the same as the L-channel signal, because 1 kHz + 0 = 1 kHz.

Fig. 11-11. Left- and right-channel signals when generator is set for L channel
output. (A) Left-channel signal-1 kHz. (B) Right-channel signal-zero.
Next, the R-channel signal is subtracted from the L-channel signal to form the L - R signal. Again, the L - R signal will be the same as the L signal in this case, because 1 kHz - 0 = I kHz. Now, let us follow the processing of the L + R and L - R signals in the generator. The L + R signal is used, without any change, in formation of the composite audio signal. On the other hand, the L - R signal is amplitude-modulated on a 38-kHz subcarrier. The amplitude-modulated waveform is shown in Fig. 11 -12. However, the 38 kHz subcarrier is suppressed from the modulated waveform. Refer to Fig. 11-13.
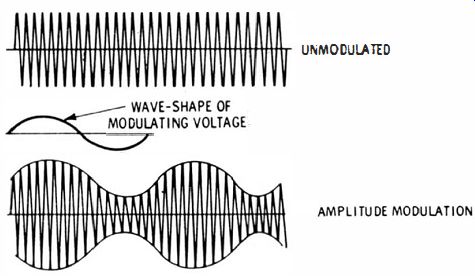
Fig. 11-12. The L-R signal is amplitude-modulated on a 38-kHz subcarrier.
When a carrier (or a subcarrier) is amplitude-modulated by a sine wave, a pair of sideband frequencies is generated, as illustrated in Fig. 11-13. The carrier is suppressed by means of a balanced modulator.
This leaves the upper and lower sidebands. These sum and difference frequencies beat together to form a double-frequency modulation envelope, as shown in Fig. II -14. Note that when the carrier (or subcarrier) is removed from an amplitude-modulated waveform, the envelope frequency doubles.

Fig. 11-13. Two sideband frequencies are generated by amplitude modulation.
Finally, the composite audio signal is formed by combining the L+ R signal (which is a 1-kHz sine wave) with the waveform "sidebands without carrier" illustrated in Fig. 11-14. The addition of these two waveforms will alternately "raise" and "lower" the modulated waveform, producing the composite audio signal shown in Fig. 11-10B. When the 19-kHz pilot frequency is switched on, we ·see the pilot signal riding on the composite audio signal, as illustrated in Fig. 11-10C.
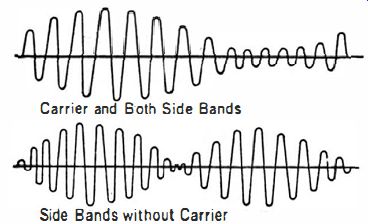
Fig. 11 -14. Suppression of the carrier results In a double-frequency modulation
envelope.
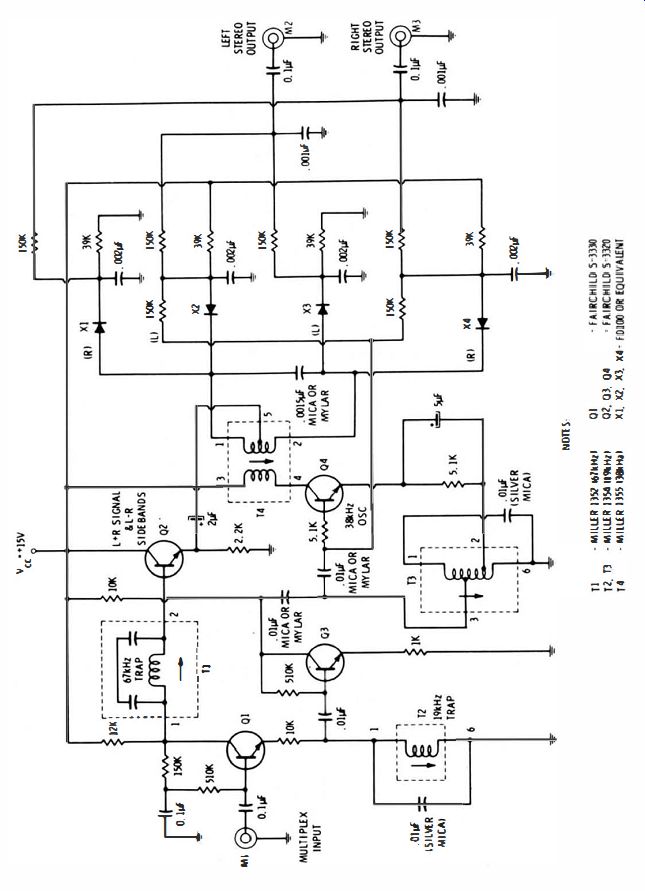
Fig. 11 -15. A switching-bridge type of multiplex decoder.
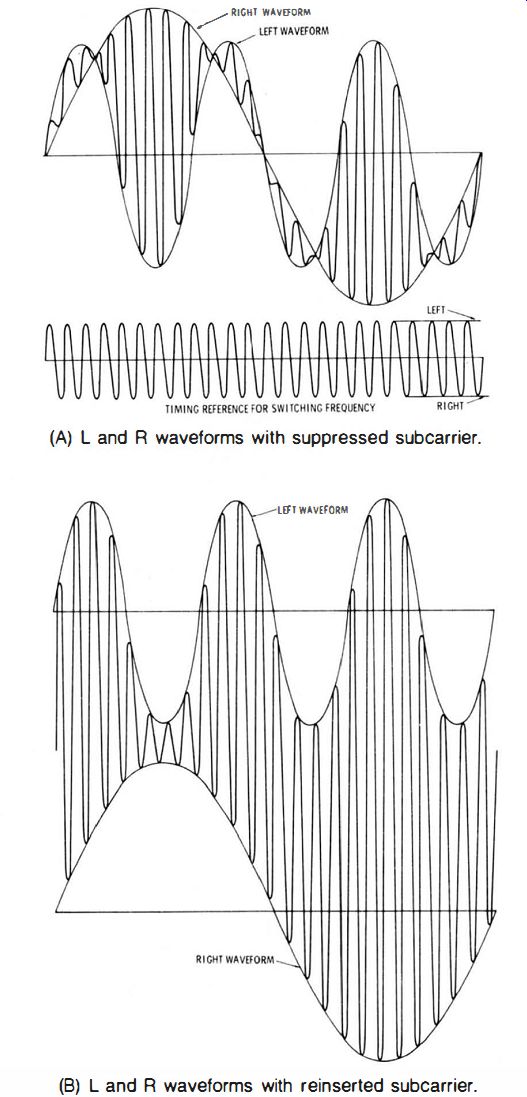
Fig. 11-16. Stereo multiplex waveforms. (A) L and R waveforms with suppressed
subcarrier. (B) Land R waveforms with reinserted subcarrier.
It is helpful to observe the configuration for a switching-bridge type of multiplex decoder, shown in Fig. 11 -15. This is the most widely used decoder design. Its circuit action can be easily understood by reference to Fig. 11-16, which shows the basic multiplex waveforms processed by the decoder. The input to the switching bridge consists of the L and R waveforms with suppressed subcarrier, as seen in Fig. 11-16A; another input to the bridge consists of the 38-MHz subcarrier. This subcarrier is reinserted by the bridge, and the result is the waveform shown in Fig. 11-16B. Note that the L information now appears at the top of the waveform and that the R information appears at the bottom of the waveform. The L and R audio signals are then separated.

Fig. 11-17. Switching-bridge circuit action: The four left-hand diodes conduct
when the 38-kHz voltage has the polarity shown; the four right-hand diodes
conduct when the polarity is reversed.
With reference to Fig. 11 - 17, the left-hand and right-hand sides of the bridge conduct alternately, depending on the polarity of the 38 kHz switching signal. In other words, a sampling action takes place whereby the right-hand side of the bridge supplies samples of the L signal, and the left-hand side of the bridge supplies samples of the R signal. This is basically a detector action, except that two different signals are being detected alternately. Outputs from the switching bridge are applied to low-pass filters in order to remove the 38-kHz component and pass the audio information. With reference to Fig. 11 -15, this filtering action is provided by 0.001- uF capacitors and 150-K resistors connected to the L and R output leads.