<< cont. from part 1
6.1 Diode versus Synchronous Rectifiers
In the absence of a parallel synchronous rectifier, the drop across the rectifier diode in a switching regulator, FIG. 18A causes an efficiency loss that worsens as the output voltage falls. The Schottky diode simple buck converter clamps the switching node, the inductor's swinging terminal, as the inductor discharges.
In the synchronous-rectifier version of FIG. 18B, a large N-channel MOSFET switch replaces the diode and forms a half-bridge configuration that clamps the switching node to -0.1 V or less. The diode in Fig. 19 18A clamps the node to -0.35 V. Intuitively, losses in either type of rectifier increase with reduced output voltage. At VIN2VOUT, the rectifier voltage drop is in series with the load voltage for about half the switching period. As the output voltage falls, power lost in the rectifier becomes a greater fraction of the load power.
The basic trade-off between using diode or MOSFET rectifiers is whether the power needed to drive the MOSFET gate cancels the efficiency gained from a reduced forward-voltage drop. The synchronous rectifier's efficiency gain depends strongly on load current, battery voltage, output voltage, switching frequency, and other application parameters. Higher battery voltage and lighter load current enhance the value of a synchro nous rectifier. The duty factor, which equals 1 - D, where D equals ton /(ton + toff ), for the main switch, increases with the battery voltage. Also, the forward drop decreases with the load current.
The gate-drive signal is a key factor in calculating a synchronous rectifier's efficiency gain. For example, the gate loss can be reduced by using a gate drive of 5 V (as for logic-level MOSFETs) instead of the input (battery) voltage. Simply supply the gate drive from a 5 V linear regulator powered from the battery. Another method is to bootstrap the gate driver's power-supply rails from the regulator's output voltage. (This approach adds complexity in the form of a bypass switch for the initial power-up.) One must weigh the lower loss associated with reduced gate voltage against the higher RDS(ON) resulting from a less-enhanced MOSFET.
When comparing diode and synchronous rectifiers, note that the synchronous rectifier MOSFET doesn't always replace the usual Schottky diode. To prevent switching overlap of the high-side and low-side MOSFETs that might cause destructive cross-conduction currents, most switching regulators include a dead time delay. The synchronous rectifier MOSFET contains an integral, parasitic body diode that can act as a clamp and catches the negative inductor voltage swing during this dead time. This diode is lossy, is slow to turn off, and can cause a 1-2% efficiency drop.
To squeeze the last percent of efficiency out of a power supply, a Schottky diode can be placed in parallel with the synchronous rectifier MOSFET. This diode conducts only during the dead time. A Schottky diode in parallel with the silicon body diode turns on at a lower voltage, ensuring that the body diode never conducts.
Generally, a Schottky diode used in this way can be smaller and cheaper than the type the simple buck circuit requires, because the average diode current is low. (Schottky diodes usually have peak current ratings much greater than their dc current ratings.) It's important to note that conduction losses during the dead time can become significant at high switching frequencies.
For example, in a 300 kHz converter with a 100 ns dead time, the extra power dissipated is equal to
I_LOAD x V_FWD x td x f = 6 mW
(eqn 22)
where, f is the switching frequency td is the dead time) for a 2.5 V, 1 W supply, which represents an efficiency loss of about 0.5%.
Light-load efficiency is a key parameter when the load spends a long time in a nearly dormant suspend mode. For the buck-type switch-mode regulators, the synchronous rectifier's control circuit has a strong influence on light-load efficiency and noise performance.
The key issue for light-load or no-load conditions is the timing of the MOSFET's turn-off signal.
When load current is light, the inductor current discharges to zero, becoming discontinuous or reversing direction. There are at least three options in dealing with this problem:
1. Continue to hold the synchronous switch on until the beginning of the next cycle, allowing the inductor to reverse.
2. Completely disable the synchronous rectifier at light loads.
3. Sense the inductor current's zero crossing and shut off the synchronous rectifier on a cycle-by-cycle basis.
Each approach involves a trade-off in different areas.
In the past, the option that designers widely used was holding the inductor switch on until the beginning of the next cycle which requires driving the MOSFET gates with complementary waveforms. This approach produces lower noise and allows a simple control scheme. The gate-drive signal is simply an inverted, opposite phase version of the drive signal for the high side switch. Noise is lower because the absence of pulse skipping ensures a constant switching frequency, regardless of load. A constant, fundamental switching frequency ensures that output ripple and EMI at the harmonic frequencies won't cause havoc in the IF bands of an audio or radio system. This approach also eliminates the dead time during which a resonant-tank circuit comprising the inductor and stray capacitance at the switching node can introduce ringing.
Unfortunately when the inductor current reverses, the synchronous rectifier pulls current from the output.
The circuit replaces this lost output energy during the next half cycle. However, at the beginning of the cycle when the high-side switch turns on, the circuit transfers the inductor energy stored during the earlier current reversal to the input-bypass capacitor.
This action resembles perpetual motion, in which energy shuttles between the input and output capacitors. As energy shuttles back and forth, the circuit dissipates power in all its parasitic resistances and switching inefficiencies, so additional energy is necessary to maintain the shuttling action. The most obvious consequence is a high no-load supply current of typically 5 mA for the 2.5 V, 1 W circuit.
The second option, turning off the synchronous rectifier entirely at light loads, offers simplicity and low quiescent supply current. This method can be implemented in conjunction with a pulse-skipping operation, governed by a light-load pulse-frequency-modulation (PFM) control scheme. Whenever the circuit goes into its light-load pulse skipping mode, the circuit disables the synchronous rectifier that lets an accompanying parallel Schottky diode do all the work. Disabling the synchronous rectifier prevents the reversal of inductor current, and the problem of shuttling energy back and forth does not arise.
The final option, sensing the inductor current's zero crossing and quickly latching the synchronous rectifier off, turns off the synchronous rectifier on a cycle-by cycle basis. This method provides the highest light-load efficiency, because the synchronous rectifier does its job without allowing the inductor current to reverse. But, to be effective, the switching-regulator IC's current-sense amplifier that monitors the inductor current must combine high speed with low power consumption.
A logic-control input can shift the synchronous-rectifier operation from the complementary-drive option to the off-at-zero option, FIG. 19. When low, "SKIP" allows normal operation: The circuit employs pulse width modulation (PWM) for heavy loads and automatically switches to a low-quiescent-current pulse-skip ping mode for light loads. When high, "SKIP" forces the IC to a low-noise fixed-frequency PWM mode, regardless of the load. Also, applying a high level to "SKIP" disables the IC's zero-crossing detector, allowing the inductor current to reverse direction, which suppresses the parasitic resonant LC tank circuit.
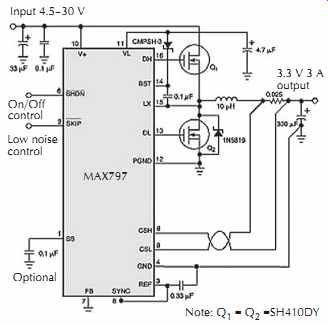
FIG. 19. A N-channel buck regulator which has a low noise logic-control
input that adjusts the synchronous rectifier's timing on the fly. Courtesy
Maxim Integrated Products.
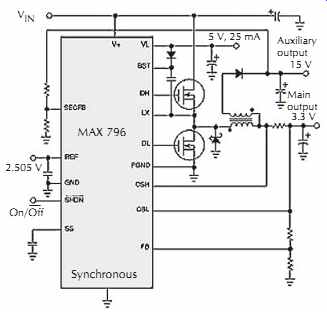
FIG. 20. A feedback input for the secondary winding (SECFB) greatly improves
the cross regulation for multiple outputs under conditions of light primary
loading or low I/O differential voltage. Courtesy Maxim Integrated Products.
Another issue related to a synchronous rectifier's gate-drive timing is the cross regulation of multiple outputs obtained using flyback windings. Placing an extra winding or a coupled inductor on a buck regulator's inductor core can provide an auxiliary output voltage for the cost of a diode, a capacitor, and a little wire, FIG. 20.
Normally, the coupled-inductor flyback trick in Fig. 20 stores energy in the core when the high-side switch is on and discharges some of it through the secondary winding to an auxiliary 15 V output when the synchronous rectifier's low-side switch is on. During discharge, the voltage across the primary is equal to VOUT + VSAT, where VOUT is the main output and VSAT is the synchronous rectifier's saturation voltage. There fore, the secondary output voltage equals the primary output times the turns ratio.
Unfortunately, if the synchronous rectifier turns off at zero current and the primary load is light or nonexistent, the 15 V output sags to ground because the core stores no energy at this time. If the synchronous rectifier remains on, the primary current can reverse and let the transformer operate in the forward mode, providing a theoretically infinite output-current capability that prevents the 15 V output from sagging. Unfortunately, quiescent supply current suffers a great deal.
However, the circuit in FIG. 20 achieves excel lent cross regulation with no penalty in quiescent supply current. A second, extra feedback loop senses the 15 V output. If this output is in regulation, the synchronous rectifier turns off at zero current as usual. If the output drops below 13 V, the synchronous rectifier remains on for an extra microsecond after the primary current reaches zero, so the 15 V output can deliver hundreds of milliamps even with no load on the main 5 V output.
This scheme also provides a better 15 V load capability at low values of VIN - VOUT, which becomes important if the input voltage drops.
6.2 Secondary-Side Synchronous Rectifiers
Multiple synchronous rectifiers on the secondary windings can replace the usual high-voltage rectifier diodes in multiple-output nonisolated applications, FIG. 21.
This substitution can dramatically improve load regulation on the auxiliary outputs and often eliminates the need for linear regulators, which are otherwise added to increase the output accuracy. The MOSFET must be selected with a breakdown rating high enough to with stand the flyback voltage, which can be much higher than the input voltage. Tying the gates of the secondary side MOSFETs directly to the gate of the main synchro nous MOSFET (the DL terminal) provides the necessary gate drive.
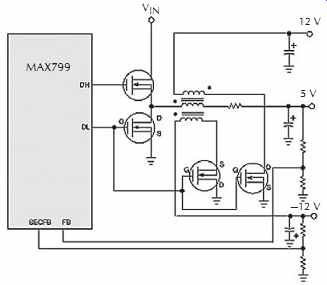
FIG. 21. Coupled-inductor secondary outputs can benefit from synchronous
rectification. To accommodate negative auxiliary outputs, swap the secondary-side
MOS FET's drain and source terminals. (For clarity, this simplified schematic
omits most of the ancillary components needed to make the switching regulator
work.) Courtesy Maxim Integrated Products.
Another neat trick enables a synchronous rectifier to provide gate drive for the high-side switching MOSFET. Tapping the external switching node to generate a gate-drive signal higher than the supply voltage enables the use of N-channel MOSFETs for both switches in a synchronous-rectifier buck converter.
Compared to P-channel types, N-channel MOSFETs have many advantages, because their superior carrier mobility confers a near 2:1 improvement in gate capacitance and on-resistance.
A flying-capacitor boost circuit provides the high side gate drive, FIG. 22. The flying capacitor is in parallel with the high-side MOSFET's gate-source terminals. The circuit alternatively charges this capacitor from an external 5 V supply through the diode and places the capacitor in parallel with the high-side MOSFET's gate-source terminals. The charged capacitor then acts as supply voltage for the internal gate drive inverter, which is comparable to several 74HC04 sections in parallel. Biased by the switching node, the inverter's negative rail rides on the power-switching waveform at the LX terminal.
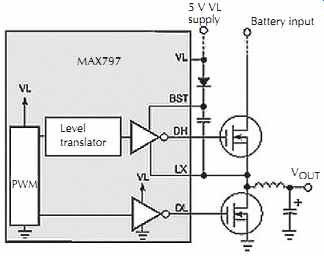
FIG. 22. Driven by the switching node (the left end of the inductor),
the capacitor between BST and LX provides an elevated supply rail for the upper
gate-drive inverter. Maxim Integrated Products.
A flying capacitor then acts as supply voltage for the internal gate-drive inverter, which is comparable to several 74HC04 sections in parallel. Biased by the switching node, the inverter's negative rail rides on the power-switching waveform at the LX terminal.
The synchronous rectifier is indispensable to the FIG. 22 gate-drive boost supply. Without this low-side switch, the circuit may not start at initial power-up.
When power is first applied, the low-side MOSFET forces the switching node to 0 V and charges the boost capacitor to 5 V.
Synchronous rectifiers can be incorporated in the boost and inverting topologies. The boost regulator in FIG. 23 employs an internal pnp synchronous rectifier in the active rectifier block. Boost topologies require the rectifier in series with VOUT, so the IC connects the pnp collector to the output and the emitter to the switching node. The rectifier control block's fast comparator detects whether the rectifier is forward- or reverse-biased and drives the pnp transistor on or off accordingly. When the transistor is on, an adaptive base current control circuit keeps the transistor on the edge of saturation. This condition minimizes the efficiency loss due to base current and maintains high switching speed by minimizing the delay due to stored base charge.
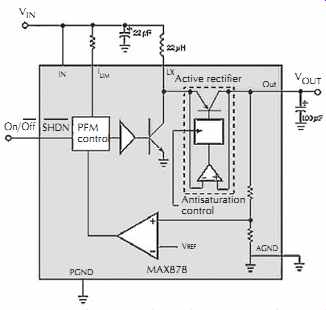
FIG. 23. The internal synchronous rectifier in this boost regulator,
the active rectifier, replaces the Schottky rectifier often used at that location.
Courtesy Maxim Integrated Products.
An interesting side benefit of the pnp synchronous rectifier is its ability to provide both step-up and step down action. For ordinary boost regulators, the input voltage range is limited by an input-to-output path through the inductor and the diode. (This unwanted path is inherent in the simple boost topology.) Thus, if VIN exceeds VOUT, the conduction path through the rectifier can drag the output upward, possibly damaging the load with overvoltage.
The pnp-rectifier circuit in FIG. 23 operates in switch mode, even when VIN exceeds VOUT, with the active rectifier acting as the switch. This action is more akin to a regulating charge pump than to a buck regulator, because the buck mode of operation requires a second switch on the high side.
Inverting-topology regulators that generate negative voltages, sometimes called buck-boost regulators, are useful applications for synchronous rectification. Like the boost topology, the inverting topology connects the synchronous rectifier in series with the output rather than to ground, FIG. 24. In this example, the synchronous switch is an N-channel MOSFET with its source tied to the negative output and its drain tied to the switching node.
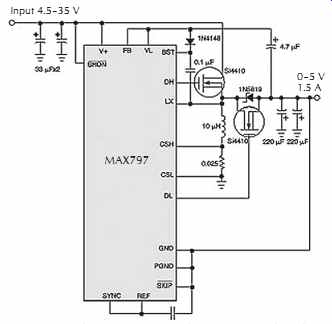
FIG. 24. The inverting topology requires that the synchronous switch
be in series with the output. Courtesy Maxim Integrated Products.
The circuit tricks the resulting 300 kHz buck regulator into performing as an inverting-topology switcher by connecting the IC's GND pin to the negative output voltage instead of circuit ground. This switching regulator's efficiency of about 88% exceeds that of comparable asynchronous-rectifier supplies by 4%.
7. Converters
A converter changes low-voltage dc to high-voltage dc.
Basically, a dc-to-dc converter consists of a dc source of potential (generally a battery) applied to a pair of switching transistors. The transistors convert the applied dc voltage to a high-frequency ac voltage. The ac voltage is then transformed to a high voltage that is rectified to dc again and filtered in the conventional manner.
Power supplies of this nature are often used for a source of high voltage, where the usual ac line voltage is not available.
8. Inverters
An inverter converts direct current to alternating cur rent. Inverters are used in applications where the primary source of power is direct current. Because direct current cannot be transformed, it is converted to alternating current so that alternating current output from the inverter may be applied to a transformer to supply the desired voltage.
An inverter operates much like the switching circuit and transformer section of a converter. In FIG. 25, R1 and R2 assure that the oscillator (switch) will start. T1 is a saturable base-drive transformer that determines the drive current to turn on Q1 or Q2. T2 is a non-saturable transformer; therefore, collector current through Q1 and Q2 is dependent upon load. Base resistors Rb are current limiting resistors. By adding a rectifier and filter section, this inverter can be changed to a converter.
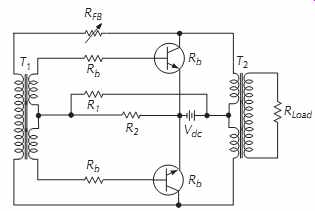
FIG. 25. Two-transistor, two-transformer, push-pull inverter that uses
a resistive voltage-divider network to provide starting bias.
9. Ultra Capacitor (UPS)
A backup power supply for medical computers manufactured by Ram Technologies utilizes ultra capacitor technology. The model 8000 Ultra UPS module contains the charge and discharge circuitry to ensure high efficiency energy transfer, FIG. 26. The proprietary patent pending module is designed to directly interface with RAM Technologies line of ATX/SFX medical grade power supplies. The unit can be modified by Ram Technologies to operate with other sensitive and/or life threatening devices. The module may be expanded by adding additional ultra capacitor modules. The base module contains 8000 J of energy; expansion modules also contain 8000 J of energy. Any number of additional modules can be added to increase load capabilities. Fig. 27 shows a typical installation in a computer.
The module's input voltage is +12 Vdc and has an efficiency of >90%. Charge time is 2 minutes for each 8kJ module.
The maximum output current is 30 A at 12 Vdc. Run time is

(eqn 23)
where, Run time is in minutes, dc load is in watts.
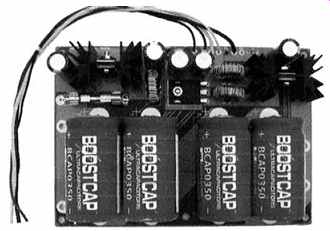
FIG. 26. Ultra capacitor UPS power supply module.
Courtesy Ram Technologies LLC.
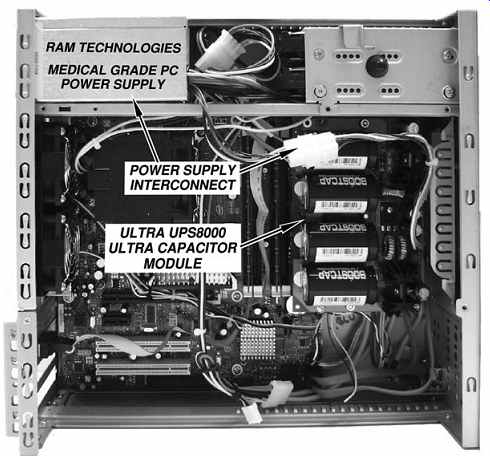
FIG. 27. Typical installation of a ultra capacitor UPS module in a computer.
Ram Technologies LLC.
9.1 Ultra Capacitor Characteristics
Ultra Capacitors do not degrade in time as batteries do so reliability is high.
UCs have a capacity one million times that of a standard electrolytic capacitors. This is accomplished by depositing carbon on an aluminum substrate which can be etched it give dramatically increased surface area and low impedance. A typical UC 30 mm × 50 mm can have up to 400 F of capacitance with a working voltage of 2.5 V.
The energy stored in a capacitor is CV2/2. To have the same energy density as current Lithium Ion batteries, the working voltage for a given size would have to be increased to 5 V. This would yield 4 times the energy density of current UC technology and make UCs the ultimate energy storage device. It is just a matter of time before technology reveals materials capable of having dielectrics in the 5 V or higher range and making batteries as we know them today obsolete.
Charging. Ultra Capacitors have extremely low internal impedance so power limited charging must be used to avoid overloading the charger. UCs are also sensitive to voltage. They must be operated below their rating to avoid destruction. Designers tend to charge them as close as possible together maximum voltage to extract the maximum energy from them.
Discharging: Unlike batteries Ultra Capacitors store their energy over their entire voltage range which makes the design of the boost complex due to the wide input voltage range and overall efficiency.
10. Batteries
Batteries offer a means of producing a smooth, ripple free, hum-free, portable power supply. A battery's capacity is rated in ampere-hours (Ah). Three facts about batteries are:
1. An ampere-hour can be a 1 A drain for 1 h, 0.5 A drain for 2 h, or 2 A drain for 0.5 h.
2. A 12 V liquid battery is generally considered completely discharged when its voltage reaches 10.5 V.
3. Batteries for cycling service--i.e. powering amplifiers etc.- are normally rated with:
• A 20 h discharge rate, which means a 20 Ah battery will deliver 1 A for 20 h and a 100 Ah battery will deliver 5 A for 20 h.
• A reserve capacity stated in minutes for a 25 A discharge rate.
• Discharging batteries below 50% shortens their life.
A cell or battery is an electrochemical system that converts chemical energy into electrical energy. When the chemical action is reversible, the battery is a secondary or rechargeable system.
To be rechargeable, the positive and negative electrodes of a battery must be capable of being converted back to their original state following a discharge. Thus, the battery must be electrically recharged by reversing the process that occurred during its discharge cycle.
10.1 Temperature Effects
The standard rating for batteries is at 25°C (77°F). Battery capacity is reduced at lower temperature. At freezing, Ah capacity is reduced to 80%. At -27°C (-22°F), Ah capacity drops to 50%. At 122°F, capacity is increased by 12%.
Battery charging voltage is also affected by tempera ture. It will vary from about 2.74 V/cell (16.4 V) at -40°C (-40°F) to 2.3 volts per cell (13.8 V) at 50°C (122°F).
Temperature also affects battery life. While battery capacity is reduced by 50% at -22°F, battery life increases about 60%. Battery life is reduced at higher temperatures. In fact, for every 8.3°C (15°F) over 25°C (77°F), battery life is cut in half. This holds true for all types of lead-acid batteries, sealed, gelled, and AGM.
10.2 Cycles versus Battery Life
A battery cycle is one complete discharge and recharge cycle and is often considered a discharge from 100% to 20%, and then recharged back to 100%. Other ratings for depth of discharge (DOD) cycles are 10%, 20%, and 50%.
Battery life is directly related to how deep the battery is cycled each time. If a battery DOD is 50% every cycle, it will last twice as long as if the DOD is 80%. If the DOD cycle is only 10%, it will last about five times as long as one cycled to 50%. A 50% DOD is usually recommended. A battery that has a DOD cycle of 5% or less usually does not last as long as one cycled down 10% because at very shallow cycles, the lead dioxide tends to build up in clumps on the positive plates rather in an even film.
10.3 Battery Voltage
All lead-acid batteries supply about 2.14 volts per cell (V/cell), or 12.6-12.8 V for a 12 volt battery when fully charged. Batteries that are stored for long periods will eventually self-discharge. This varies with battery type, age, and temperature. Self-discharge can range from 1-15% per month. Batteries should never be stored in a partly discharged state for a long period of time. A float charge should be maintained if they are not used.
10.4 State of Charge
State of charge, or conversely, the depth of discharge (DOD), can be determined by measuring the voltage and/or the specific gravity of the acid with a hydrometer. Voltage on a fully charged battery is 2.12-2.15 V/cell, or 12.7 V for a 12 volt battery. At 50% DOD the voltage is 2.03 V/cell, and at 0% DOD it is 1.75 V/cell or less. Specific gravity is 1.265 for a fully charged cell and 1.13 or less for a totally discharged cell. Many batteries are sealed, therefore, hydrometer reading cannot be taken.
10.5 False Capacity
A battery can meet all the tests for being at full charge, yet be lower than its original capacity because the plates are damaged, sulfated, or partially gone from long use.
In this case it acts like a battery of much smaller size.
10.6 Ampere-Hour Capacity
Deep cycle batteries are rated in ampere hours (Ah). An Ah is a 1A drain for 1h, 10 A for 0.1h, etc. It is calculated with the equation A × h. Drawing 20 A for 20 min would be 20 A × 0.333 h, or 6.67 Ah. The accepted Ah rating time period for batteries used in solar electric and backup power systems and for nearly all deep cycle batteries is the 20 hour rate. This is defined as the battery being discharged to 10.5 V over a 20 h period while the total actual Ah it supplies is measured.
Amp-hours are specified at a particular rate because of the Peukert effect. The Peukert value is directly related to the internal resistance of the battery. The higher the internal resistance, the higher the losses while charging and discharging, especially at higher currents. The faster a battery is discharged, the lower the Ah capacity. Conversely, if it is drained more slowly, the Ah capacity is higher.
10.7 Battery Charging
Batteries can be charged by constant current or constant voltage. When charged by the constant-current method, care must be taken to eliminate the possibility of over charging; therefore, the condition of the battery should be known before charging so that the charger can be removed when the ampere-hour rate of the battery is met.
Charging with the constant voltage method reduces the possibility of overcharging. With the constant voltage method, charge current is high initially and tapers off to a trickle charge when the battery is fully charged. Two requirements must be met when using the constant-voltage method:
• The charging voltage must be stable and set to 2.4 V per cell for a lead-acid battery and 2.30 V per cell for a gel cell battery. Gel cell open-circuit voltage is 2.12 V per cell.
• A current-limiting circuit must be employed to limit charge current when the battery is fully discharged.
A good battery charger charges in three steps. In the first stage, charge current is at the maximum safe rate the batteries will accept until the voltage rises to 80-90% of full charge level. Voltages at this stage typically range from 10.5-15 V. There is no correct voltage for bulk or charge charging, but there may be limits on the maximum current that the battery and/or wiring can accept.
In the second stage, accept, the voltage remains constant and current gradually tapers off as internal resistance increases during charging. Voltages are typically 14.2-15.5 V.
After batteries reach full charge, the third stage charging voltage is reduced to a lower level, 12.8-13.2 V, to reduce gassing and prolong battery life.
This is often referred to as a maintenance, float, or trickle charge, since its main purpose is to keep an already charged battery from discharging, FIG. 28.
An ideal charging state table is shown in Table 4.
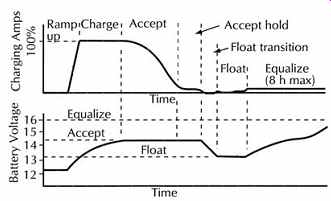
FIG. 28. Ideal charge curve.

Table 3. Ideal Charging State
PWM, or pulse width modulation is sometimes used as a float or trickle charge. In PWM chargers, the controller circuit senses small voltage drops in the battery and delivers short charging cycles (pulses) to the battery. This may occur several hundred times per minute and is called pulse width because the width of the pulses varies from a few microseconds to several seconds.
Most flooded batteries should be charged at no more than the C/8 rate for any sustained period. C/8 is the battery capacity at the 20 hour rate divided by 8. For a 220 Ah battery, this would equal 26 A. Gelled cells should be charged at no more than the C/20 rate, or 5% of their amp-hour capacity. AGM batteries can be charged at up the C × 4 rate, or 400% of the capacity for the bulk charge cycle.
Lead acid batteries require 15.5 V for 100% charge.
When the charging voltage reaches 2.583 V/cell, charging should be stopped or reduced to a trickle charge. Flooded batteries must bubble (gas) to insure a full charge, and to mix the electrolyte. Float voltage for flooded batteries should be 2.15-2.23 V/cell, or 12.9-13.4 V for a 12 volt battery. At higher temperatures, over 85°F, charge voltage should be reduced to 2.10 V/cell. Float and charging voltages for gelled batteries are usually about 0.2 V less than for flooded batteries.
10.7.1 Equalizing
The equalize cycle puts a controlled overcharge to remove lead sulfate from the plates that is not removed during the normal charging of the battery. Flooded battery life can be extended if an equalizing charge is applied every 10 to 40 days. This is a charge that is about 10% higher than the normal full charge voltage, and is applied for 2-16 h to be sure that all cells are equally charged and the gas bubbles mix the electrolyte.
If the liquid in the cells is not mixed, the electrolyte becomes stratified, creating a strong solution at the top and weak solution at the bottom of the cell. AGM and gelled batteries should be equalized a maximum of two to four times a year.
10.7.2 Charging Voltage versus Temperature
Battery charging is sensitive to temperature. As the ambient temperature decreases, the charging voltage must be increased, Table 4.
10.7.3 State of Charge
Table 5 shows no-load typical voltages versus state of charge for a 12 V battery. These voltages are for batteries that have been at rest for 3 hours or more. Note the large voltage drop in the last 10%.
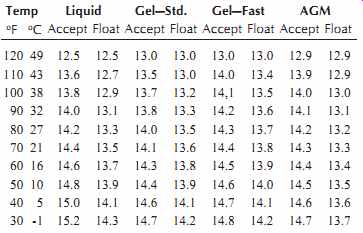
Table 4. Temperature Compensation for Various Types of Batteries
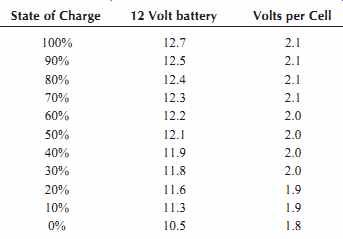
Table 5. No Load Voltage versus State of Charge for a 12 V Battery
10.7.4 Internal Resistance
All batteries have internal resistance that causes the battery voltage to fluctuate with the load. To calculate the internal resistance of a single cell or battery, the open circuit voltage V1 is measured using a voltmeter with an internal resistance of at least 1000 :/V. The battery or cell is then loaded with resistor R1, and the voltage V2 across the resistor is measured. R1 should be at least 10 times the battery resistance. The current through the resistor R1 is

(eqn 24)
The internal resistance, R1 , of the battery may now be calculated using

(eqn 25)
10.8 Lead-Acid Batteries
The lead-acid storage battery was invented by Gaston Planté in 1860 and is one of the most widely used forms of battery power. The principal drawback to this type of battery has been the liquid electrolyte and the fumes given off when charging and discharging. Today the sealed lead-acid battery may take its place with other rechargeable batteries such as the nickel- cadmium battery. Since small amounts of gas may be generated in any battery during the charge or discharge cycle, lead-acid batteries are vented so that the gas but not the electrolyte escapes.
Lead-acid cells are normally 2.1 V and are easily connected in series to produce 6 V and 12 V automotive types, 24 V aircraft types and 36 V types for golf carts, etc. Lead-acid batteries, because of their availability, high Ah ratings, and ability to be connected in series, work well powering sound systems in the field.
The type and amount of charge determine the condition of the cell. If a lead-acid battery is overcharged, excessive water consumption and hydrogen evolution result, while constant undercharging results in a battery with less and less capacity.
The recharge factor (RF) is defined as the charge Ah divided by the previous discharge Ah. The RF must always be greater than 1 to bring the battery back to capacity. The actual RF is between 1.04 and 1.20, with the sealed lead acid batteries requiring less than the standard vented type. FIG. 29A shows the state of charge (SOC) achieved versus the RF for a lead-acid battery. FIG. 29B shows the SOC versus the RF after a number of cycles. Note that the battery rapidly loses its capacity if it is not overcharged--i.e., more is put in than is taken out.
The use of a trickle charger with a storage battery shortens the life of the battery because of overcharging.
Trickle chargers should only be used when it is impractical to charge a battery by other means. A practical approach to the problem is to adjust the charging voltage to a value between 2.15 V and 2.17 V per cell.
A better, but more elaborate, method is to check the specific gravity of the cells over a period of several months and adjust the charging voltage to a value where the specific gravity is maintained at 1.250. Compensation must be made for temperature changes when reading the specific gravity. Four gravity points are added to the reading for every 10°F (5°C) the electrolyte is above a temperature of 80°F (27°C).
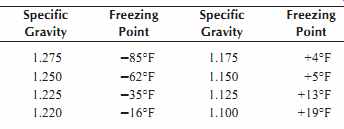
Table 6. Effect of Specific Gravity on Freezing Point of a Battery
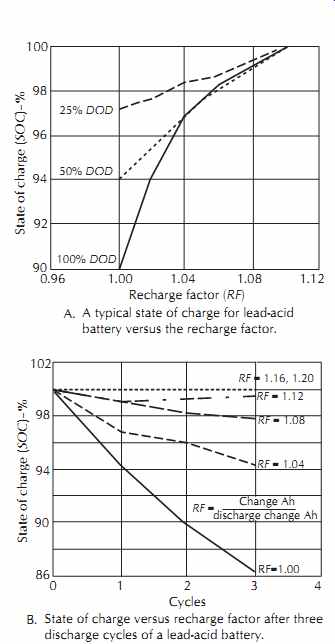
FIG. 29. Lead acid battery.
The freezing point of a battery electrolyte depends on the specific gravity of the electrolyte, Table 6.
Lead acid batteries freeze when in a discharged state, so it is imperative that they be kept fully charged when in subfreezing temperatures. If a storage battery is left in a discharged condition for any length of time, the plates may be damaged due to sulfation.
10.9 Lead-Dioxide Batteries
A lead-dioxide battery is a gelled electrolyte, maintenance-free type that exhibits high capacity and long life when properly applied and charged. To prevent electrolyte movement in the battery, the electrolyte in sealed batteries is immobilized by the use of a gelling agent that stores the electrolyte in highly porous separators.
With this construction, the loss of water is minimized.
The terminal voltage of each cell is approximately 2.12 V. The cell voltage is higher for a battery that has just been taken off charge, but in all instances it should adjust to about 2.12 V after a period of time.
Gel/Cells comes as a type A or type B. The type A Gel/Cell is conservatively designed for 4-6 years of continuous charging in standby power applications.
During this period over 100 normal discharge/charge cycles can be expected. Even more are obtained if only minor discharges are experienced. The end of life is actually determined by when the equipment will no longer perform its required function. Since the battery may still have 40-60% of its initial capacity, the service life may be much longer.
The type A Gel/Cell has near its full nominal capacity upon shipment from the factory. Type A cells are used for alarm systems, memory standby, etc. where they are normally in a standby mode.
The type B Gel/Cell is designed to provide 3-5 years of service in standby power applications or 300-500 normal discharge-charge cycles in portable power applications.
As the battery is discharged, the terminal voltage will slowly decrease. For instance, when the rated capacity of the battery is removed over a 20 h period, the terminal voltage would decrease to 1.75 V per cell.
These batteries are rated at a 20 h current rate and room temperature. This means a 2.6 Ah battery would put out 0.13 A for 20 h. This does not mean, however, that it will put out 2.6 A for 1 h (it would put out about 1.7 A for 1 h).
Lead-dioxide batteries can be charged by the constant-current or constant-voltage method. The constant-current method is used when charger cost is the primary consideration. The battery is forced to receive a constant amount of current regardless of its needs. While charger component economy is achieved, it is sometimes done at the expense of recharge time or service life if the current is not properly set. Trickle charging current ranges from 0.5-2.0 mA per rated Ah capacity of the battery.
When charging with the constant-voltage method, a voltage of 2.25-2.30 V per cell should be used. To maintain the battery at 100°F (38°C), a voltage of 2.2 V/cell is required, while at 30°F (0°C), 2.4 V/cell is required.
10.10 Absorbed Glass Mat Batteries
Absorbed glass mat batteries (AGM) are sealed batteries that can be operated in any position. AGM was developed to provide increased safety, efficiency, and durability. In AGM batteries the acid is absorbed into a very fine glass mat that is not free to slosh around. The plates are kept only moist with electrolyte, so gas recombination is more efficient (99%). The AGM material has an extremely low electrical resistance so the battery delivers high power and efficiency. AGM batteries offer exceptional life cycles.
The plates in an AGM battery may be flat like wet cell lead-acid batteries, or they may be wound in a tight spiral. Their construction also allows for the lead in their plates to be purer as they no longer need to support their own weight. AGM batteries have a pressure relief valve that activates when the battery is recharged at voltage greater than 2.30 V/cell. In cylindrical AGM batteries, the plates are thin and wound into spirals so they are sometimes referred to as spiral wound.
AGM batteries have several advantages over both gelled and flooded, at about the same cost as gelled:
• All the electrolyte (acid) is contained in the glass mats so they cannot spill or leak, even if broken.
Since there is no liquid to freeze and expand, they are practically immune from freezing damage.
• Most AGM batteries are recombinant--i.e., the oxygen and hydrogen recombine inside the battery.
Using the gas phase transfer of oxygen to the negative plates to recombine them back into water while charging prevents the loss of water through electrolysis. The recombining is typically 99+% efficient.
• AGM batteries have a self-discharge of 1-3% per month.
• AGM batteries do not have any liquid to spill, and even under severe overcharge conditions, hydrogen emission is far below the 4% max, specified for aircraft and enclosed spaces.
• The plates in AGM's are tightly packed and rigidly mounted so they withstand shock and vibration.
10.10.1 A Comparison of the Three Types of Deep Cycle Batteries
Safety. Batteries can be dangerous. They store a tremendous amount of energy, create explosive gas during charge and discharge, and contain dangerous chemicals.
Both gel and AGM batteries are sealed batteries that use recombinant gas technology. AGM is more efficient in the AGM process and completes its gas recombination near the plates. Gel recombinant gas batteries should incorporate automatic temperature-compensated voltage regulators to prevent explosions associated with their overcharging. Flooded batteries will spew acid, will definitely spill and leak if tipped over, and they generate dangerous and noxious explosive gases. AGM batteries are best at protecting both equipment and passengers.
Longevity. All batteries die. The number of cycles it takes to kill them is a function of the type and quality of the battery. When cycled between 25% and 50% depth of discharge (recommended deep cycle use), AGM batteries will normally outlast the other two types.
Durability. Some battery designs are simply more durable than others are. They are more forgiving in abusive conditions -i.e., they are less susceptible to vibration and shock damage, over-charging, and deeper discharge damage. Gel acid batteries are the most likely to suffer irreversible damage from overcharging. Flooded acid batteries are the most likely to suffer from internal shorting and vibration damage. AGM batteries are usually more durable and can withstand severe vibration, shocks, and fast charging.
Efficiency. Internal resistance of a battery denotes its overall charge/discharge efficiency and its ability to deliver high cranking currents without significant drops in voltage and is a measure of how well it has been designed and manufactured. Internal resistance in NiCad batteries is approximately 40%-i.e., you need to charge a NiCad battery 140% of its rated capacity to have it fully charged. The flooded wet battery's internal resistance can be as high as 26%, which is the charging current lost to gassing, or breaking up of water. Gel acid batteries are better at approximately 16% internal resistance and require roughly 116% of rated capacity to be fully charged. AGM batteries have an internal resistance of 2%, allowing them to be charged faster and deliver higher power.
10.11 LeClanche (Zinc-Carbon) Batteries
LeClanche batteries consist of a carbon anode, zinc cathode, and electrolyte solution of ammonium chloride, zinc chloride, and mercury chloride in water (called a mix). The nominal voltage is 1.5 V. This type of cell is quite inefficient at heavy loads, and its capacity depends considerably on the duty cycle. Less power is available when it is used without a rest period. Maxi mum power is produced when it is given frequent rest periods, since the voltage drops continuously under load. Shelf life is limited by the drying out of the electrolyte. A typical discharge curve is given in FIG. 30.
Zinc-carbon cells may be recharged for a limited number of cycles. The following information is extracted from the National Bureau of Standards Circular 965:
The cell voltage for recharge must not be less than 1 V and should be recharged within a short time after removing from service. The ampere hours of charge should be within 120-180% of the discharge rate. The charging rate is to be low enough to distribute the recharge over 12-16 h.
Cells must be put into service soon after recharging as the shelf life is poor.
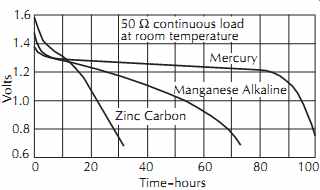
FIG. 30. Typical discharge curves for three different types of penlight
cells discharged continuously into a 50 ohm load.
10.12 Nickel-Cadmium Batteries
For optimum performance, many battery-operated items require a relative constant voltage supply. In most applications, nickel-cadmium cells hold an almost constant voltage throughout most of the discharge period, and the voltage level varies only slightly with different discharge rates. Nominal discharge voltage is 1.25 V at room temperature.
Nickel-cadmium cells are especially suited to high discharge or pulse currents because of their low internal resistance and maintenance of discharge voltage. They are also capable of recharge at high rates under controlled conditions. Many cells can be rapidly charged in 3-5 h without special controls, and all can be recharged at a 14 h rate.
Nickel-cadmium cells are designed to operate with a wide temperature range and can be discharged from - 40°F to +140°F (-40°C to +60°C).
These cells can be continuously overcharged at recommended rates and temperature. This will not noticeably affect life unless the charge rate exceeds design limitations of the cell.
The cell construction eliminates the need to add water or electrolyte, and, under certain conditions, the cell will operate on overcharge for an indefinite period.
A typical discharge curve for a cell, rated at 25 Ah and weighing approximately 2 lb, is given in FIG. 31.
The charge retention varies from 75% for 1 month to as low as 15% for 5 months. Storage at high temperatures will reduce high retention. Cells should be charged prior to use to restore full capacity. Nickel cadmium eventually fails due to permanent or reversible cell failure. A reversible failure is usually due to shallow charge and discharge cycles and the battery appears to have lost capacity. This is often called the memory effect. This problem can be removed by deep discharge and a full recharge. A loss of capacity can also come from extended overcharging. If this should occur, full capacity can be restored by a discharge followed by a full recharge.
The capacity of a nickel-cadmium cell is the total amount of electrical energy that can be obtained from a fully charged cell. The capacity of a cell is expressed in ampere-hours (Ah) or milliampere-hours (mAh), which are a current-time product. The capacity value is dependent on the discharge current, the temperature of the cell during discharge, the final cutoff voltage, and the cell's general history.
The nominal capacity of the nickel-cadmium cell is that which will be obtained from a fully charged cell discharged at 68°F (20°C) for 5 h to a 1.0 V cut off.
This is called the C/5 rate.
Discharges at the 20, 15, 10, and 1 h rates are called C/20, C/15, C/10, and C, respectively. Higher rates are designated as 2C, 3C, etc.
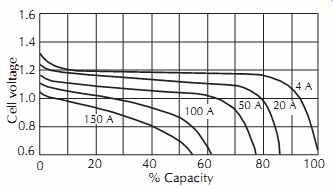
FIG. 31. Discharge characteristic for Sonotone type 20L420 nickel-cadmium
battery, rated 25 Ah.
When three or more cells are series connected for higher voltages, the possibility exists that during discharge, one of the cells, which may be slightly lower in capacity than the others, will be driven to a zero potential and then into reverse. At discharge rates (C) in the vicinity of C/10, cells can be driven into reverse without permanently damaging the cell. Prolonged, frequent, or deep reversals should be avoided since they shorten cell life or cause it to vent. Cell voltage should never be allowed to go below -0.2 V.
Nickel-cadmium batteries may be charged using either a constant-current or constant-voltage charger.
There are four major factors that determine the charge rates, which can be used on nickel-cadmium batteries.
They are charge acceptance, voltage, cell pressure, and cell temperature.
No charge control is required for charge rates up to C/3. This allows the use of the least expensive charger design. When charging rates equal or exceed 1.0 C, the charging current must be regulated to prevent over charge.
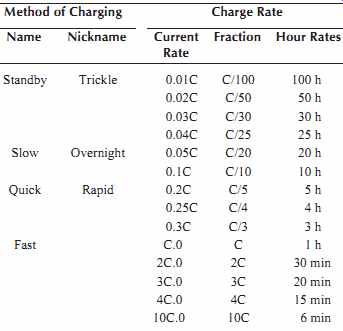
Table 7. Charging Rates for a Nickel-Cadmium Battery
In Table 3, the notation that includes the letter C is used to describe current rates in terms of a fraction of the capacity rating of the battery. A comparison of cells from different manufacturers requires rationalization to a common standard for capacity rating at the same discharge rate.
In general, discharge times will be shorter than those for C rates greater than 1 and longer than those for C rates less than 1. The charge input must always be more than discharged output. For example, to ensure full recharge of a completely discharged battery, the constant-current charge time at the 10 h rate must be longer than 10 hours due to charge acceptance characteristics.
10.13 Alkaline-Manganese Batteries
The alkaline-manganese battery is gaining consider able importance in the electronic field since it is a primary battery and is rechargeable.
The polarity of this cell is reversed from the conventional zinc-carbon cell, in which the can is negative. However, because of packaging, the outward appearance is similar to the zinc-carbon cell, with the same terminal arrangement. Although this cell has an open circuit voltage of approximately 1.5 V, it discharges at a lower voltage than the zinc-carbon cell. Also, the discharge voltage decreases steadily but more slowly.
Alkaline-manganese batteries have 50-100% more capacity than their zinc counterparts. Zinc-carbon cells yield most of their energy above 1.25 V and are virtually exhausted at 1 V, while the alkaline cell yields most of its energy below 1.25 V with a considerable portion released at less than 1 V.
If the discharge rate is limited to 40% of the nominal capacity of the cell and recharge is carried out over a period of 10-20 h, alkaline-manganese cells can be cycled 50-150 times. A typical discharge curve is shown in FIG. 32.
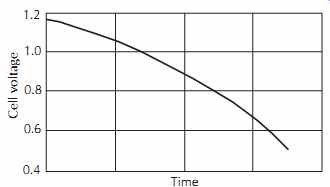
FIG. 32. Discharge characteristics of an alkaline-manganese cell, on
an arbitrary time scale.
10.14 Mercury Dry Cells
The mercury dry cell using a zinc-mercury oxide alkaline system was invented by Samuel Ruben during World War II. There are two kinds of mercury cells: one with a voltage of 1.35 V and one with 1.4 V.
The 1.35 V cell has a pure mercuric-oxide cathode.
On discharge its voltage drops only slightly until close to the end of the cell life when it then drops rapidly. The 1.4 V cell has a cathode of mercuric oxide and manganese dioxide. On discharge, its voltage is not quite as well regulated as the 1.35 V cell, but it is considerably better than the manganese-alkaline or zinc-carbon cell.
Mercury cells have excellent storage stability. A typical cell will indicate a voltage of 1.3569 V, with a cell-to-cell variation of only 150 µV. Variation due to temperature is 42 µV/°F, ranging from -70°F to +70°F (-56°C to +21°C), with a slight increase of voltage with temperature. The internal resistance is approximately 0.75 Ohm. Voltage loss during storage is about 360 µV per month; therefore, a single cell can be used as a reference voltage of 1.3544 V, ±0.17%. The voltage is defined under a load condition of 5% of the maximum current capacity of the cell. Normal shelf life is on the order of 3 years.
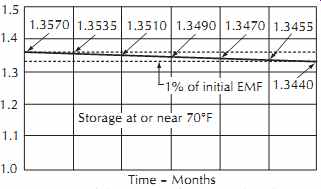
FIG. 33. Stability curve for a single-cell mercury battery.
Recharging of mercury cells is not recommended because of the danger of explosion. A typical stability curve for a single cell over a period of 36 months is shown in FIG. 33. The drop in voltage over this period is 13 mV.
References
1. Kurt Mathews, Single IC, Power Factor Corrected, Off-Line Supply, Design Note 143, Linear Technologies Design Notes, Linear Technology Corporation.
2. Synchronous Rectification Aids Low-Voltage Power Supplies, Maxim Acation Note 652, Jan 31, 2001, Maxim Integrated Products