By M. CHARNLEY
A novel and simple method of generating periodic waveforms.
Although designed specifically to support a research project involved in the investigation of multiplexing strategies suitable for the simultaneous transmission of speech and data over land-mobile radio links, the principle used in this design can be extended to cater for many different types of application. An attractive feature of the method used to reproduce various baseband test signals is the fact that, as well as generating sinusoidal test tones at standard audio frequencies, many other user-defined complex signals which extend over a defined bandwidth can be produced and switch-selected when required. In contrast, using standard pieces of test equipment would demand a far greater level of complexity to achieve the same result.
In general, assessment of the dynamic performance of electronic systems, such as amplifiers and filters, usually demands that a suitable test signal be injected at the input and the resulting output waveform examined. In this way, frequency response and distortion can be quantified. Consequently, many pieces of test equipment are available to enable a wide range of performance measurements to be carried out. Although the system to be described does not offer a new performance-assessment strategy, it does provide the engineer with the possibility of developing and using unique waveforms for specific measurement tasks. These customized waveforms can be produced without the need to modify the electronic system used in their generation.
Figure 1 is the block diagram of the configuration which has successfully been used to generate and store a library of periodic baseband signals. Each waveform is stored as a pulse-code-modulated data frame, which consists of 64, 8-bit quantized samples extending over a 5ms sequence.
Consequently, each waveform can contain, in theory at least, frequency components extending up to 6.4kHz, as defined by the Nyquist sampling theorem. Increasing the number of samples and/or modifying the data frame length can, of course, enable periodic signals covering a much wider bandwidth to be obtained. However, as previously indicated, the system was designed to provide test signals for a radio telephony speech band up to 3kHz. The stored waveform data samples are output in a cyclic manner, repeating every 5ms as determined by the 12.8kHz clock frequency, as 8-bit codewords to a d-to-a converter.
In response to the frame sequence of 8-bit data codewords, the converter reproduces a quantized approximation to the stored baseband waveform which has been selected. As Fig.2 shows, the low-order addresses needed to access the 64 data samples per frame are produced by a six-stage binary counter, which in turn is driven by the clock generator. In contrast, the high-order address, which defines the baseband waveform to be generated, is determined by a hex code thumbwheel switch arrangement. The low cost and availability of the 2716 EPROM makes it an obvious choice for this application: a 64-byte data frame for each individual waveform means that a total of 32 distinct test signals can be catered for, if required, by the standard configuration.
The remaining circuitry following the d-to-a converter consists of a low-pass filter to smooth out the quantized signal from the converter and reproduce the desired band-limited periodic test signal. A means of adjusting the output level has also been included.
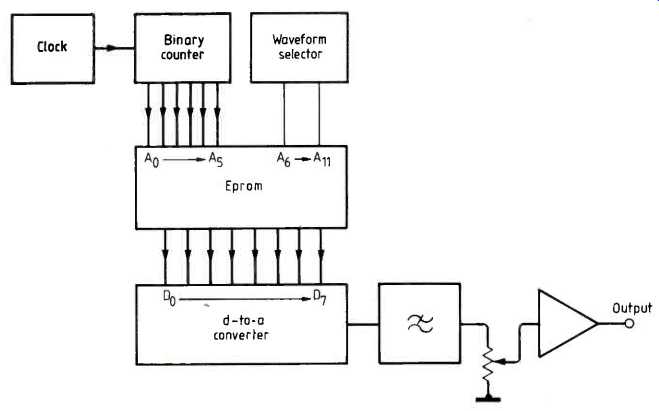
Fig. 1. Schematic block diagram of the baseband waveform generator.
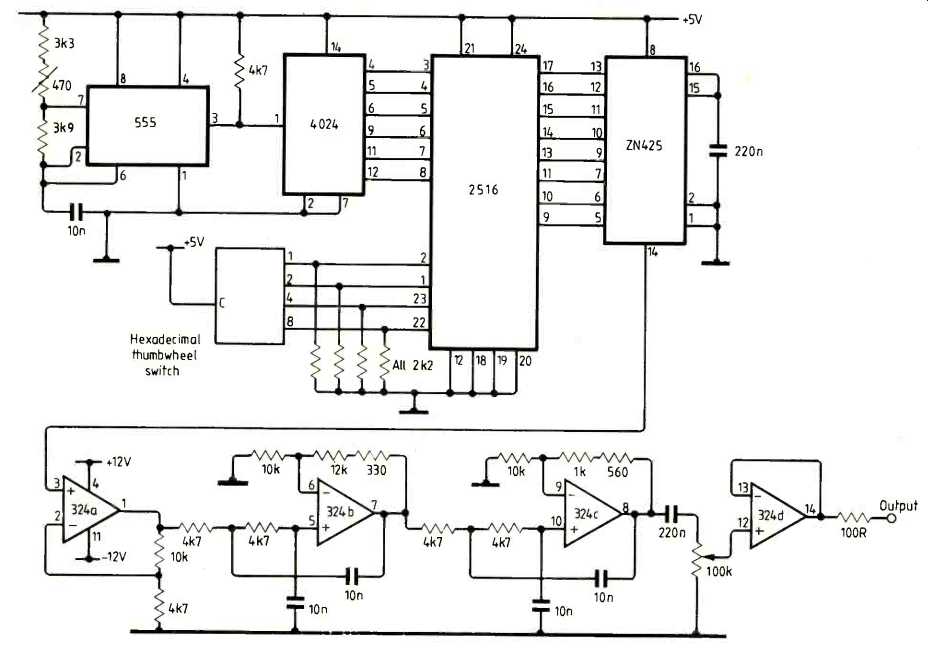
Fig. 2. Circuit diagram of the baseband test signal generator.
A SELECTION OF BASEBAND SIGNALS
As previously indicated, as well as generating standard audio test signals such as 400Hz and 1kHz tones, the stored-waveform technique encourages the design of other different complex test signals. Before reviewing certain signals which have been adopted for investigating the effect of baseband signal processing, it is useful to indicate the quality of sinusoidal test signals that can be obtained using this method. Practical measurements have confirmed that the second-harmonic distortion using this configuration is better than 0.5% and the third harmonic generated is less than 0.3%. These values compared very favorably with laboratory signal generators which employ oscillators. Also, high frequency stability is assured, provided that a crystal oscillator is used as the clock generator.
Figure 3 shows a small selection of test signals that have been successfully generated using this technique, indicating both their time-domain and frequency-domain representations. The waveform of Fig.3(b) consists of the sum of two audio tones, 800Hz and 1200Hz, and is used as a test signal for assessing the non-linearity of baseband speech-signal processing systems.
Any non-linearity in such systems leads to the generation of spurious frequency components in the output signal which take the form of harmonics and intermodulation products related to the input signal tones.
This technique of assessing non-linearity is known as 'two-tone' testing and is well established in the testing of r.t. circuits.
The next waveform in the sequence, Fig.3(c), is a more complex audio test signal consisting of four distinct frequency components which are odd and prime number multiples of a 200Hz fundamental which is itself excluded.
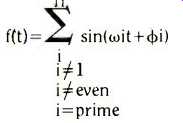
...where i can take the values 3,5,7 and 11.
The amplitudes of the sinusoidal components are all equal; however, their phase values 41) are chosen to ensure a composite waveform with a controlled peak-to-RMS value. The ratio of peak to RMS, defined here as the dynamic range of the test signal, should be as small as possible, since a smaller dynamic range will minimize the effect of quantization noise introduced by the d-to-a process. The problem of how to adjust the phase angles of a periodic signal with a given power spectrum to minimize the 'peak-to-trough' ratio of the resultant signal envelope is dealt with in detail in Ref.2.
This particular test signal, covering a range of frequencies from 600Hz to 2200Hz, has proved very useful in assessing the performance of a quadrature-based, narrow-band, angle-modulated system' which is under investigation as a possible multiplexer for speech and f.f.s.k.-modulated data in mobile radio.
A test signal composed of prime sinusoids is well suited to the rapid measurement of frequency response when used in conjunction with a microcomputer-based measuring system using a discrete Fourier transform to derive a spectral information from the output of a test system. Any nonlinearities in a system being tested in this way will not corrupt the frequency response estimates at the specific test frequencies.
This is because the input signal consists of a sum of sinusoidal components which, as already described, are odd and prime number multiples of a reference fundamental frequency. Consequently, any spurious distortion products generated will fall at frequencies other than those contained in the test signal.
The final test signal shown in Fig.3(d) has been designed to have a specific amplitude spectrum; a sinc(x) distribution from zero to 1.6kHz, with a peak value occurring at 800Hz. As indicated by the spectrum analyzer display of Fig.3(d), the signal consists of a fundamental at 200Hz and harmonics up to and including the seventh. Spectral zeros of the distribution are chosen to occur at d.c. and the eighth harmonic.
The amplitudes of each harmonic component are weighted according to the expression
a_n =K/[sin(x)/x]
where:
K=An amplitude scaling component
x=n(τ/T-1) for n=r1;2;3;4;5;6;7
T=waveform period (in this case 5ms)
τ=T/4
Phases of the individual components have been selected to yield a dynamic range of less than 10dB. This waveform was designed to investigate the likely levels of distortion and crosstalk that would be produced by synchronous detection of an orthogonal multiplexing strategy based on narrow-band angle modulation after successive stages of frequency multiplication. The amplitude spectrum of the baseband signal, recovered after multiplication by a coherent local carrier, is compared to the original amplitude spectrum to assess the amount of spectral distortion introduced.
OBTAINING THE TEST-SIGNAL DATA
The success of the stored-waveform concept for generating complex test signals depends to large extent on the PCM data frame that is stored in the EPROM as the waveform signature to be reproduced by the d-to-a converter. Clearly, this depends on the ability to obtain accurate sample values at equally spaced intervals over the desired time period for each waveform. Once these instantaneous values have been obtained, it is a relatively simple matter to optimize the steps in sample values over the amplitude range of the frame period and convert them to 8-bit codewords. Since the waveforms are periodic, they will all contain discrete frequency components and can therefore be accurately defined by a Fourier series.
Such a representation can easily be evaluated to express the instantaneous amplitude of the composite signal at all sampling instants over the period using a microcomputer running a high-level language such as Basic.
Even if a micro is not available, the instantaneous values can be calculated to significant degree of accuracy, on a point-to-point basis, with a calculator possessing the basic sin/cos trig. functions. Inevitably, this second option will demand a great deal of time to complete if the calculator is not the programmable type. The method used by the author to derive the PCM data-frame waveform signatures is based on a c.a.e. package known as Astec 35'6 --a general-purpose analogue circuit and system package capable of performing d.c., a.c., and transient analysis.
The reference to Astec 3 is included here for the sake of completeness. There is absolutely no need to resort to such levels of sophistication as c.a.e. software packages to obtain the data-frame signatures.
When one considers the very small hardware costs involved, and the inherent programmability, this unit is worthy of serious considerations for any lab, or test environment.
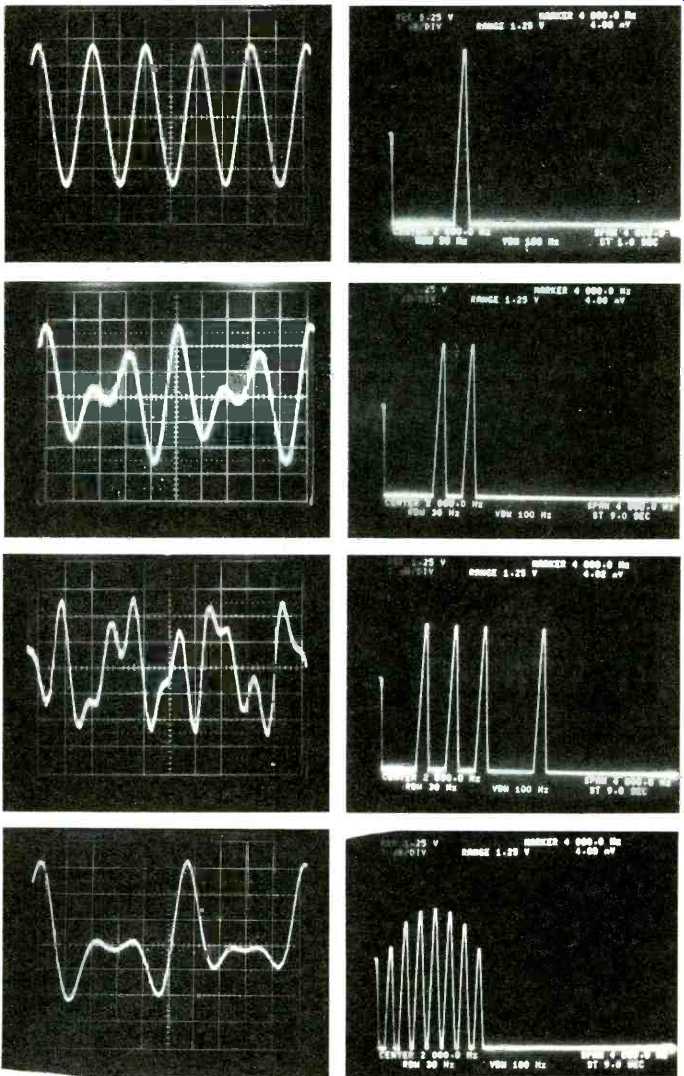
Fig. 3. A selection of test signals successfully generated by the stored waveform
method: 1kHz sinusoidal test tone(a); a two tone test signal(b); a prime sinusoid
complex test signal(c) and a complex audio test signal with sinc(x) discrete
amplitude spectrum at (d). y scale 0.5V/div., x scale 0.5 ms/div.
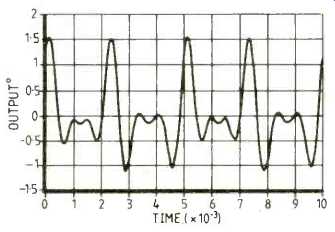
Fig. 4. A 10ms transient simulation of the sinc(x) distribution, using Astec
3.
References
1. Al-Nuaimi, M.O., and Charnley, M.: 'An integrated voice and data transmission system for private land mobile radio'. International Conference on Cellular and Mobile Communications, Wembley, November, 1985.
2. Schroeder, M.R: 'Synthesis of low-peak-factor signals and binary sequences with low auto-correlation' IEEE Transactions on Information Theory, January, 1970.
3. Rees, D.: 'Automatic testing of dynamic systems using multi frequency signals and the discrete Fourier transform'. IEE International Conference on New Developments in Automatics Testing. December, 1977.
4. Charnley, M., and Al-Nuaimi, M.O.: 'A functional modeling approach to the design and evaluation of radio systems' IERE International Conference on Land Mobile Radio Systems. December, 1985.
5. Witting, P.A.: 'Electronic circuit and system simulation with Astec 3 IEE Computer-Aided Engineering Journal. December, 1985.
6. Charnley, M.: 'A model design approach for electronic c.a.e. IEE Computer-Aided Engineering Journal. December, 1985.
------------
==========
(adapted from: Wireless World , Dec. 1986)