By N.A. YOUNG
Research into noise-resistant mains signaling reveals new methods of producing signals with tightly controlled bandwidths which reduce interference between data transmissions.
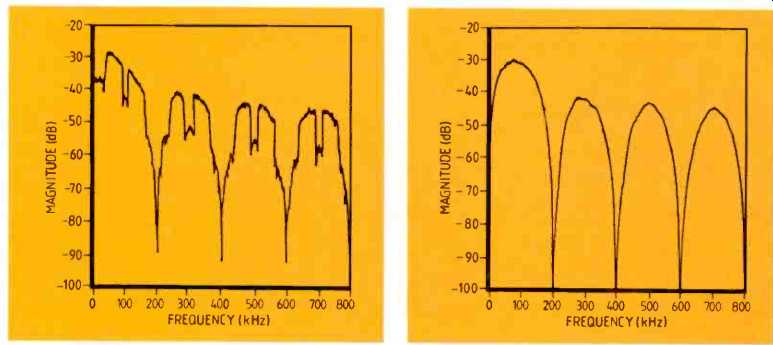
Fig. 1. Spectrum of an up-converted m sequence (left) and Fig.
2. K-sequence
spectrum.
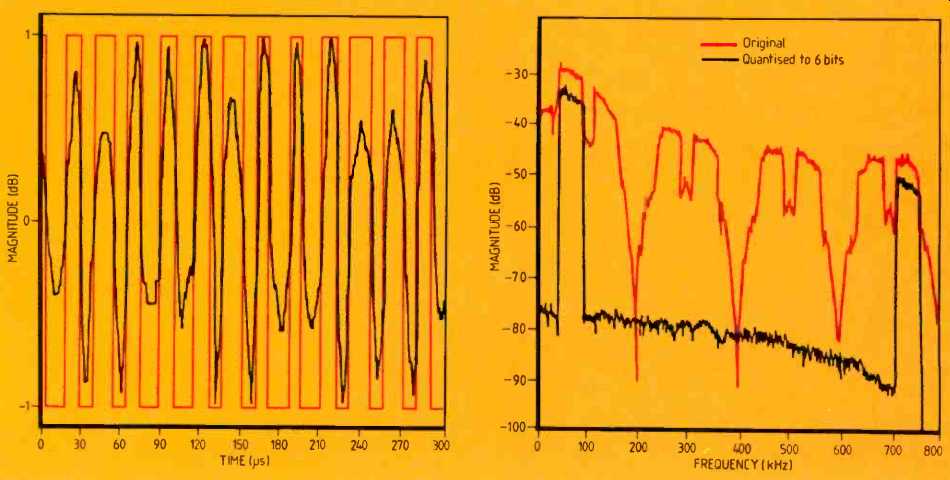
Fig. 3. K-sequence in time domain, left, and Fig. 4, the K-sequence
spectrum. These show the effects of quantization.
At the MATES 1982 conference two papers [1,2] were presented describing a system for low-voltage mains signaling. This article describes further research done on that mains-borne system, the expertise gained in signal processing and the improvements to the system that resulted, both in communications performance and in spectral control.
Although the techniques developed are primarily applicable to mains signaling and similar noisy environments they have wider uses, and interest has been shown from people in many different areas processing. The two areas of research de scribed in this article are reduction of the spread-spectrum bandwidth and improvements in communication performance.
Over the four or more years since the system was first proposed, extensive re search has been done at THORN EMI, supported by field trials, into various aspects over the electricity mains. A 19-month 1000-house trial has recently finished, using the spread-spectrum signaling technique referred to at the 1982 conference. During that time further investigation was carried out into some of the fundamental theory of communicating in a noisy environment, in particular under the limitation of restricted bandwidth. Much of the work was done first on a computer, using a simulator and other programs, and then validated in the field.
Early in the 1000-house trial the BISMA* control-manufacturers body recommended that the spread-spectrum bandwidth for ESI use should he restricted to 40-90khz instead of the current 50-150kHz, with negligible signal outside these limits. This paper de scribes research done into meeting that specification, and the new sequences and signal-processing techniques that resulted.
A further, separate improvement in performance was also achieved using the same basic tools--the computer simulation and other programs--and it is also described briefly here. The spectral content of the transmitted signals is shown to he very sharply defined, and the communications performance of the system is shown to he improved also in spite of the reduction in bandwidth.
PRESENT COMMUNICATION SYSTEM
Understanding of the techniques and results described below requires some knowledge of the current communication methods. A very brief outline is therefore given here, the system described being that actually used in the 1000-house trial.
Spread-spectrum transmission is used for two reasons: firstly because it results in a low spectral power density, thus reducing interference: and secondly because mains characteristics change significantly with time due to electrical interference and notches in the frequency response caused by loading. Spreading the spectrum reduces the probability that the chosen frequency of operation can suddenly become completely unusable for a significant length of time.
The current mains-borne system uses the direct-sequence baseband method of spreading the spectrum. Binary sequences used are derived from m-sequences. up converted so that the nominal 3dB bandwidth is S0 150kHz, see Fig.1.
Two 1024-chips sequences are used, one for data zero and the other for data one. and the appropriate one is transmitted in response to the controlling data line. They are stored in read-only memory and are clocked out at about 200khz to give a data rate of 200Hz. The ROM output is filtered to reduce out-of-hand noise (which changes the rectangular shape of the sequence to a considerable extent) and fed into a power amplifier, then onto the mains through a capacitor and transformer.
[[BISMA is the MAMA interactive and mains systems association, formerly called RMSA. A chip is a component of the 1021 binary-digit sequence which makes up a data bit. It is actually a bit but since it is a bit that makes up a bit. the term chip is used to avoid confusion. ]]
==========
New sequence improves data communications
The K sequence, developed as part of the noise-resistant mains signaling project, reduces interference between adjacent transmissions by reducing out-of-band noise.
There are a number of possible variations on the basic K sequence which is named after Ian Kimber, the THORN EMI scientist who invented it. Notches or other differences can be introduced in the pass band for special purposes; indeed the spectrum can be tailored to practically any extent, depending on the system requirements.
Usually a fairly straightforward shape is needed, with a flat pass band and negligible noise outside, cutting off sharply at tie edges. Generation of this basic sequence is described below, using as an example the mains-borne system with 1024-chip sequence, a clock rate of 200kHz and a bandwidth of 43-90kHz.
A fairly even flat-topped spectrum in the pass band is desired since otherwise the advantages of the spread-spectrum technique are reduced as single-frequency or f.s.k. transmission is approached. Thus the sequence has to contain frequencies from all the way across the band, each with an individual bandwidth large enough to ensure that there are no significant gaps in the spectrum. On the other hand the bandwidths must not be too great as the cut off obtained becomes less sharp as they increase.
Thus the best compromise is to set the individual bandwidths to a value that is about the same as the distance from one of the component frequencies to the next. Choosing the nearest power of two for the number of frequencies since gives an exact number of chips for each one.
Assume that there are N frequencies in a 1024ch.p sequence. Each sequence period is 5ms so each frequency lasts for 5/N ms. This makes bandwidth roughly N/5kHz, which is actually the distance to the first null since the spectrum of a single frequency transmitted once is a sinc function. Distance between frequencies is (90-40)/N kHz so the two can be equated to give 50/N= N/5 or N2=250. This resifts in N=16 so there must be 16 component frequencies in the sequence, each 64-chips long.
Generation of the sequence ,s quite simple. The frequencies are selected in an arbitrary order--16 frequencies gives over 2x10" possible sequences, though they will not all have good cross-correlation functions with each other. For each frequency a sinewave is calculated and sampled at the clock frequency to give a set of 64 chips of 5/16ms total duration.
At the boundary between frequencies the phase is kept constant to reduce discontinuities as far as possible. On each sample the sinewave is quantized to one bit, i.e., set to either one or zero depending on whether the waveform is positive or negative.
This gives the K sequence. It’s fairly easy to show that its spectrum G(f) is given by
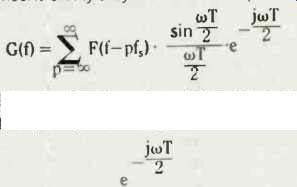
which is the characteristic sinc function where F(f) is the basic flat-topped spectrum desired, f5 is the sampling frequency and T=1/fs. Factor
is a phase factor whose modulus is always 1.
This spectrum is shown in Fig.2, though since it is plotted as a power spectrum the envelope is actually sinc2(x). Note both the reflections of the main lobe about the sampling frequency and the quantization noise between the lopes. Both of these need to be removed by the next stage of processing.
DIGITAL FILTERING
Sequences and waveforms generated are held in the computer to a precision of eight samples per chip in time and to the limit of its resolution (32 bits) in amplitude, so that there is plenty of scope for processing. Also, all necessary operations can be performed in the frequency domain, which makes processing the spectrum very much easier. Thus the digital filtering, like the sequence generation, is done off line on the computer, and the problems of causality do not arise.
The easiest way of achieving the sharp cut off required is simply to set the spectrum to zero outside the required band and transform back to the time domain. This however produces an analog waveform that cannot be transmitted in the same way as before, and so quantization is necessary if d is to be stored in memory.
Choice of the number of bits N is dictated by the trade off between the amount of cut off required and the available bits of memory. The numbers resulting from the quantization are normalized to 2N-1 so that they can be stored in memory. It can be shown that the signal-to-quantization-noise ratio achieved by this method is 6dB/bit (over the whole band, i.e., up to half the sampling frequency).
To move the side lobes far enough away so that the analog front-end filters can remove them it is only necessary to sample at a high enough frequency. Since all the processing is done at eight samples per chip, the sampling frequency of the transmitted waveform can be up to 1600kHz. This does not mean altering the chip rate or the data rate, but simply transmitting to a greater precision in time
============
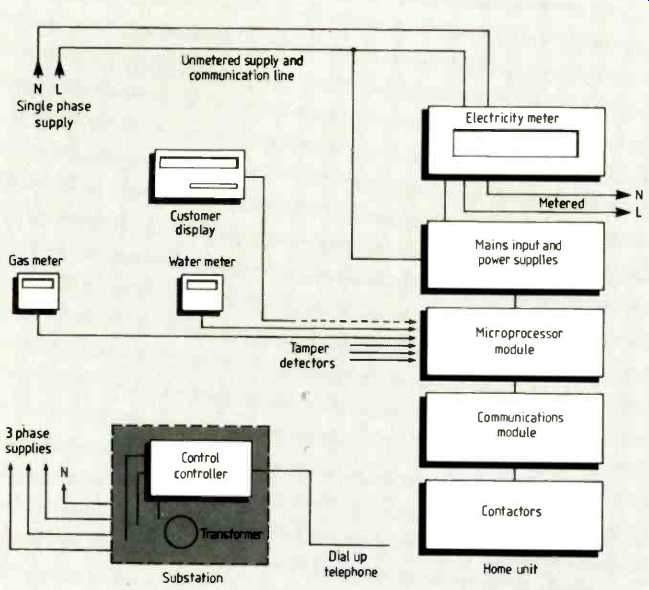
--------- Household units will give customers much more useful information
about energy and water consumption than simple meters.
Reception and decoding of the data is quite complex, using a fast hardware correlator followed by substantial software processing. Before the correlator, the incoming signal is filtered to reduce out-of-hand noise and then hard clipped since the correlator works in binary data. It is then correlated in eight positions at once with both reference sequences (data one and data zero) and the results are analyzed and compared to determine which data hit has been transmitted.
The magnitudes of the correlations are also used to determine whether genuine data or pure noise is being received. On receiving noise, the receiver goes into search mode, that is, it searches for the best position on the correlation function to lock onto and analyze.
For the correlation process to be effective the auto-correlation function of each sequence must have no significant peaks ('noise') anywhere away from the central one that the system could lock onto since this would degrade performance. Also the cross-correlation function with noise and with the other sequence must have no significant peaks at all to avoid data errors.
M sequences are known to have the best available auto and cross-correlation functions with each other and with random noise, and the derivative that is presently used is almost as good. The complete auto correlation function of this derivative is almost completely 'clean'--the reason for the small amount of 'noise' that exists is that an extra chip has been added to the m sequence to make its length a power of two.
In designing a new sequence for the system care must be taken to ensure that the correlation characteristics are equally satisfactory.
REDUCTION OF SPREAD-SPECTRUM BANDWIDTH
When mains-borne communication was first proposed the only bandwidth consideration was that of efficiency. Compliance with existing legislation was not seen as a problem. However, early on in the trial, BISMA produced an interim document (BMSAI) proposing division of the spectrum into bands, of which the relevant one for this purpose is 40-90kHz. There is a limit on the power that may be transmitted outside this band, and the restrictions imposed are very stringent.
In the current system there is far too much signal outside these limits to satisfy the proposed regulations, and so some modification would be required if the system were to go ahead and comply with the standard.
The analog filters presently on the transmitter output are insufficient for this purpose, though it would be possible to use much higher-order filters to produce the desired effect. However, such filters would be expensive and elaborate, would require much physical space and would introduce unacceptable phase shift into the pass band.
Thus any effective methods needs to be basically digital, leaving at most a very small amount of interference for the analog filters to cope with.
To achieve the aim of drastically reducing unwanted noise two procedures were used:
firstly the generation of a suitable digital sequence with roughly the right frequency characteristics, and secondly digital filtering of the sequence to achieve the sharp cut off required. As a result of this processing a somewhat more complex transmission method is required since digital filtering turns the binary sequence into an analog waveform. However, the reception and correlation process is still the same. which means that the only change is that the system has to store and transmit this waveform instead of the original sequence.
THE K SEQUENCE
The 'suitable sequence' mentioned above is one which fulfils two criteria: it must possess a satisfactory auto-correlation function with no spurious peaks, and it must be substantially unaffected by the digital filtering as far as correlation is concerned. Additionally the digital filtering process must not produce too uneven a waveform as this would reduce signal-to-noise ratio on reception.
A sequence fulfilling these qualifications is the so-called K sequence, the generation of which is described fully in the panel and whose spectrum is shown in Fig.2. Note that well over half of the energy is in the main 40-90kHz lobe, which means that subsequent digital filtering has only a small effect on the time-domain distribution of the sequence.
This represents the limit of the spectrum tailoring available using binary sequences and a 200kHz clock, so the sharp frequency cut off desired required a different approach hence the digital filtering.
The important and unusual feature of the K sequence is that its spectrum can be very tightly controlled. Because of the sharp edges of the spectrum a very large 'brick wall' cut off can be applied by a filter without altering the basic shape of the sequence.
Since the filter is digital no phase shift is introduced in the pass band, so the resulting analog waveform follows the outline of the original sequence; in particular the zero crossings are still the same, which is important for correlation purposes.
Additionally, if the waveform is normalized after filtering so that the highest peak is at the original magnitude of the binary sequence, less than half the energy is removed from the sequence which is an important consideration for transmission. Since it is then practically unaffected by the output filters, the transmitted power is comparable with that of the binary sequence used in the trial, which is severely altered by these filters.
DIGITAL FILTERING
Digital filtering, done off line, introduces the sharp cut off required into the spectrum. It consists of two parts; firstly a 'brick-wall' filter in the frequency domain, and secondly, back in the time domain, a requantization to as many levels of output as desired and a resampling at a higher clock frequency. The second stage is required to enable the analog result to be digitally stored and trans mitted. These two processes are explained in detail in the panel and the results are described below.
An essentially analog waveform (actually multi-level quantized) is produced which follows the original binary sequence shape but has rounded edges. Its spectrum consists of the main lobe of the original sequence, sharply defined to an extent that depends on the number of quantization bits (roughly 6dB cut-off per bit).
There is a side lobe further up. which is a reflection of the main lobe about the new clock frequency. This is inevitable in a digital system but can be moved far enough away so that the ordinary analog output filters can remove it on transmission.
Figures 3 and 4 show the original K sequence and a six-bit quantized version in the time and frequency domains respectively. Note the side lobe at just below 800kHz (the new sampling frequency), and the fact that the spectrum is clean between the two lobes. Theoretically, there is no limit to the cut off that can be achieved by this method--the limitations are likely to be the output amplifiers and other analog devices.
This multi-level waveform's auto-correlation function is also essentially that of the original sequence, the only difference being that it changes shape gradually as the sequences drift past each other (as they do in a real system because of unsynchronized clocks). This produces no problems, and indeed is used in one method of analyzing the incoming data described below.
The auto-correlation function is slightly different from that of an m sequence or its derivative. but just as good for locking on to. In many respects it is better because at one stage of the clock drift cycle the auto-correlation function of the filtered m sequence becomes very small.
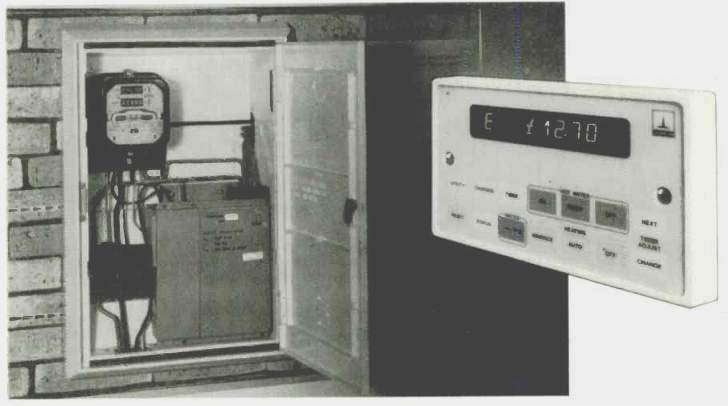
------------ Customer display and home unit similar to those used in the
1000-hpuse trials. Sub stations have a central controller.
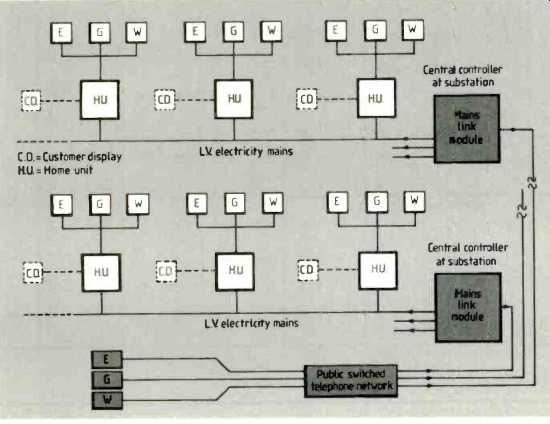
-------- Mains signaling network for domestic gas. water and electricity
supply information.
TRANSMISSION OF THE FILTERED K SEQUENCE
The original 1024-chip binary sequence was held in rom and clocked out at approximately 200kHz, producing the spectrum shown in Fig. 1 with 50-100kHz 3dB bandwidth.
Only three bits of each byte were used, one for each sequence (data one and data zero) and one for an end-of-sequence marker which is required by the hardware.
To be reasonably simple and compatible with the existing system the same basic method is used, but some alterations are required. Considerably more memory is needed and using byte-wide read-only memory limits quantization to six bits, though more could easily be used by placing two roms in parallel.
The two signals are held in two separate areas of memory, and the most-significant address line is switched as required. Six bits are used for the transmitted signal, one is the most-significant bit of the other wave form, which is used for correlation, and the eighth bit functions as the end-of-sequence marker. If desired this marker could be produced using hardware.
Rom clocking is at four times the previous rate, i.e. approximately 800kHz. This speed is necessary to achieve the desired spectrum, and does not alter the effective chip rate of 200kHz--there are simply four cycles per chip instead of one.
Six bits representing the signal to be transmitted are latched into a d-to-a converter and the resulting analog signal feeds an output amplifier, which of course is a linear device and therefore maintains the shape of the waveform.
Since the output filters have negligible effect on the main lobe, what appears on the mains is the exact spectrum required, with the side lobe down by more than 50dB. Any other noise can only come from the amplifier or the main itself.
This system was implemented in hardware, which involved minor changes to the existing mains-borne equipment. For a continuous trans mission of one sequence the results are identical to the theory as far as can be measured, except for an insignificant quantity of extra noise introduced by the power amplifier at around 1MHz.
Transmitting different sequences spreads out the spectrum somewhat, the spreading becoming noticeable at about-30dB. This is due to edge effects which appear when the line spectrum of a continuous transmission changes to the continuous spectrum of a pulse transmission. It is a relatively small effect, extending for only a few tens of kilohertz before being lost in the general noise, though it does not depend on the amount of quantization. If necessary, further filtering of the sequences could be performed on the computer to reduce or eliminate this, at the expense of a slight degradation in performance.
The system has also been tested in the field to a limited extent. It had been feared that a degradation in performance might have resulted from the bandwidth reduction: in fact this new system actually communicates noticeably better than the current system.
This improvement is due to the fact that the K sequence conforms to the sampling theorem by having all but a negligible proportion of its energy at less than the Nyquist frequency of 100kHz. This is not true of m sequences, which are in very common use in communications at the moment, though not generally in environments with such a high degree of phase distortion. Even so, it is possible that problems could result from this fact, which does not appear to have been recognized in the literature. The effect is more pronounced in the up-converted version, which has almost half its energy above 100kHz, causing the correlation function to become very small at certain points on the clock drift cycle; using K sequences removes the problem and therefore improves communications performance.
IMPROVEMENTS IN PERFORMANCE
The computer model of the mains-borne communications module used extensively in the reduced-bandwidth work is a detailed simulation of the system. It is a continuous hardware model using the clock rate as the basic unit of time, and it is interruptible after each cycle so that the system parameters can be changed or examined.
These features of the model simplify assessment of the effects of changes made to the software and hardware of the front end, and so the simulation was also used for work on improving the communications performance of the system.
Various methods of improvement were considered, including an analog correlator and low-level error correction, some of which can potentially yield a several decibel increase in s-to-n ratio. One method is described below.
of processing the results obtained from the fast correlator is important, and changes here can alter the performance of the receiver considerably. Our current system simply adds together the squares of the values of the eight results from the correlator, separately for each reference sequence (data one and data zero), producing two numbers that are compared to determine which data bit has been received. Instead of this, a matched filter can be used for the eight correlation results, which makes it possible to take the transmit ted signal characteristics into account.
Using a matched filter gives an improvement of 10dB over the current method; if desired, the channel characteristics could also be allowed for, and thus the effects of any known distortion could be minimized, resulting in a further improvement in performance.
CONCLUSIONS
A new method of generating and transmit ting spread-spectrum signals has been devised and implemented. Bandwidth can be tightly controlled, and the main lobe can be placed wherever it is wanted. There is no theoretical limit to the sharpness of the cut off that can be obtained by this method, at least with one sequence continuously transmitted.
As implemented, the system comes close to complying with the BISMA specification.
If required, further improvements could be made using the same basic techniques. The new signaling system works at least as well as the present one; however it has been field tested to only a limited extent, and more trials are needed to be certain of its performance.
System performance has been enhanced by a new method of analyzing the correlation results which can improve s-to-n ratio by up to 10dB. Being general in nature, the techniques devised and the results obtained from the research on spread-spectrum communication are applicable to areas other than mains-borne signaling. In particular the methods of generating signals with tightly-controlled bandwidths should be of interest wherever spectral efficiency is an issue.
References
1. Cooper, M.F., Kimber, I.D. and May, I.G., 1982. Fourth International Conference on 'Metering apparatus and tariffs for electricity supply', Conference Publication 217. p.100.
2. Chapman, N.R., Eyre B.E., Goodwin, S.J. and Wiener. A.. 1982, Fourth International Conference on 'Metering apparatus and tariffs for electricity supply'. Conference Publication 217. p. 108.
3. The Association of Control Manufacturers (TACMAI. Dec. 1982, 'Industry interim document draft for v.l.f. mains signaling code of practice', SSC39. (note--BMSA replaced TACMA).
Further reading Eyre, B.E., 1987, 'Results of a comprehensive field trial of a UK customer telemetry system using mains-borne signaling'. Proceedings. Fifth Inter national Conference on 'Metering apparatus and tariffs for electricity supply', IEE.
N. A. Young is with THORN EMI Central Research Laboratories UK.
==========
(adapted from: Wireless World , Oct. 1987)