By ROGER WHEELER
Most circuit analysis programs for personal computers have limited use when dealing with variations of component values. Two inexpensive programs described here can determine literal dependency and evaluated sensitivity of a circuit to produce a `toleranced' design for a given specification, a vital step in guiding students toward the art of design.
There are several software packages available for personal computers that will analyze linear analog circuits. These compute the small-signal AC numerical response for an active or passive circuit. The output of such programs is usually a listing or a plot, of the desired performance, over a given range of frequencies. The circuit modeling is accurate enough to save hours of tedious measurement on practical circuits. Computer circuit analysis is a powerful tool for those working with and those learning about electronics.
Unfortunately the assistance provided by the computer has, until recently, provided the analysis of the design but not the design itself. Complex software on mainframes is being developed', to provide an optimized circuit for a given input data base related to required performance figures. When the PC has been developed to provide 'mainframe capability' this too will be able to produce a circuit design from a given specification.
In the meantime, the circuit designer armed with a PC must be interactive with software that analyzes the 'self specified' circuit topology. A very significant step in the development of analysis has been the introduction of a suite of programs, Lanai.
Lana can perform not only the numerical analysis, but also the literal analysis of circuit performance. Literal analysis provides the gain, phase or impedance, in terms of the circuit literals (component names).
The example below indicates the program output for a lossy grounded inductor.
--------
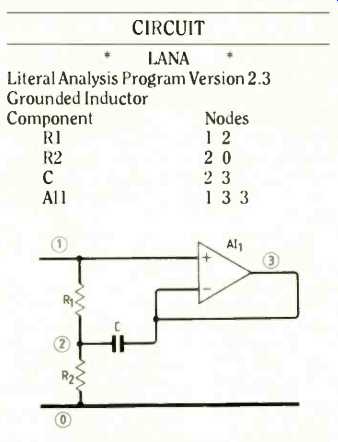
1. Literal analysis of this circuit immediately shows those components affecting
performance, e.g. Zin= (R1+ R2) + j ω R1R2C.
-------------
Input Impedance Function Input Node I Numerator
(+R2 +R1 )s’0
(+R1R2C)S’1
Denominator
( +1)s’0
Hence
Zin = R1-i-R2 +sR1 R2 C
letting s = j ω
Zin = R1 + R2+ j ω R1 R2 C
This clearly shows the dependence of the synthesized inductance on components R1, R2 and C.
Actual component values can be given and the program will complete the corresponding response over the frequency range of interest. Literal, followed by this numerical analysis, leads to very rapid evaluation of circuit performance.
Lana and another numerical analysis program Linac, both provide an additional facility of 'circuit sensitivity' which is not usually available in this type of program.
Sensitivity, indicates the relative change in performance for a change in a component value. Thus the required tolerance of a component can be evaluated for a given deviation in desired performance. This feature of 'sensitivity' shifts the emphasis of these programs towards the design, rather than just the analysis of circuits.
Both programs permit all results to be plotted, and additionally allow the 'overlay' of disc stored results. Hence the 'spread' in performance parameters is easily assessed.
Linac and Lana are used by students at the Colchester Institute for laboratory work in electronics and circuit design units in the BTEC National and Higher National programs.
Students rightly claim that the interaction of computer analysis and subsequent circuit evaluation is an aid to understanding that is both meaningful and interesting. The benefit for those teaching electronics is that aspects of circuit performance can be quickly assessed and demonstrated, without re sort to mathematical justification beyond that required by the syllabus. Additionally students can build up a 'library' of analyzed circuits, with which they are familiar, for inclusion in subsequent large scale systems.
As an example of the scope of literal and sensitivity analysis consider the following design example.
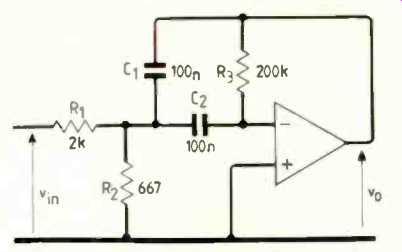
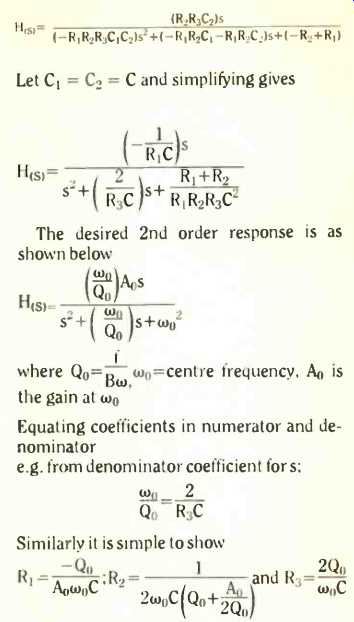
---2. Literal analysis of an active bandpass filter circuit gives a voltage
transfer function which can be adjusted to the required value by altering components
and evaluating the result.
SPECIFICATION
Design a second-order bandpass filter with a midband gain of 34dB ±3dB, with a nominal center frequency of 160Hz. The nominal Q is to be 10. This specification is based on a problem in Ref.6, Design strategy is as follows:
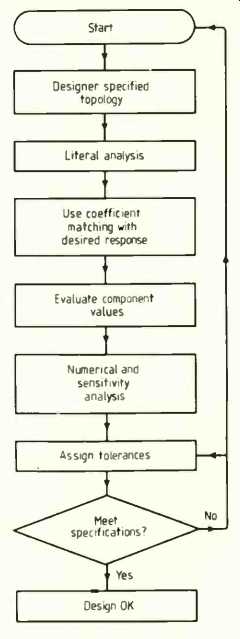
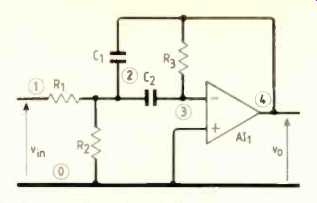
Designer-specified topology is as in Fig 2 below.
Input and resultant output from 'LANA' is shown below.
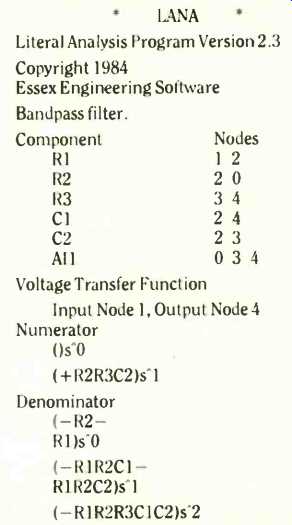
Arranging this as a rational polynomial the voltage transfer function is easily obtained as:
Alternatively R, may be set to equal the driving impedance and C1, C2 evaluated.
A1 may be a 741 op-amp.
The designed circuit is as shown below.
SENSITIVITY
Linac and Lana both provide sensitivity analysis. This will indicate the relative change in circuit performance for a change in a given component value.
The output from Linac for the circuit under consideration is shown below:
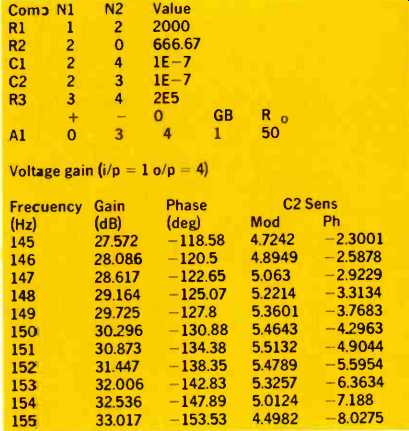
For small changes the sensitivity figures may be used to relate the effect of a change delta x/x% in a component, to the resulting relative change delta A/A% in the amplitude response and the absolute change in degrees in the phase response, i.e. a modulus sensitivity value of 1 means that a 10% change in the component will give a 10% change in the amplitude response. While a phase sensitivity of I indicates that a 10% change in the component value will alter the phase response by 0.1 degree.
Thus
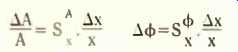
where SxA A is the modulus sensitivity and Sx is the phase sensitivity. Thus a high sensitivity indicates that the circuit response is very dependent upon the specified component.
The specification of this circuit, requires that the gain does not change by more than 3dB due to variation in any component value. As an example, consider this change was attributable due to the selection tolerance of a single component, C2.
To find the required percentage tolerance X ).100 we see that
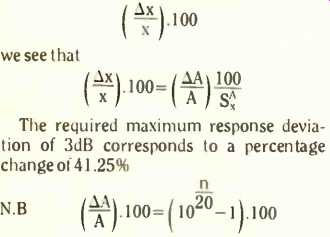
The required maximum response deviation of 3dB corresponds to a percentage change of [...]
where n is the deviation expressed in decibels.
SA=5.5132 at 151Hz
thus the required tolerance is
(delta x/x).100 = 41.25%/5.5132
= 7.5%
thus a 5% change in C2 will not change the gain of this circuit by more than 3dB. This is confirmed in Fig. 4 which shows the nominal response overlayed by the response with C2 increased by 5%.
In general the tolerance (or other variations) must be considered for all circuit components. The sensitivity plots, overlayed, for this circuit are shown in Fig. 5.
This clearly indicates that the circuit response is more sensitive to some components than others. Choosing all components to have a small tolerance may well be adequate, but Fig. 5 suggests that an approach based on assigned tolerances is possible.
Summating the effect in performance for all component changes:
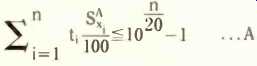
where t, is the variation (in %) of component x, and St is the sensitivity of component x at a frequency f where the sum of all products of tolerance and sensitivity will yield a positive maximum. Note in this circuit the sensitivities peak at one frequency, in general this may not be the case. n is the maximum allowable deviation in gain, in dB.
Setting the tolerance in components as follows
R1 R2 R3 C1 C2
5% 2% 1% 2% 1%
…evaluating the sum of products of tolerance and sensitivity, for this circuit, a maximum is seen to occur at 167Hz.
Substituting values into equation A yields
0.3783 < 0.4125
Hence this allocation of tolerances, even under worst case conditions, will not cause the gain to exceed the specification. Fig 6 shows the nominal response overlayed with the response with all values incremented as indicated above. Note that the error in amplitude is very close to the specification indicating that this is a 'sensitive' circuit.
The designer would be advised to consider another circuit or the assignment of smaller tolerances, before committing this design to production.
CONCLUSION
It has been shown that using appropriate software it is possible to move towards interactive design, yielding circuits that provide appropriate responses with toleranced design matched to a given specification.
These steps are often accomplished by knowledge acquired by experience. However for engineers and technicians undergoing training such knowledge may not be under pinned by experience. For them, a formalized approach, as outlined above, has been found to be of considerable benefit.
References
Electronics and Power August 1986.
Lana. Essex Engineering Software, 24 Albany Close. West Bergholt, Colchester, Essex C06 3LE.
Linac. Essex engineering Software.
Computer Aided Circuit Design, J. K. Fidler & C. Nightingale, published by Nelson.
Sensitivity Analysis. J. Lidgey. Electronics and Wireless World May 1986.
Microelectronics digital and Analog Circuits and Systems, Jacob Millman, published by McGraw Hill.
3. The designed bandpass filter with components evaluated to meet the nominal
specification can be subjected to sensitivity analysis to perform the tolerancing
of the design.
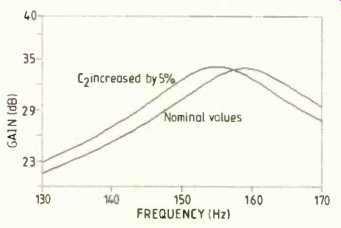
4. Program printout from Linac showing the effect on performance of a single
component (C2) change.
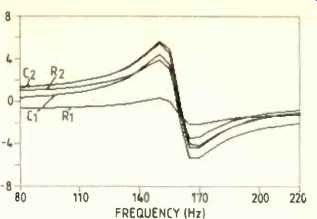
5. Program printout showing the relative component sensitivities. R3 is particularly
'sensitive' at the center frequency.
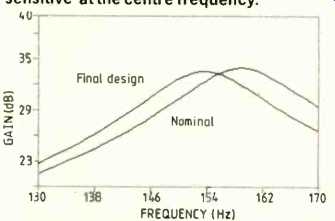
6. Comparison of the performance of the final design with the nominal response.
In the final circuit all components are at their maximum excursions of tolerance.
Note that the change in gain meets the specification of f_o.
CIRCUIT MODELER--5 YEARS ON
An updated version of Circuit Modeler, first described in E&WW August 1982, is available for Personal Computers using MS-DOS, and the Atari ST. In addition to the gain, phase, group delay, and bandwidth calculations on circuits, two new features are the 'screen plot' and the 'tune' commands. The screen plot is upright rather than sideways, and is much faster in use. The tune command enables a selected R, L or C to be tuned through a given range and the response displayed on a plot. New built-in models are the hybrid-pi for the transistor and the FET model, which take their parameters from libraries on disk. New hardware supported is a mouse for pop-up menus and for manipulating the cross-hairs on the plot. Also the 8087 is supported giving a 300% improvement in calculation time. Up to 80 node circuits are accommodated with up to 260 components. A library of transistors is supplied on disk with 50 different devices. Libraries of FETs and op-amps are also supplied. Circuit Modeler is available from Harcourt Systems, Worthing, W. Sussex.
------------
==========
(adapted from: Wireless World , Dec. 1987)