AMAZON multi-meters discounts AMAZON oscilloscope discounts
Objectives
This Section will help you understand the prime modes of signal transmission and familiarize you with the various methods of signal transmission and where they are used.
This Section discusses the following:
_ Pneumatic signal transmission
_ Types of analog electrical signal transmission
_ Electrical to pneumatic signal converters
_ Thermocouple and resistive type devices and temperature signal transmission
_ The operation of the signal processor in signal transmission
_ Smart sensors and fieldbus
_ Programmable logic controllers (PLCs) and ladder diagrams
_ Telemetry signal transmission
_ Conversion of digital signals into analog signals for actuator control
Measurement of variables are made by sensors, conditioned by transducers, and then transferred to another location using a transmitter. In the case of process control, the accuracy of transmission of the value of the variable is very important; any errors introduced during transmission will be acted upon by the controller and will degrade the accuracy of the signal. There are several methods of transmitting data. The chosen solution will depend on the sensor, application of the signal, the distance the signal needs to be sent, the accuracy requirements of the system, and cost. Unfortunately, the accuracy of the system can be degraded by poor transmission.
1. Introduction
The various methods of signal transmission are discussed in this Section.
Control signals can be transmitted pneumatically or electrically. Due to the needs of an air supply for pneumatic transmission, inflexible pluming, cost, slow reaction time, limited range of transmission, reliability, accuracy, and the requirements of control systems, electrical transmission is now the preferred method. Electrical signals can be transmitted in the form of voltages, currents, digitally, optically, or via wireless. Unfortunately, the terms transducer, converter, and transmitter are often confused and used interchangeably.
Transmitters are devices that accept low-level electrical signals and format them, so that they can be transmitted to a distant receiver. The transmitter is required to be able to transmit a signal with sufficient amplitude and power so that it can be reproduced at a distant receiver as a true representation of the input to the transmitter, without any loss of accuracy or information.
Offset refers to the low end of the operating range of a signal. When per forming an offset adjustment, the output from the transducer is being set to give the minimum output (usually zero) when the input signal value is a minimum.
Span refers to the range of the signal, i.e., from zero to full-scale deflection. The span setting (or system gain) adjusts the upper limit of the transducer with maximum signal input. There is normally some interaction between offset and span; the offset should be adjusted first and then the span.
2. Pneumatic Transmission
Pneumatic signals were used for signal transmission and are still in use in older facilities or in applications where electrical signals or sparks could ignite combustible materials. Pneumatic transmission of signals over long distances require an excessively long settling time for today's processing needs and when compared to electrical signal transmissions. Pneumatic signal lines are also inflexible, bulky, and costly compared to electrical signal lines and are not micro processor compatible. Hence, they will not be used in new designs, except possibly, in special circumstances as mentioned. Pneumatic transmission pressures were standardized into two ranges, i.e., 3 to 15 psi (20 to 100 kPa) and 6 to 30 psi (40 to 200 kPa); the 3 to 15 psi is now the preferred range. Zero is not used for the minimum of the ranges as low pressures do not transmit well and the zero level can then be used to detect system failure.
3. Analog Transmission
3.1 Noise considerations
Analog voltage or current signals are hard wired between the transmitter and the receiver. Compared to digital signals, these signals can be relatively slow to settle due to the time constant of the lead capacitance, inductance, and resistance, but are still very fast in terms of the speed of mechanical systems. Analog signals can loose accuracy if signal lines are long with high resistance; can be susceptible to ground offset, ground loops, noise and radio frequency pick-up. FIG. 1a shows the controller supplying dc power to the transmitter and the signal path from the transmitter to the controller. The dc power for the sensors can be obtained from the controller to save the cost of deriving the power at the sensor as shown in Fig. 1b. However, the current flowing in the ground line (shown in Fig. 1a) from the supply will be much larger than the signal current and will produce a voltage drop across the resistance of the ground lead, elevating the ground level of the transmitter which will give a signal offset error at the controller. The second problem with this type of hard wiring is that it is susceptible to radio frequency (RF) and electromagnetic induction (EMI) noise pick-up, i.e., the induced noise from RF transmitters and motors will produce error signals.
To reduce these problems the setup shown in Fig. 1b can be used. This setup shows that the dc supply to the transmitter is generated from the ac line volt age via an isolation transformer and voltage regulator at the transmitter. The ground connection is used only for the signal return path. The signal and ground return leads are a screened twisted pair, i.e., the signal leads are screened by a grounded sheath. The RF and EMI pickup are reduced by the screen and the induced noise in both lines is greatly reduced. Because variations in the supply voltages can produce changes in the offset voltage and the gain of the sensor/ transmitter, the supply voltage must be regulated.
An improved method of minimizing RF and EMI pickup is shown in Fig. 2. In this case, the transmitter sends a differential signal using a screened twisted pair. The reduced pickup will affect both signals by the same amount and will cancel in the differential receiver in the controller. Differential signals are not normally affected by ground offsets.
A differential output voltage signal can be generated using the circuit shown in Fig. 3. The output stages have unity gain to give low output impedance and equal and opposite phase signals. Op-amps are also commercially available with differential outputs which can be used to drive buffer output stages.
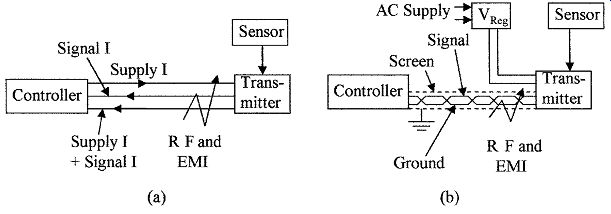
FIG. 1 Supply and signal connections are shown between controller
and transmitter using (a) straight leads and (b) a twisted pair.
3.2 Voltage signals
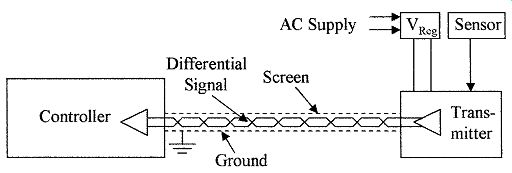
FIG. 2 Screened differential signal connection between the controller
and the transmitter.
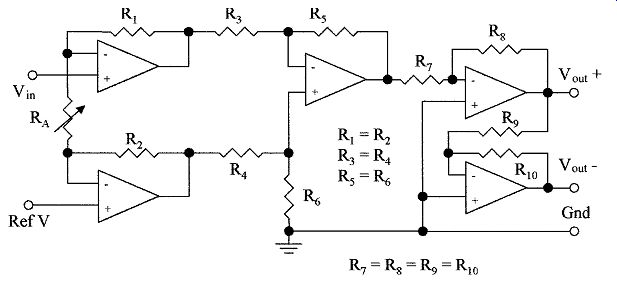
FIG. 3 Differential amplifier with buffer outputs.
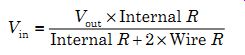
Voltage signals are normally standardized in the voltage ranges 0 to 5 V, 0 to 10 V, or 0 to 12 V, with 0 to 5 V being the most common. The requirements of the transmitter are a low output impedance to enable the amplifier to drive a wide variety of loads without a change in the output voltage, low temperature drift, low offset drift, and low noise. FIG. 4a shows a transmitter with a volt age output signal. Its low output impedance enables the driver to charge up the line capacitance, achieving a quick settling time. However, the input voltage to the controller Vin can be less than the output voltage Vout from the transmitter due to resistance losses in the cables if the receiver is drawing any current, i.e.,
(13 )
The internal R of the controller must be very high compared to the resistance of the wire and connections, to minimize signal loss (which is normally the case).
A differential signal as shown in Fig. 4 will eliminate ground noise and offset problems.
3.3 Current signals
Current signals are standardized into two ranges; these are 4 to 20 mA and 10 to 50 mA, where 0 mA is a fault condition. The latter range was the preferred standard but has now been dropped, and the 4 to 20 mA range is the accepted standard. The requirements of the transmitter are high output impedance, so that the output current does not vary with load, low temperature, offset drift, and low noise. FIG. 4b shows a transmitter with a current output. The main disadvantage of the current signal is its longer settling time due to the high output impedance of the driver which limits the available current to charge up the line capacitance. After the line capacitance is charged, the signal current at the controller is the same as the signal current from the transmitter and is not affected by normal changes in lead resistance. The internal resistance of the controller is low for current signals, i.e., a few hundred ohms. Again a differential signal connection eliminates noise and ground problems.
3.4 Signal conversion
Signal conversion is required between low-level signals and high-energy control signals for actuator and motor control. Control signals can be either digital, analog voltage or analog current, or pneumatic. It is sometimes necessary to convert electrical signals to pneumatic signals for actuator control. Pneumatics is still used in applications where the cost of converting to electrical control would be prohibitive, electromagnetic (e/m) radiation could cause problems, or in a hazardous environment where sparks from electrical devices could cause volatile material to ignite.
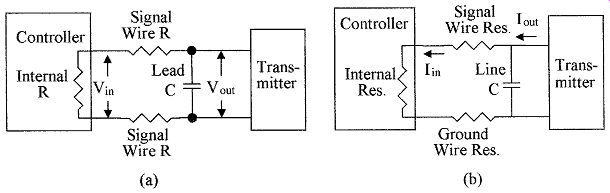
FIG. 4 Effect of resistance and lead capacitance on (a) voltage signals
and (b) current signals.
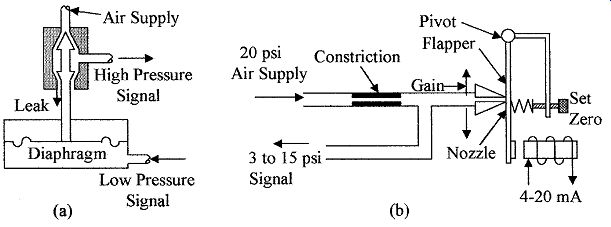
FIG. 5 Signal conversion (a) pressure amplifier and (b) current to
pressure transducer.
A linear pneumatic amplifier or booster can be used to increase the pressure from a low-level pressure signal to a high pressure signal to operate an actuator.
FIG. 5a shows a pressure amplifier. Gas from a high-pressure supply is con trolled by a conical plug which is controlled by a diaphragm whose position is set by a low-pressure signal. The gain of the system is set by the area of the diaphragm divided by the area of the base of the conical plug. The output pres sure is inverted but linear with respect to the input pressure; the device shown is one of many different types. Pneumatic feedback can be used to improve the characteristics of the amplifier.
One of the many designs of a current-to-pressure converter is shown in Fig. 5b.
The spring tends to hold the flapper closed, giving a high-pressure output (15 psi).
When current is passed through the coil the flapper moves towards the coil opening the air gap at the nozzle reducing the output air pressure. The output air pressure is set to the maximum of 15 psi by the set zero adjustment when the current through the coil is 3 mA. The system gain and span is set by moving the nozzle along the flapper. The output pressure is inverted with respect to the amplitude of the current in the setup as shown, but could be set up to be non inverting. There is a linear relationship between current and pressure.
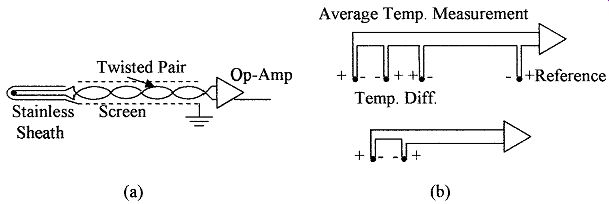
FIG. 6 Different types of thermocouple connections to an op-amp (a)
direct using twisted pair to a reference and amplifier and (b) for average
temperature measurement and differential temperature measurement.
3.5 Thermocouples
Thermocouples have several advantages over other methods of measuring temperature, in that they are very small in size, have a low time response (10/20 ms compared to several seconds for some elements), are reliable, have good accuracy, a wide operating temperature range, and they can convert temperature directly into electrical units. The disadvantages are the need for a reference and the low signal amplitude. Thermocouple signals can be amplified with a cold junction reference close to the amplifier and the signal transmitted in an analog or digital format to a controller, or the thermocouple can be directly connected to the controller for amplification and cold junction correction. This method is sometimes used to eliminate the cost of remote amplifiers and power sup plies. Controller peripheral modules are available for amplification of several thermocouple inputs with cold junction correction; Fig. 6a shows a differential connection between the amplifier and the thermocouple as a twisted pair of wires that is screened to minimize noise and the like. FIG. 6b shows other configurations that can be used to connect thermocouples for temperature averaging and differential temperature measurements.
3.6 Resistance temperature devices
Resistance temperature devices (RTD) can be connected directly to the controller peripheral amplifiers using a two-, three-, or four-wire lead configuration; these are shown in Fig. 7. The RTD is driven from a constant current source I and the voltage drop across the RTD measured. The two-wire connection (a) is the simplest and cheapest, the three-wire connection (b) is a com promise between cost and accuracy, and the four-wire connection (c) is the most expensive but most accurate. The wires in all cases will be in screened cables.
In the case of the two-wire connection the voltage drop is measured across the lead wires as well as the RTD; the resistance in the two-lead wires can be significant, giving a relatively high degree of error.
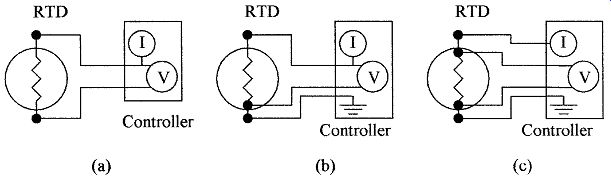
FIG. 7 Alternative connection schemes between an RTD and a controller
(a) two lead, (b) three lead, and (c) four lead.
In the case of the three-wire connection, a direct return lead from the RTD to the voltmeter is added, as shown. The voltage drop dV between the ground connection and the lower RTD connection as well as the voltage drop V between the current source and the lower RTD connection can be measured. If the resistance in each supply lead to the RTD is assumed to be the same, the voltage across the RTD is V - dV correcting for the error caused by the common lead wire. In most cases each lead wire will have about the same resistance, so this method is accurate enough for most applications. With the four-wire connection the voltmeter is connected directly to the RTD as shown in Fig. 7c and because no current flows in the leads to the voltmeter there is no voltage drop in the measuring leads and an accurate RTD voltage reading is obtained.
4. Digital Transmission
4.1 Transmission standards
Digital signals can be transmitted via a hardwired parallel or serial bus, radio transmission or fiber optics, without loss of integrity. Digital data can be sent faster than analog data due to higher speed transmission. Another advantage is that digital transmitters and receivers require much less power than analog transmission devices.
Communication standards for digital transmission between computers and peripheral equipment are defined by the Institute of Electrical and Electronic Engineers (IEEE). The standards are the IEEE-488 or RS-232. However, several other standards have been developed and are now in use. The IEEE-488 standard specifies that a digital "1" level will be represented by a voltage of 2 V or greater and a digital "0" level shall be specified by 0.8 V or less as well as the signal format to be used. The RS-232 standard specifies that a digital "1" level shall be represented by a voltage of between +3 V and +25 V and a digital "0" level shall be specified by a voltage of between -3 V and -25 V as well as the signal format to be used. Fiber optics are now also being extensively used to give very high speed transmission over long distances and are not affected by electromagnetic or RF pickup. FIG. 8 shows a two way fiber optic cable set up with light emitting diode (LED) drivers and photodiode receivers.
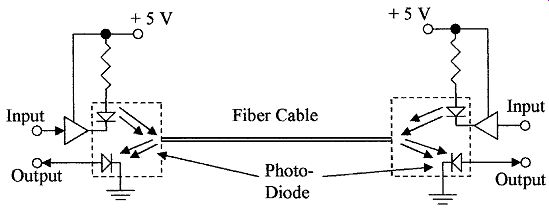
FIG. 8 Fiber-optic bus.
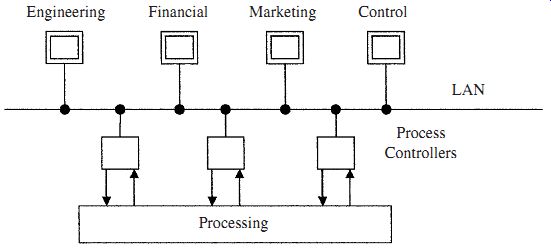
FIG. 9 A LAN network.
Digital signals can be transmitted without loss of accuracy and can contain error correction codes for limited automatic error correction or to automatically request data retransmission. These networks are known as local area networks (LAN) when used in a limited area such as a plant or wide area networks (WAN) when used as a global system. A typical LAN network is shown in Fig. 9.
Engineering, finance, and marketing can communicate with the process controllers to monitor plant operations for cost figures and product delivery details over the LAN, directly from the process control system.
Computer based process control systems are flexible systems with a central processor and the ability to add interface units on a limited basis. The interface units can be receivers for reception of analog and/or digital information from the monitoring sensors or transmitters for sending control information to control actuators. A typical receiver unit will contain 8 analog amplifiers with analog to digital convertors (ADCs) giving the unit the ability to interface with 8 analog transmitting devices and change the data into a digital format to interface with the processor. Other interface units contain thermocouple amplifiers or bridges for use with resistive sensors. A data transmitter unit will have the capability of controlling 8 actuators and will contain 8 digital-to-analog convertor (DAC) to change the digital data to an analog format for each actuator being controlled. This set up is shown in Fig. 10. Each input or output requires its own interconnect cable or bus resulting in a mass of wiring which requires careful routing and identification marking.
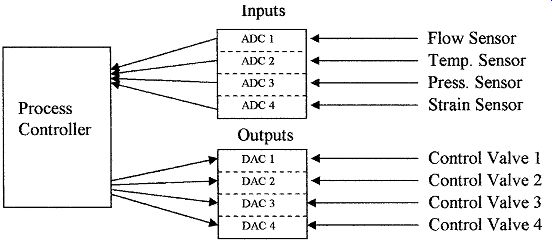
FIG. 10 Process system with individual inputs and outputs for each
variable.
4.2 Smart sensors
Smart sensor is a name given to the integration of the sensor with an ADC, processor, and DAC for actuator control and the like; such a setup for furnace temperature control is shown in Fig. 11. The electronics in the smart sensor contains all the circuits necessary to interface to the sensor, amplify the signal, apply proportional, integral, and derivative (PID) control (see Sect. 14), sense temperature to correct for temperature variations in the process if required, correct for sensor nonlinearity, the ADC to convert the signal into a digital format for the internal processor, and the DAC to convert the signal back into an analog format for actuator control. The processor has a serial digital bus interface for interfacing via the fieldbus to a central computer. This enables the processor in the smart sensor to receive update information on set points, gain, operating mode, and so on, and to send status information to the central computer.
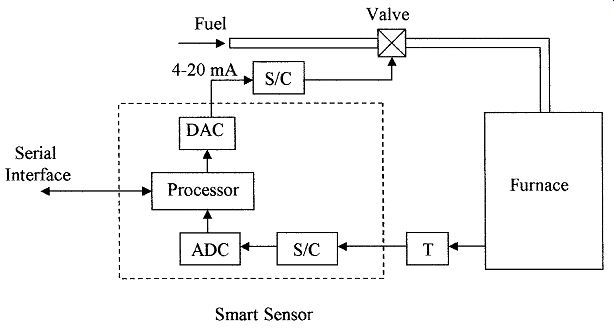
FIG. 11 Smart sensor block diagram.
4.3 Foundation Fieldbus and Pro-bus
Foundation Fieldbus (FF) and Profibus are the two most universal serial data bus formats that have been developed for interfacing between a central processor and smart sensing devices in a process control system. The Foundation Fieldbus is primarily used in the United States and the Profibus format is primarily used in Europe. Efforts are being made for a universal acceptance of one bus system. At present, process control equipment are being manufactured for one system or the other; global acceptance of equipment standards would be preferred. A serial data bus is a single pair of twisted copper wires and enables communication between a central processing computer and many monitoring points and actuators when smart sensors are used. This is shown in Fig. 12.
Although initially more expensive than direct lead connections, the advantages of the serial bus are minimal bus cost and installation labor. The system replaces all the leads to all the monitoring points by one pair of leads, new units can be added to the bus with no extra wiring, a plug and play feature is provided, giving faster control, and programming that is the same for all systems. Higher accuracies are obtained than using analog and more powerful diagnostics are available. As the cost of integration and development lowers, the bus system with its features will become more cost effective than the present systems.
The bus system uses time division multiplexing. The serial data word from the central processor contains the address of the peripheral unit being addressed in a given time slot and the data being sent. In the FF current from a constant current, supply is digitally modulated. Information on FF is given in the ISA 50.02 standards.
One disadvantage of the FF is that a failure of the bus, such as a broken wire, can shut the whole process down, whereas, with the direct connection method only one sensor is disabled. This disadvantage can be overcome by the use of a redundant or a backup bus in parallel to the first bus, so that if one bus mal functions the backup bus can be used.
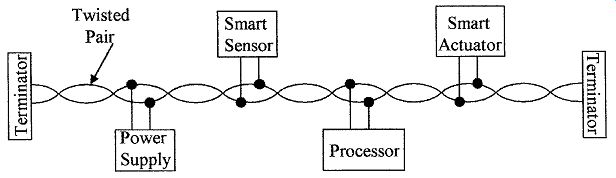
FIG. 12 Foundation Fieldbus cable connection.
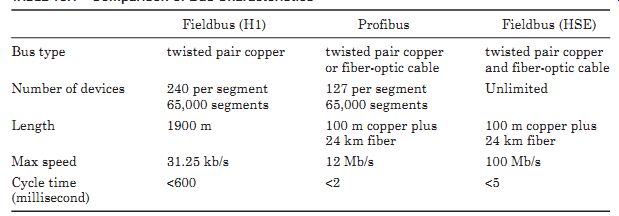
TABLE 1 Comparison of Bus Characteristics
A comparison of the characteristics of the serial data buses is given in TABLE 1.
The original FF was designated H1, a new generation of the H1 is the HSE, which will use an Ethernet LAN bus to provide operation under the TCP/IP protocol used for the internet. The advantages are increased speed, unlimited addresses, and standardization.
5. Controller
Due to the complexity and large number of variables in many process control systems, microprocessor based Programmable Logic Controllers (PLC) are used for decision making. The PLC can be configured to receive a small number of inputs (both analog and digital) and control a small number of outputs or the system can be expanded with plug-in modules to receive a large number of signals and simultaneously control a large number of actuators, displays, or other types of devices. In very complex systems, PLCs have the ability to communicate with each other on a global basis and to send operational data to and be controlled from a central computer terminal. FIG. 13 shows a typical controller setup, monitoring a single variable. The output from the sensor is conditioned and transmitted to the input module of the controller; if the signal is an analog signal it is converted to a digital signal and compared to a reference signal stored in the computer. A decision can then be made and the appropriate control signal sent via the output module to the actuator.
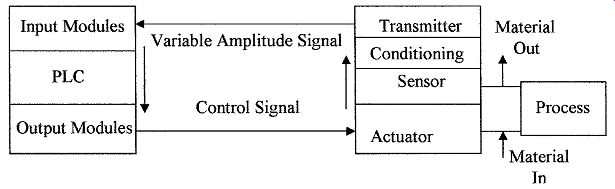
FIG. 13 Block diagram of a control loop.
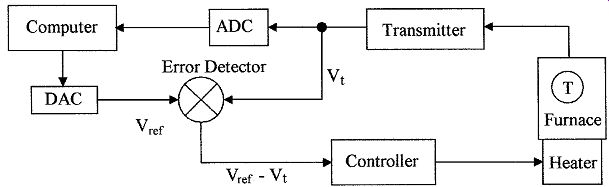
FIG. 14 Supervisory control using an analog control loop.
The internal control function of a furnace using an analog loop is shown in Fig. 14. The temperature of the furnace is transmitted to the computer in the PLC as an analog signal, where it is converted to a digital signal and recorded in the computer memory. The voltage reference signal Vref is converted to an analog signal and the two signals are subtracted as shown in an analog error differencing circuit. The amplified difference signal is then fed via a control circuit to the furnace heater, making the control loop analog.
In Fig. 15 the furnace temperature is converted into a digital signal and transmitted to the computer in the PLC. The digital temperature signal Dt and the digital reference signal Dref are compared in a digital error detection circuit and the difference signal is sent as a digital signal to the controller, where it is converted into a pulse width modulated (PWM) signal or a DAC is used to control the heater. The control loop in this case would be considered as a digital control loop. PWM will be discussed later in this section.
5.1 Controller operation
The operation cycle in the PLC is made up of two separate modes; these are the I/O scan mode followed by the execution mode.
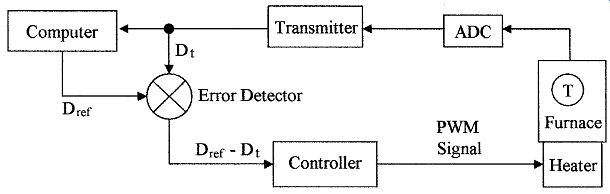
FIG. 15 Supervisory control using a digital control loop.
I/O scan mode is the period when the processor updates the output control signals based on the information received from the previous I/O scan cycle after its evaluation of the signals. The processor then scans the inputs in a serial mode and updates its internal memory as to the status of the inputs.
Execution mode follows the I/O scan mode. In this mode the processor evaluates the input data stored in memory against the data programmed into the CPU. The programs are usually set up using ladder networks, where each rung of the ladder is an instruction for the action to be taken for each given input data level. The rung instructions are sequentially scanned and the input data evaluated. The processor can then determine the actions to be taken by the output modules and puts the data into memory for transfer to the output modules during the next I/O scan mode.
Scan time is the time required for the PLC to complete one I/O scan plus the execution cycle. This time depends on the number of input and output channels, the length of the ladder instruction sets, and the speed of the processor. A typical scan time is between 5 and 20 ms. As well as evaluating data, the PLC can also generate accurate time delays, store and record data for future use, and pro duce data in chart or graph form.
5.2 Ladder diagrams
The ladder diagram is universally used as a symbolic and schematic way to rep resent the interconnections between the elements in a PLC. The ladder network is also used as a tool for programming the operation of the PLC. The elements are interconnected as shown between the supply lines for each step in the control process, giving the appearance of the rungs in a ladder. A number of programming languages are in common use for controllers, they are as follows:
Ladder
Instruction list
Boolean flowcharts
Functional blocks
Sequential function charts
High level languages (ANSI, C, structured text)
FIG. 16 shows some of the typical symbols used for the elements in a ladder diagram. A number of momentary action switches are shown, these are from top to bottom; a push to close (normally open NO) and a push to open (normally closed NC). These switches are the normal momentary action panel mounted operator switches.
Position limit switches are used to sense the position of an object and set to close or open when a desired position is reached. Pressure, temperature, and level switches are used to set limits and can be designed to open or close when the set limits are reached.
The symbol for a control relay is a circle with the designation CR followed or preceded by a number to distinguish between the various relays used. This is shown with the symbols for its NO and NC contacts. These contacts will carry the same CR and number as the relay. A timer relay has the designation TR with a number and its associated NO and NC contacts will be likewise named and numbered.
A motor is represented by a circle with the letter M and an appropriate number. An indicator is represented by a circle with radiating arms and a letter to indicate its color, i.e., R = red, B = blue, O = Orange, G = green, and so on.
Other elements are represented by boxes as shown, with the name of the element and a number to distinguish between similar types of elements used in different places.
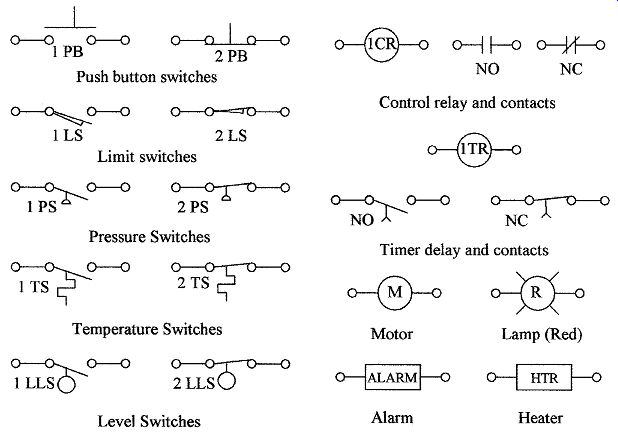
FIG. 16 Some of the symbols in use for ladder diagrams.
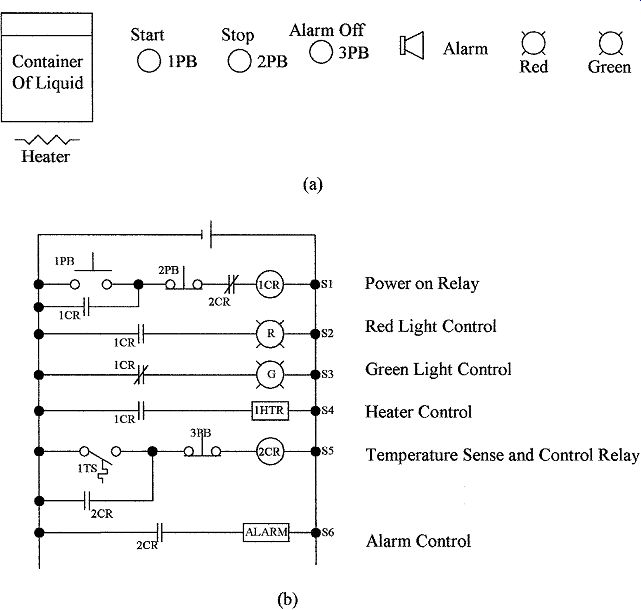
FIG. 17 (a) Liquid heating system for Example 1 and (b) complete
ladder diagram for Example 1.
The verticals forming the sides of the ladder represent the supply lines. The elements are connected serially between the supply lines as in a normal electrical schematic to form the rungs of the ladder. Each ladder rung is numbered using the hexadecimal numbering system with a note describing the function of the rung. This concept is best understood by Example 1.
Example 1---The heating system shown in Fig. 17a shows a container of liquid with a heating element, three momentary action push button switches (start, stop, alarm off) with red and green indicator lights, and an alarm. Show, using a ladder diagram, how the elements can be connected, so that when system power is applied the green light is lit. When the start button is pushed the heater is turned ON, the red light turns on and green goes off. When the liquid reaches a preset temperature, the power is turned off and an alarm sounds. Provision is made to turn the alarm OFF and to be able to turn the power to the heater OFF.
FIG. 17b shows a possible solution to Example 1. The first three rungs S1, S2, and S3 are used for control of the indicator lights and the power to the rest of the circuit. Momentary closure of switch 1 PB will energize control relay 1 CR, this in turn will close 1 CR NO contacts and open 1 CR NC contacts. These contacts will perform the following operations:
1. In ladder rung S1, 1 CR NO contact will connect 1 CR relay to the supply so that on release of 1 PB the relay will remain energized.
2. In ladder rung S2, the red light will be turned ON by the 1 CR NO contacts.
3. In ladder rung S3, the green light will be turned OFF by opening the 1 CR NC contacts.
4. In ladder lung S4, power will be turned ON to the heating element by the 1 CR contacts.
The container of liquid will heat up until the temperature sensor in rung S5 reaches its limit and closes. On closure, control relay 2 CR is energized and its contacts will perform the following functions:
1. In rung S5 the contact will connect 2 CR relay to the supply, bypassing the temperature sensor contacts, keeping 2 CR energized.
2. In rung S6 the contacts will supply power to the alarm.
3. In rung S1 the 2 CR NC contact will turn OFF the supply to control relay 1 CR de-energizing the relay, which in turn will change the lights from red to green and turn OFF the heating element.
The alarm will remain enabled until turned OFF by switch 3 PB via relay 2 CR. Relay 1 CR can also be turned OFF by switch 2 PB.
6. Digital-to-Analog Conversion
There are two methods of converting digital signals to analog signals. These are digital-to-analog converters, which are normally used to generate a voltage reference or low power voltage signals, and pulse width modulation that is used in high power circuits, i.e., actuator and motor control and so on.
6.1 Digital-to-analog converters
Digital-to-analog converters (DAC) change digital information into analog using a resistor network or similar method. The analog signals are normally used for low power applications but can be amplified and used for control. FIG. 18a shows the generation of a 1 kHz sine wave. In the example shown, the digital signal is converted to a voltage every 0.042 ms giving the step waveform shown. In practice, the conversion rate could be higher approximating the steps to a complete sine wave. Shown also is the binary code from the DAC (4 bits only), the step waveform can be smoothed by a simple RC filter to get the sine wave.
The example is only to give the basic conversion idea. Commercial DAC, such as the DAC 0808 shown in Fig. 18b are readily available. The DAC 0808 is an 8-bit converter which will give an output resolution or accuracy of 1 in (2^8- 1) (-1 is because the first number is zero leaving 255 steps) or an accuracy of ±0.39 percent. For higher accuracy analog signals a 12-bit commercial DAC would be used (±0.025 percent accuracy).
6.2 Pulse width modulation
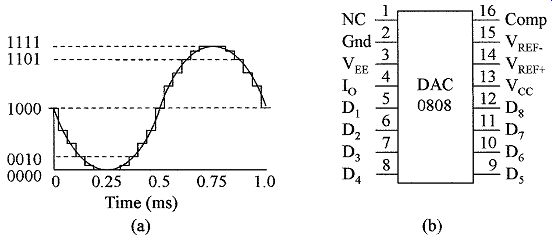
FIG. 18 (a) 1 kHz sine waveform reproduced from a DAC and (b) commercial
8-bit DAC.
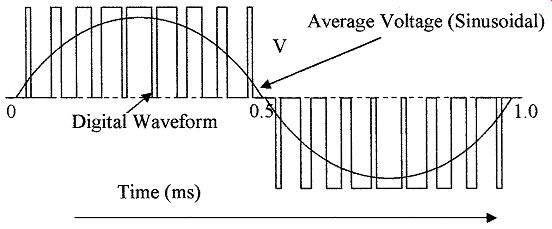
FIG. 19 PWM signal to give a 1 kHz sine wave using positive and negative
supplies.
Pulse Width Modulation changes the duration for which the voltage is applied to reproduce an analog signal and is shown in Fig. 19. The width of the output pulses shown are modulated, going from narrow to wide and back to narrow. If the voltage pulses shown are averaged, the width modulation shown will give a half-sine wave. The other half of the sine wave is generated using the same modulation, but with a negative supply, or with the use of a bridge circuit to reverse the current flow. The current is limited by the load. This type of width modulation is normally used for power drivers for ac motor control from a dc supply. Output devices such as the insulated gate bipolar transistor (IGBT) are used as switches, i.e., they are ON or OFF and can control over 100 kW of power.
This method of conversion gives low internal dissipation with high efficiency, that can be as high as 95 percent of the power going into the load. Whereas, analog power drivers are only 50 percent efficient at best and have high internal power dissipation.
7. Telemetry
Telemetry is the wireless transmission of measurement data from a remote location to a central location for processing and/or storage. This type of transmission is used for sending data over long distances from weather stations and the like, and data from rotating machinery where cabling is not feasible. More recently wireless communication is being used to eliminate cabling or to give flexibility in moving the positioning of temporary monitoring equipment.
Broadcast information is a wireless transmission using amplitude modulation (AM) or frequency modulation (FM) techniques. But these methods are not accurate enough for the transmission of instrumentation data, as reception quality varies and the original signal can not be accurately reproduced. In telemetry, transmitters transmit signals over long distances using a form of FM or a variable width amplitude modulated signal. When transmitting from battery or solar cell operated equipment it is necessary to obtain the maximum transmitted power for the minimum power consumption. FM transmits signals at a constant power level, whereas, AM transmits at varying amplitudes and pulsing techniques can transmit only the pulse information needed which con serves battery power, hence for the transmission of telemetry data pulse AM is preferred.
7.1 Width modulation
Width coded signals or PWM are blocks of RF energy whose width is proportional to the amplitude of the instrumentation data. Upon reception the width can be accurately measured and the amplitude of the instrumentation signal reconstituted. FIG. 20a shows the relation between the voltage amplitude of the instrumentation signal and the width of the transmitted pulses, when transmitting a series of 1 V signals and a series of voltages through 10 V.
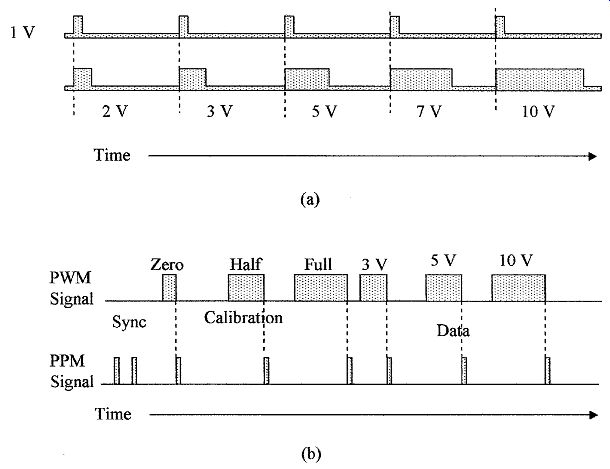
FIG. 20 (a) an amplitude modulated waveform where the width of the modulations
correspond to voltage levels and (b) PWM and PPM waveforms compared.
For further power saving PWM can be modified to pulse position modulation (PPM). FIG. 20b shows a typical PWM modulation and the equivalent PPM signal. The PWM signal shows an OFF period for synchronization of transmitter and receiver. The receiver then synchronizes on the rising edge of the transmitted zero; the first three pulses of the transmission are calibration pulses followed by a stream of width modulated data pulses. In the case of the PPM, narrow synchronization pulses are sent and then only a pulse corresponding to the lagging edge of the width modulated data is sent. Once synchronized, the receiver knows the position of the rising edge of the data pulses, so that information on the lagging edge is all that is required for the receiver to regenerate the data. This form of transmission has the advantage of greatly reducing power consumption and extending battery life.
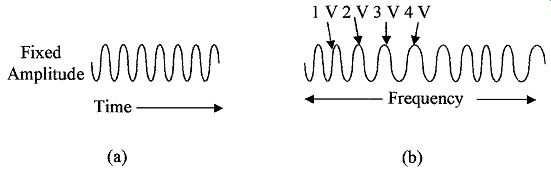
FIG. 21 Frequency modulation (a) unmodulated waveform and (b) data
modulated waveform.
7.2 Frequency modulation
Frequency modulation is shown in Fig. 21a. The unmodulated carrier has fixed amplitude and frequency. In Fig. 21b the frequency of the transmit ted signal is varied in proportion to the amplitude of the variable; the amplitude of the transmitted signal does not change. On reception the base frequency of the transmission is subtracted from the received signal leaving the frequency of modulation, which can then be measured and the data reconstituted to deter mine the amplitude of the variable.
Summary
This Section discusses the various types of data used in signal transmission and their advantages and disadvantages. The methods of interconnecting multiple devices in a process control system and controller operation.
The important points covered in this Section are as follows:
1. The pros and cons of pneumatic signal transmission compared to electrical transmission in new and old systems.
2. Electrical analog signal transmission can use voltage or current signals and both have their advantages and disadvantages when trying to minimize errors.
3. Electrical signals can be converted to pneumatic signals for driving actuators for controlling hazardous material, where electrical sparks could ignite the material and so forth.
4. Thermocouples can be set up and interconnected to measure differential and average temperatures or connected in series to increase their sensitivity as in a thermopile.
5. RTDs can be interconnected using two, three, or four wires. Two wires are the lowest cost method, but are less accurate than the more expensive four wire connection.
6. Digital signal transmission has higher signal integrity and is faster than analog signal transmission and can use error correction codes to correct for any errors in transmission.
7. Smart sensors and the interconnection schemes using FF in the United States and Profibus in Europe.
8. Considerations when programming a PLC using ladder networks and the symbols used in the network.
9. The PLC cycle is divided into two modes of operation; the scan mode and the execution mode.
10. Conversion from digital signals to analog control signals using resistor net works and pulse width modulation.
11. Transmission of telemetry signals and methods of reducing the power required by using PPM.
Problems
1 Name various methods of data transmission.
2 What types of signal transmissions are used in telemetry?
3 What are the various types of connections used for RTD elements and what are the advantages and disadvantages of the various types of connections?
4 What are the standard ranges used in the transmission of pneumatic and electrical analog signals?
5 What conversion techniques are used to convert digital into analog signals?
6 Define offset and span.
7 What are the digital transmission standards?
8 Describe where a fiber cable is used and its advantages and disadvantages.
9 What are the advantages of digital over analog transmission?
10 Describe the modes of operation and scan time of a PLC.
11 What transmission speeds are used in the FF system?
12 What is a smart sensor?
13 Describe PPM and its advantage over PWM.
14 What is a ladder diagram?
15 What are the advantages of amplitude modulation over frequency modulation?
16 What are the advantages and disadvantages of current over voltage signal transmission?
17 Why are pneumatic signals used in electrical signal transmission?
18 Name the modes used in a controller.
19 How many steps are there in a 12-bit DAC and what is the percent resolution?
20 How many devices can be connected to the Fieldbus and Profibus?
Related Articles -- Top of Page -- Home