The synchronizing pulses, generally called sync, are part of the composite video as the top 25 percent of the signal amplitude. Included are the horizontal, vertical, and equalizing pulses. These are clipped from the video signal by the sync separator.
Then the sync is coupled to the horizontal and vertical deflection oscillators to time the scanning frequencies. As a result, the picture information reproduced by the camera signal variations is in the correct position on the raster. The horizontal sync pulses hold the line structure of the picture together by locking in the frequency of the horizontal oscillator. The vertical sync pulses hold the picture frames locked in vertically by triggering the vertical oscillator. The equalizing pulses help the vertical synchronization be the same in even and odd fields for good interlacing.
The operation of the sync in timing the deflection oscillators is the same for monochrome or color. The only difference is that, in color, the horizontal line frequency for sync and scanning is 15,734 Hz instead of 15,750 Hz, while the vertical field frequency is 59.94 Hz.
The time for the transmitted signal to travel to the receiver has no effect on synchronization. The reason is that the sync pulses must be present at the same time as the camera signal variations in the composite video signal. Furthermore, the sync is for the picture, not the raster, as the deflection circuits can produce vertical and horizontal scanning with or without sync. In short, the sync times the scanning in the raster with respect to the picture information in the video signal. The effects of no sync are shown in Figs. 16-1 and 16-2. Details of the sync circuits are explained in the following topics:
16-1 Vertical synchronization of the picture
16-2 Horizontal synchronization of the picture
16-3 Separating the sync from the video signal
16-4 Integrating the vertical sync
16-5 Noise in the sync
16-6 Horizontal AFC
16-7 Sync separator circuits
16-8 Phasing between horizontal blanking and flyback
16-9 Sync and blanking bars on the screen
16-10 Sync troubles
FIGURE 16-1 PICTURE ROLLING WITHOUT VERTICAL SYNC. (a) PICTURE SLOWLY SLIPS
FRAMES VERTICALLY. (b) PICTURE ROLLS FAST UP OR DOWN.
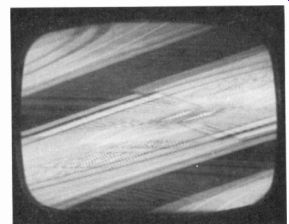
FIGURE 16-2 PICTURE IN DIAGONAL BARS WITHOUT HORIZONTAL SYNC.
16-1 Vertical Synchronization of the Picture
When every vertical scanning field is produced at the correct time, the frames are superimposed on each other. The result is a steady picture, locked in frame. If the vertical scanning is not locked in at the 60-Hz sync frequency, successive frames cannot overlap. Instead, the frames are displaced either above or below the first frame. Without vertical synchronization, therefore, the picture on the screen appears to roll up or down.
The faster the picture rolls, the farther the vertical scanning frequency is from 60 Hz. If the vertical scanning frequency is just slightly off the 60-Hz synchronizing rate, the picture will be recognizable, as shown in Fig. 16-1a, but it slips out of frame slowly. In b the picture is rolling fast. The wide black bar across the picture in Fig. 16-1a is produced by vertical blanking, which now occurs during vertical trace time because the scanning is out of sync.
When the picture rolls up or down, the vertical hold control is varied to lock in the picture. The hold control adjusts the frequency of the oscillator close enough to 60 Hz to enable the vertical sync voltage to trigger the oscillator at the sync frequency. The picture locks in when it is rolling upward because the oscillator frequency must be slightly less than the sync frequency for triggering.
16-2 Horizontal Synchronization of the Picture
When every scanning line is produced at the correct time, the line structure of the reproduced picture holds together to provide a complete image that stays still horizontally. If the horizontal scanning is just slightly off, the 15,750-Hz sync frequency, the line structure is complete, but the picture slips horizontally, as the picture information on the lines is displaced horizontally in successive frames. The faster the picture slides horizontally, the farther the scanning frequency is from 15,750 Hz. When the horizontal scanning frequency departs from the 15,750-Hz synchronizing frequency by 60 Hz or more, the picture tears apart into diagonal segments, as shown in Fig. 16-2. The black diagonal bars represent parts of horizontal blanking, which is normally at the sides of the picture.
Each diagonal bar represents a 60-Hz difference from 15,750 Hz. In Fig. 16-2, the two bars sloping down to the left show the horizontal scanning frequency is 120 Hz below 15,750 Hz.
When the picture is in diagonal bars, the horizontal hold control is adjusted to make a complete picture. Then the horizontal AFC circuit keeps the picture locked in horizontally.
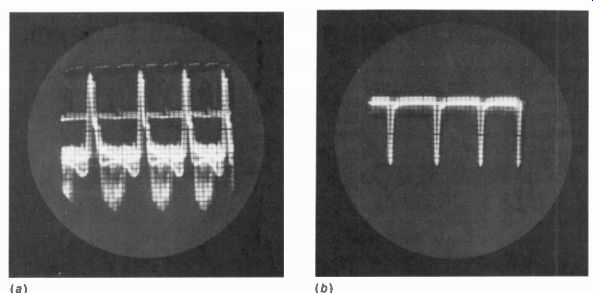
FIGURE 16-3 INPUT AND OUTPUT OF SYNC SEPARATOR. ONLY HORIZONTAL SYNC CAN
BE SEEN WITH OSCILLOSCOPE SWEEP FREQUENCY AT 15,750/4 Hz. (a) COMPOSITE VIDEO
SIGNAL INPUT WITH POSITIVE SYNC POLARITY. AMPLITUDE IS 40 V p-p. (b) SEPARATED
SYNC WITH NEGATIVE POLARITY. AMPLITUDE IS 60 V p-p.
16-3 Separating the Sync from the Video Signal
Figure 16-3a shows oscilloscope waveforms of composite video signal input to the separator stage and its clipped sync output in b. Note that the clipped sync is actually amplified, from an amplitude of about 10 V in the input to 60 V in the sync output. Horizontal sync is shown here with the oscilloscope internal sweep frequency at 15.750/4 Hz. When the scope is set at 64/ 4 Hz, however, you see four vertical sync pulses.
The sync separator can be a triode or pentode tube, a transistor, or a diode. All do the clipping the same way, basically. They have dc bias beyond cutoff. However the ac signal drive is enough to produce output only for the sync tips of the video signal input. This sync clipping is illustrated in Fig. 16-4 by the input-output characteristic of a separator stage. The horizontal, vertical, and equalizing pulses are all clipped from the peak amplitudes of the video signal.
The sync can be clipped at any point above the blanking level, as the leading and trailing edges of the pulses actually supply the timing information.
If there is a question of what happens to the camera signal in the video input, the answer is "nothing." The input to the sync separator has the composite video with sync, blanking, and camera signal, but the output is only sync.
Remember that the camera signal with the information for the picture tube is in a separate path with the video amplifier.
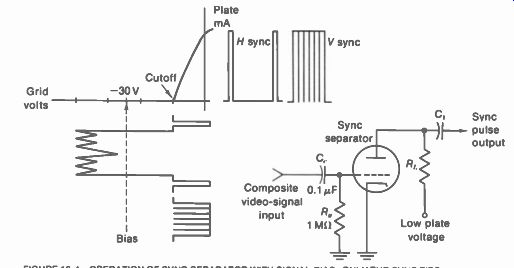
FIGURE 16-4 OPERATION OF SYNC SEPARATOR WITH SIGNAL BIAS. ONLY THE SYNC TIPS
PRODUCE OUTPUT. EQUALIZING PULSES OMITTED. V AND H PULSES NOT SHOWN TO SCALE.
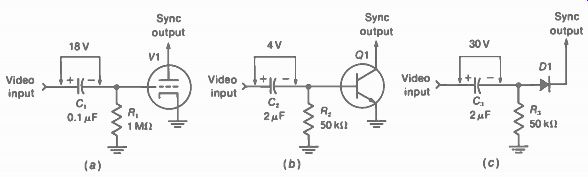
FIGURE 16-5 SIGNAL BIAS FOR SYNC SEPARATOR STAGES. DC BIAS VOLTAGE ACROSS
C _p C. AND C, IS PRODUCED BY THE INPUT SIGNAL. (a) GRID-LEAK BIAS ON TRIODE
TUBE V1. (b) REVERSE VOLTAGE AT BASE OF NPN TRANSISTOR 01. (c) REVERSE VOLTAGE
AT ANODE OF DIODE D1
Signal bias for the sync separator. Signal bias means that the dc bias voltage is produced by the ac signal input. The requirements are to rectify the input signal and have an RC time constant long enough to maintain the bias between peaks of the ac input. A perfect example shown in Fig. 16-5a is grid-leak bias. Without signal, there is no bias. However, the positive half cycle of the ac input drives the grid positive to produce grid current. Then C, is charged with the grid side negative. Between peaks of the input signal, C, can discharge slightly through R,. However, the R,C, time constant is made long enough to keep C, charged to about 90 percent of the peak positive input. The grid cathode circuit is serving as a diode rectifier to produce the negative dc bias voltage across CI , proportional to the peak signal input.
Not only is the dc bias across C, negative for the control grid, but for a sync separator the amount of bias is more negative than cutoff.
However, the peak positive drive is always enough to produce output plate current for the positive peaks of the ac input. Grid-leak bias automatically adjusts itself to this level. The reason is that the bias increases or decreases with the amount of signal just enough to keep the positive peaks at zero grid voltage and maximum plate current. This action is called clamping, which means keeping the tips lined up at one level.
In Fig. 16-5b, the R2C2 coupling provides signal bias for the base of an NPN transistor.
The polarities correspond exactly to grid-leak bias with a tube. Actually, grid-leak bias can be considered reverse voltage for the control grid.
The negative voltage on C2 is reverse voltage for the P-base. However, positive sync voltage in the signal input drives the transistor into conduction to produce the sync output in the collector current. The voltage values in b are less than fcr the tube in a because the transistor requires only 0.5 V or more for forward voltage at the base input to produce collector current output.
The RC time constant in b is the same as a but with larger C and smaller R because of the lower input resistance of a transistor.
The clipping action with the diode in c is similar to the other two circuits. The diode corresponds to the base-emitter junction of the transistor. More bias with more signal input is shown in c, as there is no amplification of the clipped sync with a diode.
Note that for all three circuits in Fig. 16-5 the dc signal bias voltage always has the polarity away from the direction of conduction. Then the video signal is applied in the polarity that allows oily the sync to produce output current Amplitude separation. This term means clipping all the sync pulses from the composite video signal. One or two stages may be used.
With two stages, both the top and bottom of the sync can be clipped in opposite polarities.
Waveform separation. This means separating the vertical sync from the horizontal sync. The total separated sync voltage includes horizontal, vertical, and equalizing pulses, as shown in Fig. 16-6. All have the same amplitude, but they differ in their repetition rate, or frequency, and in pulse width. We can think of the width as the time the pulse is on. The horizontal sync with a narrow pulse width of 5 As, repeated at 15,750 Hz, represents a high-frequency signal compared with vertical sync. The vertical pulses are repeated at the slow rate of 60 Hz. The width is 27.3 As between the narrow serrations with a total width of 190.5 As or three horizontal lines.
Therefore, the vertical and horizontal sync can be separated from each other by RC filters.
The vertical sync requires a low-pass filter, with series R and shunt C, to bypass the horizontal sync but pass the vertical synchronizing voltage.
This is the function of the R,C, integrator* in Fig. 16-7. The R,C, time constant of 100 As is too long for the horizontal sync to produce any appreciable voltage across C,. In a separate path, the R,C, coupling circuit in Fig. 16-7 is a high-pass filter for the horizontal sync into the horizontal AFC circuit. The RC 2 time constant
[*See Appendix D for explanation of RC integrator and differentiator circuits.] of 0.82 As is too short for the vertical sync to produce any appreciable voltage across R2.
Sequence of sync separation. As shown in Fig. 16-7, first the sync in the composite video signal is separated by a sync clipper. The total separated sync is then coupled to two parallel paths for waveform separation. The R,C, integrator receives all the sync pulses, but C, builds up charge only during the relatively wide vertical sync pulse. The equalizing pulses help in making the integrated voltage across C, the same for even and odd fields. As a result, the vertical deflection oscillator is triggered at 60 Hz to hold the picture locked in vertically.
All receivers use automatic frequency control for the horizontal deflection oscillator. The horizontal AFC circuit is better than triggered sync for holding the horizontal oscillator at the correct frequency in the presence of noise pulses.
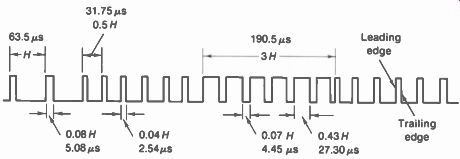
FIGURE 16-6 WAVEFORM OF THE SYNCHRONIZING PULSES. HIS HORIZONTAL LINE TIME
OF 63.5 p.s.
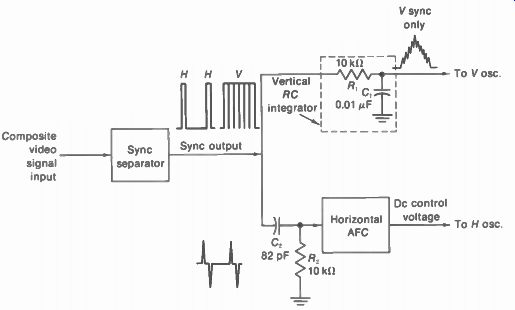
FIGURE 16-7 SEQUENCE FOR SYNC SEPARATION. CLIPPER STAGE FOR AMPLITUDE SEP
ARATION IS FOLLOWED BY WAVEFORM SEPARATION FOR VERTICAL AND HORIZONTAL SYNC
16-4 Integrating the Vertical Sync
With the relatively large value of 0.01 uF for C, in Fig. 16-8, it bypasses the horizontal sync pulses but not the vertical sync. More exactly, this R,C, low-pass filter integrates, or adds up, the effect of the serrated vertical sync pulse. The requirements for integrating the vertical sync are (1) take the voltage output across C _p not R _p and (2) have the R,C, time constant long compared with the H pulse width but not the V pulse width. As a result, the total sync voltage is coupled to the R,C, integrator, but the output voltage across C, is vertical sync alone. This voltage triggers the vertical deflection oscillator at the vertical sync frequency.
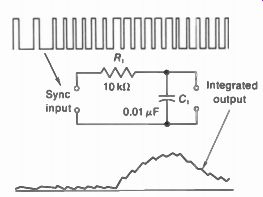
FIGURE 16-8 INTEGRATION OF VERTICAL SYNC VOLTAGE ACROSS C,. THE R,C, TIME
CONSTANT HERE IS 100 As.
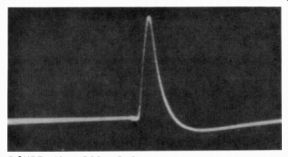
FIGURE 16-9 OSCILLOSCOPE PHOTO OF 60-Hz IN TEGRATED VERTICAL SYNC. AMPLITUDE
IS 10 V.
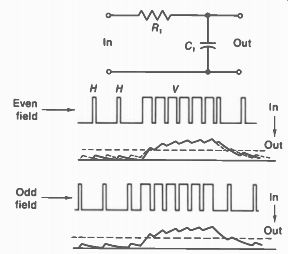
FIGURE 16-10 INTEGRATED OUTPUT ACROSS C, FOR EVEN AND ODD FIELDS WITHOUT
EQUALIZING PULSES. DOTTED WAVEFORM IN UPPER FIGURE IS THE LOWER WAVEFORM SUPERIMPOSED.
THE DASHED LINES ACROSS BOTH WAVEFORMS SHOW THE LEVEL TO WHICH C, VOLTAGE
MUST RISE TO TRIGGER VERTICAL OSCILLATOR.
The time constant of the R,C, integrator in Fig. 16-8 is 100 u-s. The serrated vertical pulse consists of six individual pulses, each of approximately 27 As. In this time, C, charges to 27 percent of the applied voltage. This value is obtained from the universal charge curve in Appendix D. During the serration, applied voltage is removed and the capacitor discharges. This is only for 4.4 us, however. Therefore, C, loses little of its charge before the next 27-tie pulse provides sync voltage to recharge the capacitor.
As a result, the integrated voltage across C, builds up toward maximum amplitude at the end of the vertical pulse, followed by a decline practically to zero for the equalizing pulses and horizontal pulses that follow. The result is a pulse of the triangular waveshape shown for the complete vertical synchronizing pulse.
You can see the 60-Hz integrated vertical sync pulses with an oscilloscope at the grid of the vertical oscillator (Fig. 16-9). However, the oscillator must be off, as its grid voltage is much larger than the sync voltage. Or, with the oscillator on but slightly out of sync, you can see the vertical sync pulse moving across the grid-voltage waveform.
The amplitude in Fig. 16-9 is 10 V, but the integrated sync usually triggers the vertical oscillator before the peak. How much sync voltage is necessary depends on the oscillator frequency. The closer the oscillator is to 60 Hz, the less sync voltage needed for triggering.
Generally, the vertical hold control sets the oscillator at 50 to 59 Hz, to be locked in sync at 60 Hz at the time of the third or fourth division of the vertical sync. The main requirement for timing is that the triggering occur at exactly the same time of the vertical sync pulse for every field.
Effect of the equalizing pulses. Their function is improving the accuracy of vertical synchronization in even and odd fields for good interlace (see Fig. 16-10). Note that with the equalizing pulses, the voltage across C, can ad just itself to practically equal values for even and odd fields, although there is a half-line difference in time before the vertical pulse begins.
Then the integrated output for vertical sync is the same for even and odd fields.
Cascaded integrator sections. A very long time constant for the integrating circuit removes the horizontal sync pulses but reduces the vertical sync amplitude across the integrating capacitor. The rising edge on the integrated vertical pulse is not sharp enough. With a time constant that is not long enough, the horizontal sync pulses cannot be filtered out, and the serrations in the vertical pulse produce notches in the integrated output. The notches should be filtered out because they give the integrated vertical synchronizing signal the same amplitude value at different times. Figure 16-11 illustrates too much integration and not enough integration.
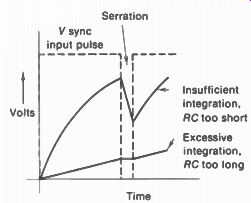
FIGURE 16-11 INTEGRATED VERTICAL SYNC VOLTAGE FOR TIME CONSTANT TOO LONG
AND TOO SHORT
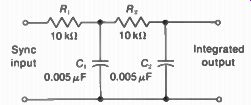
FIGURE 16-12 TWO-SECTION INTEGRATOR FOR VERTICAL SYNC
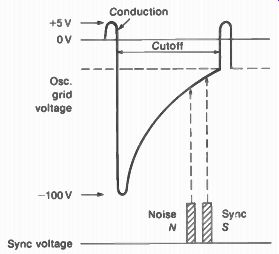
FIGURE 16-13 HOW OSCILLATOR CAN BE TRIGGERED INTO CONDUCTION BY A NOISE PULSE
INSTEAD OF THE SYNC PULSE
Figure 16-12 shows a two-section integrating circuit with each RC section having a time constant of 50 us. The operation of the circuit can be considered as though the R,C, section provided integrated voltage across C, that is applied to the next integrating section R2C2. The overall time constant for both sections is long enough to filter out the horizontal sync, while the shorter time constant of each section allows the integrated voltage to rise more sharply because each integration is performed with a time constant of 50 As. If one section is open, there will be less filtering but actually more vertical sync voltage because of a shorter time constant.
16-5 Noise in the Sync
Noise pulses are produced by ignition interference from automobiles, arcing brushes in motors, and by atmospheric static. The noise is either radiated to the receiver or coupled through the power line. Especial .y with weak signal, the noise can act as false synchronizing pulses. In the vertical circuit, the noise pulses can trigger the vertical oscillator too soon. See Fig. 16-13. Then the noise makes the picture roll temporarily, until the sync locks in the oscillator again. For horizontal synchronization, the noise can be mistaken for horizontal sync pulses.
Then the picture tears into diagonal segments during the loss of horizontal sync.
Furthermore, when the noise pulses have much higher amplitude than the sync voltage, the signal bias on the sync separator is too high.
This effect of increased bias by the noise voltage is called noise setup. Then the sync separator has too much bias for the actual signal level.
The result is weak sync or no sync at all. During the noise, then, the picture does not hold still until the synchronization is established again.
In order to reduce the effects of noise, the sync circuits generally include one or more of the following:
1. Sync clipper stage for the sync alone, after the sync is separated from the video signal.
The additional clipping means that both the top and bottom of the sync pulses can be clipped by cutoff, because of the opposite polarities for the sync voltage in successive stages. Then the noise pulses cannot have higher amplitude than the sync pulses.
2. Double time constant for the signal bias in the sync separator. See Fig. 16-14. A long time constant is needed for the vertical sync, but a shorter time constant reduces noise setup.
3. Noise-inverter stage, noise-canceller, noise switch, or noise gate. Such a stage can remove high-amplitude noise pulses by cut ting off the sync separator, just during the time of a noise pulse. See Fig. 16-15.
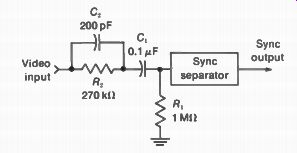
FIGURE 16-14 DOUBLE TIME CONSTANT FOR SIGNAL BIAS ON SYNC SEPARATOR. Fi.,C2
HAS SHORT TIME CONSTANT TO REDUCE EFFECT OF NOISE.
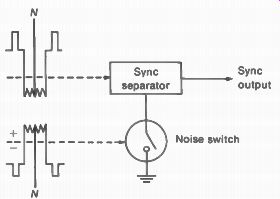
FIGURE 16-15 NOISE SWITCH TO CUT OFF SYNC SEPARATOR, TEMPORARILY, DURING
THE TIME OF NOISE PULSE N.
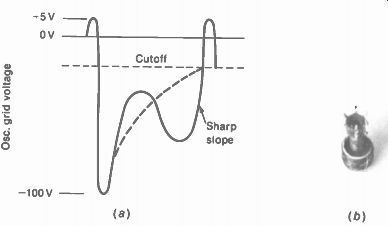
FIGURE 16-16 (a) SINE WAVE ADDED TO GRID-VOLTAGE WAVEFORM FOR STABILIZING
OSCILLATOR AGAINST TRIGGERING BY NOISE PULSES. DASHED LINE SHOWS GRID VOLTAGE
WITHOUT SINE WAVE. (b) PHOTO OF STABILIZING COIL. HEIG H- IS 1V, IN.
4. Sine-wave stabilizing circuit.
The horizontal deflection oscillator usually has an LC circuit to produce sine-wave voltage that is added to the oscillator voltage. As shown in Fig. 16-16, the result is a sharper slope in the oscillator grid voltage, just before conduction time when the oscillator is easy to trigger. Then any noise pulse must have a high amplitude, or it cannot trigger the oscillator into conduction. The sine-wave coil, often called the stabilizing coil, also stabilizes the oscillator against changes in supply voltage and transistor characteristics.
It should be noted that reducing the noise in the sync does not prevent noise pulses in the video signal from producing horizontal streaks in the picture. The purpose of the noise-reduction circuits in the sync section is to allow the picture to hold still in the presence of noise.
How noise triggers an oscillator. Figure 16-13 illustrates the effect of a noise pulse in the sync voltage. Consider this example for a vertical oscillator using a vacuum tube for a blocking oscillator or a multivibrator. The oscillator is held cut off by its own grid voltage for a relatively long time and conducts for a short time, at the repetition rate for vertical scanning. Toward the end of the cutoff time, a small positive voltage at the grid can trigger the oscillator into conduction.
Normally, the sync pulse S triggers the oscillator for every cycle to lock it in at 60 Hz. However, if the noise pulse N occurs just before the sync pulse, the noise can trigger the oscillator. Then the sync pulse has no effect. As a result, the vertical scanning is off 60 Hz, and the picture rolls, until the vertical sync triggers the oscillator again.
It should be noted that, without the noise, the grid voltage in Fig. 16-13 would be normal, remaining beyond cutoff until the sync triggers the oscillator. This means that canceling the noise pulses is the best way to eliminate the effects of noise in the sync.
Sync separator time constant. The time constant of the grid-leak bias circuit in the input to the separator must be long enough to maintain the bias from line to line and through the time of the vertical synchronizing pulse, in order to maintain a constant clipping level. Typical values for grid-leak bias with a tube are 0.1 µF for C, and 1 MO for R _p providing a time constant of 0.1 s (Fig. 16-14). These values allow the bias to vary from frame to frame for different bright ness values, keeping the tip of sync clamped at zero grid voltage. However, a time constant of 0.1 s is too long for the bias to follow amplitude variations produced by noise pulses.
In order to reduce the effect of high frequency noise pulses on the grid-leak bias for the sync separator, an RC circuit with a short time constant can be added to the grid circuit of the sync separator, as shown in Fig. 16-14. The grid coupling circuit R, C, provides normal grid leak bias, with a time constant of 0.1 s, for the sync signal. The small 200-pF C2 and the 270-kO R2 provide a short time-constant combination.
Then the grid-leak bias can change fast enough to reduce the effect of noise pulses in the input to the sync separator.
The smaller C2 can charge faster than C, when noise pulses produce grid current. Then most of the noise pulse voltage is across CZ. However, C2 discharges fast through R2 between noise pulses. As a result, the signal bias produced by R,C, remains at the level determined by the sync voltage.
Noise switch. In Fig. 16-15, the noise switch illustrates a tube or transistor that is part of the return circuit to chassis ground for the sync separator. With the switch closed, the separator conducts to produce sync output. When the switch is open, though, the sync separator is cut off. Closed or open for the switch corresponds to its being conducting or cut off.
The switch operation is controlled by video signal with opposite sync polarity from the signal input to the sync separator. Usually, the noise switch has input from the video detector, while the video amplifier feeds the sync separator. Then a noise pulse with the polarity that would increase conduction in the separator has the reverse polarity for the switch to cut it off. As a result, the switch can eliminate noise in the sync separator output by cutting off the output, temporarily, during the time of noise pulses. It is important to note, though, that the separator operates normally for the sync voltage to provide separated sync in the output.
Stabilizing coil. See Fig. 16-16. This coil is usually in the plate circuit of the horizontal oscillator, to feed back sine-wave voltage to the grid. The sharp slope as the grid voltage re turns to cutoff means that the oscillator cannot be triggered easily. Horizontal AFC is used to hold the oscillator on frequency, while the stabilizing coil prevents false triggering by interfering pulses. In some circuits, the variable slug in the stabilizing coil serves as the horizontal hold control.
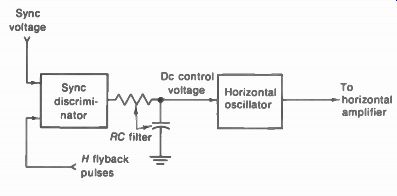
FIGURE 16-17 BLOCK DIAGRAM OF AFC CIRCUIT FOR HORIZONTAL OSCILLATOR
16-6 Horizontal AFC
A deflection oscillator triggered by sync pulses for each cycle is capable of exact synchronization, if there is no noise interference. however, noise pulses can be mistaken for sync and trigger the oscillator at the wrong time. In order to make the synchronization more immune to noise, an AFC circuit is used for the horizontal deflection oscillator in all television receivers.
This is generally called sync lock, stabilized sync, or horizontal AFC. The AFC circuit is generally the only section used for horizontal sync alone. Therefore, when the picture tears into diagonal bars too easily, the trouble is likely to be in the horizontal AFC, or the horizontal oscillator. AFC is generally not used for the vertical deflection oscillator.
The main reason is that the vertical RC integrator is a low-pass filter that removes high frequency noise pulses.
AFC requirements. The typical arrangement of an AFC circuit for the horizontal deflection oscillator is illustrated in Fig. 16-17. The operation can be considered in the following steps:
1. Horizontal sync voltage and a fraction of the horizontal deflection voltage are coupled into the sync discriminator. A discriminator is a dual-diode circuit that can detect a difference in frequency. The deflection voltage is needed as a sample of the oscillator frequency. It can be taken either from the oscillator or horizontal output circuit.
2. The sync discriminator circuit produces dc output voltage proportional to the difference in frequency between its two input voltages.
3. The dc control voltage indicates whether the oscillator is on or off the sync frequency.
The greater the difference between the oscillator and sync frequencies, the larger is the dc control voltage.
4. The dc control voltage is filtered by an RC integrator. With a shunt bypass capacitor, noise pulses cannot affect the dc control voltage appreciably.
5. The filtered dc control voltage changes the oscillator frequency by the amount necessary to make the scanning frequency the same as the sync frequency.
It is important to note that the AFC circuit needs two ac voltage inputs, from sync and deflection, to produce the correct dc voltage output. If one ac voltage input is missing, the dc voltage output cannot measure the frequency correctly.
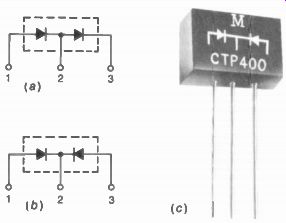
FIGURE 16-18 DUAL-DIODE UNIT COMMONLY USED FOR SYNC DISCRIMINATOR. (a) ONE
ANODE AND CA M ODE COMMON AT TERMINAL 2 FOR PUSH-PULL SYNC INPUT TO TERMINALS
1 AND 3. (b) COMMON CATHODES FOR SINGLE-ENDED SYNC INPUT AT TERMINAL 2. (c)
PHOTO OF UNIT FOR SINGLE-ENDED CIRCUIT.
The horizontal deflection oscillator generally uses either the multivibrator or blocking oscillator circuit. For these pulse oscillators, the frequency depends on the dc operating voltages, especially the bias. The oscillator frequency is changed by 50-100 Hz for 1 V of change in dc voltage at the control grid of a triode tube. Positive grid voltage increases the frequency for a blocking oscillator. At the synchronizing grid of a cathode-coupled multivibrator, negative voltage increases the frequency.
Sync discriminator. A dual-diode unit is used, as shown in Fig. 16-18. There are only three leads, as one is common to the two diodes. In the schematic symbols, the arrow is the anode side with the bar for the cathode. In a, the anode of one diode is common to the other cathode, leaving an anode and cathode for the other two leads. This type is for a balanced discriminator circuit, where push-pull sync voltages of opposite polarities are required for input to the two diodes. The type in b is for a single-ended discriminator with negative sync voltage fcr the common cathodes. It should be noted that when the receiver has a multipurpose tube that includes twin diodes, they are often used for the sync discriminator instead of a semiconductor unit.
Push-pull sync discriminator. In Fig. 16-19, opposite polarities of sync voltage are coupled to the two diodes. R2C2 couples positive sync to the D2 anode, while R,C, couples negative sync to the 01 cathode. Remember that negative voltage at the cathode makes diode current flow, just like positive voltage at the anode. As a result, the sync input voltage drives both diodes into conduction.
Deflection voltage is needed as a sample of the oscillator frequency. Therefore, flyback pulses from a winding on the horizontal output transformer are applied to the R,C, network.
The polarity is chosen to make the slope of the flyback on the sawtooth increase in the positive direction. Each positive pulse charges C, during the fast flyback. Then C„ discharges during the relatively long time between pulses. The result is the sawtooth voltage shown across C3, which is applied to the 01 anode and the D2 cathode.
The sawtooth input voltage is applied in the same polarity to both diodes. Note that when this voltage makes the 01 anode positive, it aids the diode current. However, this positive voltage at the D2 cathode opposes diode current, like negative anode voltage.
The ac input is rectified by the diodes to produce the required dc control voltage in the output. Each diode is a peak rectifier for the sync pulses. This means the amount of diode conduction depends on the peak value of the ac input voltage. The amount of conduction depends on how the sync input voltage is phased with respect to flyback on the sawtooth voltage.
Note that C., in series with R, is in a common path for both diodes. R, provides a dc return to chassis ground.
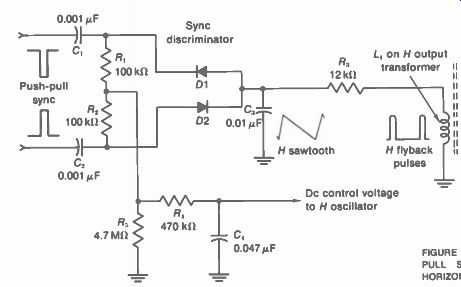
FIGURE 16-19 SCHEMATIC OF PUSH PULL SYNC DISCRIMINATOR FOR HORIZONTAL AFC
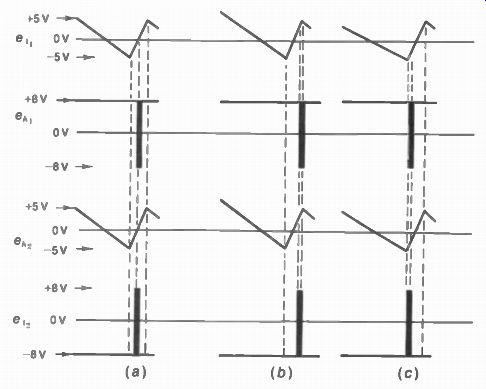
FIGURE 16-20 WAVESHAPES FOR PUSH-PULL SYNC DISCRIMINATOR IN FIG. 16-19. ANODE
VOLTAGE IS e,: CATHODE VOLTAGE IS e„. (a) NORMAL CONTROL WITH SYNC AND SAW
TOOTH SAME FREQUENCY. SYNC PULSE IN MIDDLE OF FLYBACK. (b) OSCILLATOR TOO
FAST WITH SHORTER SAWTOOTH CYCLE. SYNC PULSE AT END OF FLYBACK. (c) OSCILLATOR
TOO SLOW WITH LONGER SAWTOOTH CYCLE. SYNC PULSE AT START OF FLYBACK.
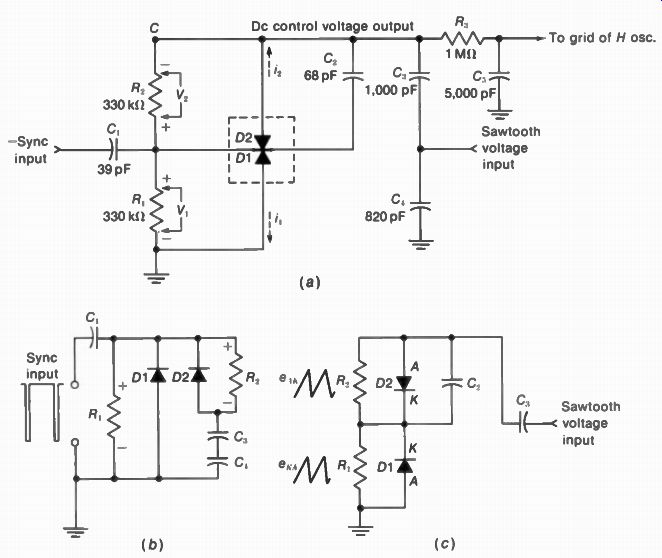
FIGURE 16-21 SCHEMATIC OF SINGLE-ENDED DISCRIMINATOR FOR HORIZONTAL AFC.
(a)ACTUAL CIRCUIT WITH NEGATIVE SYNC INPUT THROUGH C, AT THE LEFT TO COMMON
CATHODES. THE DC CONTROL VOLTAGE IS TAKEN OUT FROM POINT C AT THE TOP THROUGH
R. (b) EQUIVALENT CIRCUIT SHOWING DIODES IN PARALLEL FOR SYNC VOLTAGE INPUT.
(c) DIODES IN SERIES FOR SAWTOOTH VOLTAGE INPUT.
Conduction in D1 makes the voltage across C., more positive. When D2 conducts, however, the current is in the opposite direction, and the voltage across C., becomes more negative. When both diodes conduct the same amount of current, the net voltage across C4 is zero. This condition of zero dc control voltage occurs when the sync and scanning frequencies are the same. When the oscillator is below or above the sync frequency, C4 provides negative or positive dc control voltage to correct the oscillator frequency.
The waveforms in Fig. 16-20 show how the sync and sawtooth voltages combine to control conduction in the discriminator diodes. In a each sync pulse occurs in the middle of flyback time because the oscillator is on frequency. At this time, the sawtooth input voltage is at the same value of zero for both diodes. The zero level is the average-value axis of the ac sawtooth wave. With equal sync voltages, therefore, the peak input voltage has the same amplitude for either diode. Then they conduct equal currents to provide a net voltage of zero across C4. The oscillator frequency is too high in Fig. 16-20b. As the sawtooth cycle takes less time, the sync pulse occurs later, at the end of the flyback voltage. Then D1 conducts more than D2, and the result is positive dc control voltage across C4.
In c the oscillator frequency is too low. As the sawtooth cycle takes more time, the sync pulse now occurs earlier, at the start of flyback voltage. Now D2 conducts more than D1, and the result is negative dc control voltage across C4 for the horizontal oscillator.
As a result, the sync discriminator continuously measures the frequency difference between the sync and sawtooth waves to produce the dc correction voltage that locks in the horizontal oscillator at the synchronizing frequency.
Single-ended sync discriminator. The AFC circuit in Fig. 16-21 does not require push-pull sync input. Instead, negative sync voltage is coupled by C, to the common cathode of the two diodes D1 and D2. Effectively, the diodes are in parallel for the sync input, as shown in b. The R,C, coupling circuit provides negative sync voltage across R, for D1. Similarly, R2C1 couples sync voltage for D2. The top end of R 2 is re turned to ground through the series combination of C3 and C4.
Sawtooth voltage is also coupled to the diodes, to compare the oscillator frequency with sync. As shown in c, the sawtooth voltage coupled by C, is applied across the two diodes in series. Therefore, each diode has one-half the sawtooth input voltage.
Notice that the sawtooth voltage is applied anode to cathode for D2 but cathode to anode for Dl. Let us consider the sawtooth as cathode-to-anode voltage for D2 the same way sync is applied to both diodes. Then the saw tooth voltage for D2 can be shown inverted, for the discriminator waveshapes in Fig. 16-22. In effect, the two diodes have equal and opposite sawtooth input voltages. Notice that this circuit has push-pull sawtooth input, compared with push-pull sync input for the discriminator in Fig. 16-19.
The negative sync voltage input at the cathode, combined with sawtooth voltage input, makes the diodes conduct. Both i, and i, are shown as electron flow in Fig. 16-21, opposite from the direction of the arrow in each diode.
When D1 conducts, the result is dc voltage V, across R, with the polarity shown in a. Similarly, conduction in D2 results in the dc voltage V, shown across R,. For electron flow, the direction is the opposite of hole current, but the polarities of V, and V, are still the same.
The dc control voltage, taken from point C with respect to ground, consists of V, and V2 in series opposition. When the two voltages are equal, the net output at C is zero. When V2 is larger than V _p negative output voltage results, but when V, is larger, the control voltage is positive. The dc control voltage is filtered by R,C, for the horizontal oscillator.
Summarizing the functions of the components in Fig. 16-21a, R, and R, are diode load resistors. C, is the coupling capacitor for negative sync input to both diodes in parallel. The anode of D2 is returned to chassis ground through C, and C4 in series. Also, C., is needed for a ground return without shorting B+ of the tube supplying sawtooth voltage. C„ couples sawtooth voltage input to the two diodes in series, without shorting the dc control voltage.
C2 equalizes the amount of sawtooth voltage across the diodes. In order to help balance the input to the diodes, C, is larger than ^, but smaller than the series combination of C„ and C,. Finally, R, can be smaller than R _p but proportioned to compensate for unbalance in the diode circuits.
FIGURE 16-22 WAVESHAPES FOR SINGLE-ENDED SYNC DISCRIMI NATOR IN FIG. 16-21
VOLTAGES e, , ARE SHOWN WITH POLARITY AT CATHODE WITH RESPECT TO ANODE. (a)
NORMAL CONTROL. OSCILLATOR AT 15,750 Hz. (b) OSCILLATOR TOO FAST. (c) OSCILLATOR
TOO SLOW.
Because of unbalance in the single ended discriminator circuit, the dc control voltage is 1 to 2 V when the horizontal oscillator is on frequency at 15,750 Hz. This voltage can vary between +6 and -6 V, approximately, to correct the oscillator frequency.
Filtering the dc control voltage. The RC time constant of the integrating filter determines how fast the dc control voltage can change its amplitude to correct the oscillator frequency. A time constant much longer than 63.5 ps is needed for the shunt capacitor to bypass the horizontal sync and sawtooth components in the control circuit, while filtering out noise pulses. However, the oscillator should be able to pull into sync within a fraction of a second when sync is temporarily lost in changing channels. Also, if the time constant is too long, the dc control voltage may be affected by vertical sync, causing bend at the top of the picture. A typical value for the AFC filter time constant is approximately 0.005 S. This time includes about 80 horizontal scanning lines.
Hunting in the AFC circuit. The shunt capacitor in the filter introduces time delay in the effect of dc control voltage on oscillator frequency. The reason is that the output filter capacitor takes time to charge to the applied dc control voltage from the AFC circuit, or discharge down to a lower voltage. As a result, the filtered voltage is still correcting the oscillator after it has been pulled in to the correct frequency. Each succeeding step of overcorrection is less until, finally, the oscillator operates at 15,750 Hz. This action of the control circuit in varying the oscillator frequency within a smaller and smaller range around the correct frequency is called hunting.
Excessive hunting in the AFC circuit can cause scalloped edges in the picture, generally called piecrust or gear-tooth effect (Fig. 16-23). In order to prevent hunting, a double-section filter is commonly used for the dc control voltage, as shown in Fig. 16-24. The R,C, time constant of 0.005 s is long enough to filter out noise and horizontal sync or deflection voltages.
The relatively low resistance of R, serves as a damping resistor across C _p making the output voltage more resistive and less capacitive to reduce time delay in the control voltage. C2 blocks the dc control voltage from shorting to chassis ground.
Dc control stage. In some AFC circuits, the dc correction voltage is amplified and then connected to the horizontal oscillator (Fig. 16-25). Several uses for such a dc amplifier include: (1) amplify the dc correction voltage from the sync discriminator for better control of the horizontal oscillator; (2) dc control tube for a blocking oscillator; (3) reactance tube for a sine-wave oscillator, called synchro-lock AFC.
FIGURE 16-23 THE GEAR-TOOTH OR PIECRUST EFFECT IN PICTURE CAUSED BY HUNTING
IN HORIZONTAL AFC CIRCUIT.
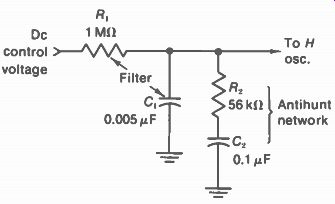
FIGURE 16-24 AFC FILTER WITH ANTIHUNT NETWORK R,C2 ACROSS FILTER CAPACITOR
C,.

FIGURE 16-25 VOLTAGE DC AMPLIFIER FOR AFC CORRECTION
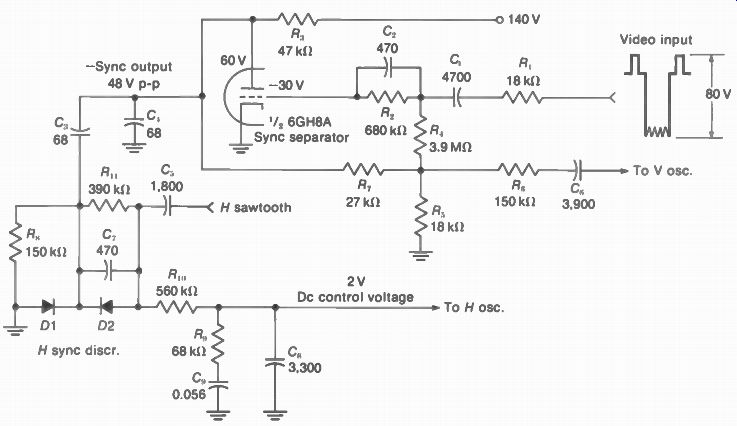
FIGURE 16-26 TRIODE SYNC SEPARATOR CIRCUIT WITH SINGLE-ENDED SYNC DISCRIMI
NATOR. R VALUES IN OHMS. C VALUES MORE THAN 1 IN pF OR LESS THAN 1 IN µF.
16-7 Sync Separator Circuits
The RC-coupled amplifier is generally used with a resistance plate load of about 50 k-ohm for tubes or 1.5 k-ohm for transistors. Peaking coils may be needed to boost the high-frequency response, for sharp edges on the sync pulses. Signal bias for the input circuit clamps the tip of sync at the desired level for clipping the pulses. The required polarity of the video input signal has positive sync for a tube or an NPN transistor, with negative sync polarity for the input to a PNP transistor. A diode may be used as a clipper, for a noise switch, or to block the wrong polarity of collector voltage on a transistor stage.
Triode separator with single-ended sync discriminator. In Fig. 16-26, composite video with positive sync polarity is coupled from the output of the video amplifier to the input of the triode sync separator. The 47-k-ohm R3 is the plate-load resistor that develops clipped sync of negative polarity. The sync output is coupled by C. to the integrator for the vertical deflection oscillator.
In a separate path, the sync output is also coupled by C, to the sync discriminator with diodes D1 and D2. The filtered dc control voltage in the output is directly connected to the horizontal deflection oscillator to control its frequency.
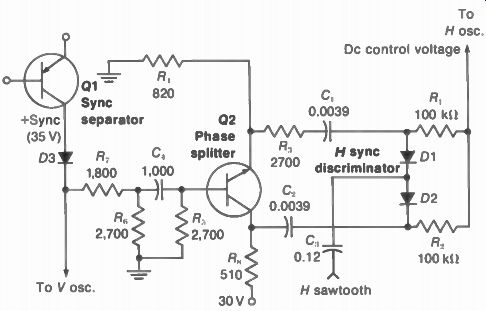
FIGURE 16-27 TRANSISTOR SYNC PHASE SPLITTER FOR PUSH-PULL DISCRIMINATOR.
R VALUES IN OHMS. C VALUES MORE THAN 1 IN pF OR LESS THAN 1 IN AF.
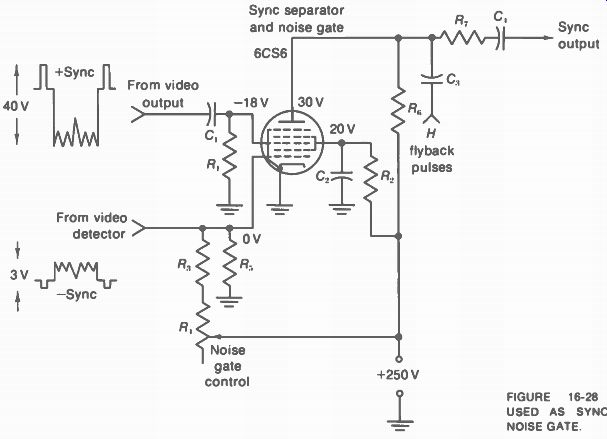
FIGURE 16-28 PENTAGRID TUBE USED AS SYNC SEPARATOR AND NOISE GATE.
In the input to the sync separator, C, is the coupling capacitor, with R, and R, the grid resistance. R, is a decoupling resistance to isolate the sync input circuit from the video amplifier.
The R2C2 combination in the grid circuit provides a short time constant to prevent noise setup in the bias voltage. Note the dc grid voltage of -30 V. This value is the net voltage resulting from the negative grid-leak bias and some positive voltage from the R7R5 divider.
In the single-ended sync discriminator, horizontal sync voltage of negative polarity is coupled by C3 to the common cathodes of D1 and D2. The bypass C, filters out noise. R, is the load resistor for D1, with R„ the load resistor for D2. Sawtooth voltage as a sample of the horizontal oscillator frequency is coupled by C, into the discriminator. C7 helps balance the diode voltages. The dc output is taken from the anode of D2 with 1310 and C„ as the filter to remove noise and sync from the dc control voltage for the horizontal oscillator. C, with R, form the antihunt network. The normal value of dc control voltage is 2 V from the unbalanced discriminator, with the oscillator on frequency at 15,750 Hz.
Phase splitter for push-pull sync discriminator. In Fig. 16-27, the clipped sync output from Q1 is coupled to the phase splitter Q2.
Note that Q1 is a PNP transistor, which requires negative sync for the video input to produce positive clipped sync in the collector output.
The phase splitter Q2 is an NPN transistor, however. Output is taken from both the emitter and collector. The collector, shown at the bottom, has a supply voltage of 30 V. with the 510 12 of R„ as the collector load resistance. In the emitter circuit, the 820 ohm of R, is the load.
R, and R, provide push-pull sync voltage output to the balanced sync discriminator using diodes 01 and D2. With positive sync into the base of Q2, the collector signal is negative sync coupled by C2 to the D2 cathode, while the emitter signal is positive sync coupled by C, to the 01 anode. R, helps balance the input to the two diodes.
In the coupling between D1 and D2, sync for the vertical oscillator is taken from the junction of R, and diode D3. R1 isolates the vertical oscillator from D2. The diode D3 blocks any positive voltage spikes from the vertical oscillator into D1, which requires negative collector voltage because it is a PNP transistor. C4 couples horizontal sync to the phase splitter.
In the sync discriminator, R1 and R2 are the balanced load resistors for D1 and D2. Saw tooth input as a sample of the oscillator frequency is coupled by C3 to the common anode-cathode junction of the diodes. The balanced output from the junction of R1 and R2 is the dc control voltage for the horizontal oscillator. The normal value of dc control voltage is zero from the balanced discriminator, with the oscillator on frequency at 15,750 Hz. Although not shown here, an RC filter and antihunt network are needed for the dc control voltage.
Penta grid sync separator and noise gate. The circuit in Fig. 16-28 uses a tube having two control grids with sharp cutoff. The first grid next to the cathode is one control grid and the other is grid 3. Grids 2 and 4 are connected internally to serve as a screen grid, and grid 5 is the suppressor. Cutoff for each control grid is approximately -2 V. It is important to note that either control grid can cut off plate current. We can consider this a gated circuit, therefore. Both control-grid gates must be on to produce output in the plate circuit.
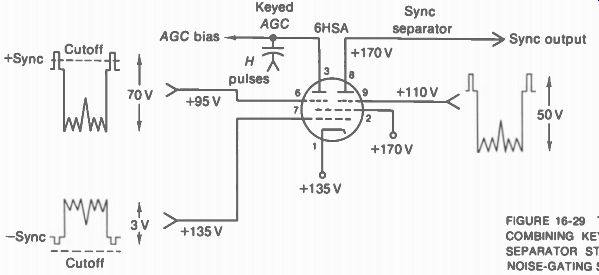
FIGURE 16-29 TWIN-PENTODE TUBE COMBINING KEYED AGC AND SYNC SEPARATOR STAGES.
BOTH HAVE NOISE-GATING SIGNAL AT GRID PIN 7.
Video signal is applied to each control grid. Grid 3 has 40 V of composite video signal to allow clipping the sync voltage. Grid 1 has 3 V of video signal of opposite polarity, to serve as a noise gate. Negative noise pulses at this grid can cut off plate current, reducing noise voltages in the sync output.
For grid 3, composite video signal with positive sync polarity from the plate of the video amplifier is coupled by C, and R,. The negative grid-leak bias allows only the peak positive sync voltage to produce plate current. The result is separated sync output across the plate load resistor R6. The sync amplitude in the output is about 25 V peak-to-peak.
Grid 1 has composite video signal of low amplitude, with negative sync polarity, from the video detector. The bias on grid 1 is set by R, to allow sync voltage for normal signal to remain less negative than cutoff. This adjustment allows plate current to flow for producing separated sync output from the signal at grid 3. However, high-amplitude noise pulses can drive the grid 1 voltage more negative than cutoff. For the noise, then, plate current is cut off. As a result, noise pulses in the composite video signal input are not present in the separated sync output.
The noise-gate control R, can be set approximately by adjusting to the point where the picture is out of sync for strong signal, and then back off just enough for normal sync.
Sync separator and gated AGC. The noise gating function can also be helpful in reducing the effects of noise in the automatic gain control circuit of the receiver. Therefore, special tubes are manufactured to combine the keyed AGC stage and sync separator stage with a noise-gate circuit common to both. These tubes are twin sharp-cutoff pentodes, as shown in Fig. 16-29.
The cathode is common to both sections; grid 1 serves as a noise gate for both the sync separator and AGC stages; grid 2 is a common screen grid. Grid 3 in each section is an individual control grid, and there are two plates for separated sync output from one pentode unit and AGC voltage from the other. The sync separator circuit is the same as in Fig. 16-28, and the keyed AGC circuit is the same as explained previously for Fig. 15-9.
Note the dc voltages in Fig. 16-29. Pin 6 is at +95 V because of dc coupling to the video amplifier plate. The cathode is at +135 V to make the grid bias at pin 6 equal to 95 - 135 = -40 V, for the AGC grid. Pin 7 is also at +135 V making the grid-cathode bias zero for the noise-gate video signal voltage, at the common control grid. However, this grid voltage can be varied slightly by the noise-gate adjustment. The plate of the AGC section is keyed into conduction by horizontal flyback pulses. In the separator, its plate is at 170 V to provide 170 - 135 = 35 V from plate to cathode. The screen grid has the same voltage. Pin 9 at +110 V has grid-cathode bias equal to 110 - 135 = - 25 V for the sync separator grid.
16-8 Phasing between Horizontal Blanking and Flyback
While the deflection circuits are scanning the raster, the composite video signal is varying the intensity of the electron scanning beam. The blanking on the picture tube screen has the timing of the sync and blanking pulses in the trans mitted signal, but the flyback is determined by the deflection circuits in the receiver. In a triggered system, the synchronized flyback starts during blanking time automatically because each sync pulse begins the retrace. With AFC, however, the horizontal oscillator produces scanning independently of individual synchronizing pulses. In fact, horizontal retrace can start with the front porch of blanking, allowing more time for flyback within blanking In Fig. 16-30 normal phasing of the fly back within blanking time is shown in a. It should be noted that a small change of phasing can put more or less blanking at the left and right edges of the raster. This is why the horizontal centering of the picture usually shifts with respect to the raster when the hold control is varied.
The other examples in Fig. 16-30 illustrate incorrect phasing between blanking and horizontal flyback. This occurs because the AFC circuit can lock in the oscillator at 15,750 but with retraces not completely within blanking.
Then some picture information may be reproduced during flyback time. In b, horizontal flyback starts just before blanking. Then some of the picture information that should be at the extreme right side of the trace in the picture is reproduced during the flyback to the left. With picture information reproduced during both re trace and trace at the right, this side can appear folded over or under itself, usually brighter than normal.
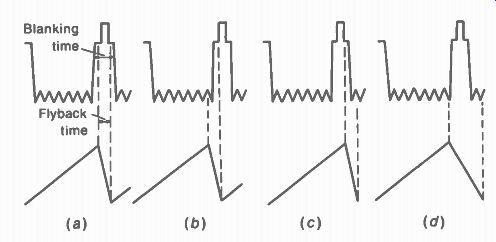
FIGURE 16-30 PHASING OF HORIZONTAL BLANKING AND FLYBACK. (a)
NORMAL FLYBACK WITHIN BLANKING TIME (b) FLYBACK STARTS TOO SOON. (c) FLYBACK STARTS LATE (d) FLYBACK TIME IS TOO LONG
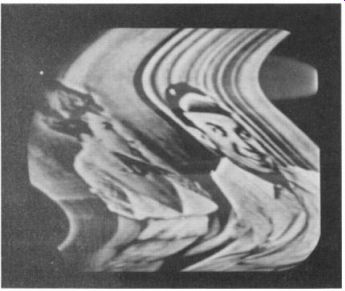
FIGURE 16-31 BEND IN PICTURE. BUT NOT IN RASTER. CAUSED BY 60-Hz HUM IN THE
HORIZONTAL SYNC. NOTE WHITE SPEAR AT TOP RIGHT, PRODUCED BY WHITE PICTURE
INFORMATION IN FLYBACK TIME.
When the horizontal flyback starts too late after blanking, as in c, the retrace cannot be completed before picture information starts for the trace at the left side of the next line. Then the left side of the picture appears folded. If the horizontal retrace time is too long, as in d, the flyback can start before blanking but still continue after blanking. Then both the left and right sides of the picture may be folded.
Whenever the flyback occurs during picture information time, there may be a light haze in the background, pointing outward from either side of the picture, like a big spear. This is white picture information spread out by fast flyback, instead of being reproduced correctly during trace time. The picture usually has this effect just before horizontal hold is lost. As an example, note the white haze in Fig. 16-31 extending out from the right side of the picture near the top. The bend in the picture is caused by 60-Hz hum in the horizontal sync.
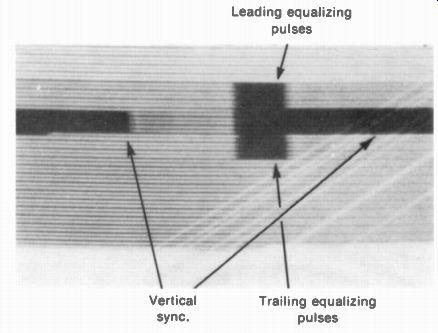
FIGURE 16-32 HAMMERHEAD PATTERN ON PICTURE TUBE SCREEN SHOWING VERTICAL SYNC
PULSES WITH ITS SERRATIONS AND THE EQUALIZING PULSES. WITHIN THE VERTICAL
BLANKING TIME (RCA)
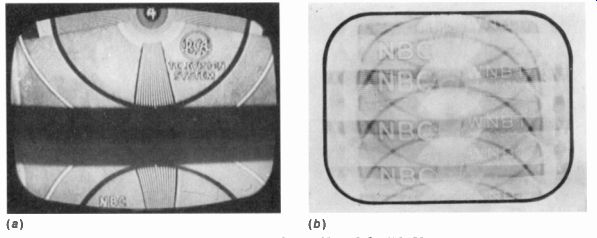
16-9 Sync and Blanking Bars on the Screen
The entire composite video signal with sync and blanking pulses is coupled to the picture tube.
Therefore, amplitude variations of the sync and blanking pulses can be seen as relative intensities on the picture tube screen (Fig. 16-32). This can be seen by varying the vertical hold control to allow the picture to roll slowly, out of sync, so that the vertical blanking bar is in the middle of the picture instead of at the top and bottom.
Brightness is turned up higher than normal to make the blanking level gray instead of black.
The sync amplitude, which is 25 percent above the blanking level, then becomes black.
The black bar within the vertical blanking in Fig. 16-32 is often described as the "hammerhead" pattern. It shows the equalizing and vertical sync pulses occurring during vertical blanking time. The black hammerhead is produced by the equalizing pulses at the head and the vertical pulses for the handle. There are really two hammerheads, but one head is lost in flyback time.
The appearance of the horizontal sync within the horizontal blanking bar on the picture tube screen is shown in Fig. 16-33. This can be seen by adjusting the phasing of the horizontal deflection oscillator to put the horizontal blanking bar in the picture, with the brightness higher than normal. Normally the sync and blanking bars are at the edges of the picture behind the mask of the screen and are not visible.
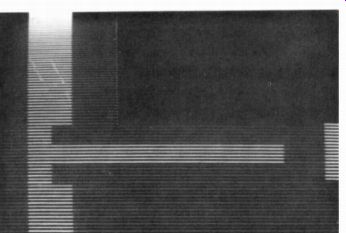
FIGURE 16-33 HORIZONTAL SYNC AND BLANKING BARS ON PICTURE TUBE SCREEN. THE
INTERSECTION IS A PULSE-CROSS DISPLAY. (RCA)
The intersection of the horizontal and vertical black bars in Fig. 16-33 is called a pulse cross display. The bars can be examined to check the sync voltage. It should be blacker than blanking and the darkest parts of the picture. Normal bars on the screen show normal sync voltage in the composite video signal input to the sync separator. If the sync is not blacker than blanking, this indicates compression of the sync pulses in the video or IF section.
16-10 Sync Troubles
Vertical rolling and a picture in diagonal segments show there is no synchronization of the vertical and horizontal deflection oscillators.
When both occur at the same time, the trouble is in the sync separator circuits, as both the vertical and horizontal sync are missing. You can tell if the picture is rolling vertically, even with diagonal bars, by watching the horizontal black bar across the screen produced by vertical blanking.
When the whole picture rolls up or down, the trouble is just vertical synchronization, as the horizontal AFC is holding the picture together. When the picture is in diagonal bars, without vertical rolling, the trouble is just the horizontal synchronization.
It is important to remember that the sync is part of the signal and, therefore, that the receiver must have enough signal to provide a good picture for good synchronization. When the signal is weak, the sync is weak also. Then noise voltages can easily interrupt the synchronization. In addition, hum in the receiver can easily affect weak sync, especially for triggering the vertical oscillator.
No vertical hold. Vertical rolling of the picture, as shown in Fig. 16-1, means no vertical synchronization. Generally, the circuits for vertical sync alone are just the RC integrator and the vertical oscillator. There is seldom any trouble with the RC integrator, however. Vertical rolling, then, is usually a trouble in the vertical oscillator. With tubes, the first step is to try a new tube for this stage. With transistors, the isolation diode for the vertical oscillator can cause troubles. For tubes and transistors, poor low frequency response in the video amplifier caused by a defective bypass capacitor can cause weak vertical sync.
In order to hold an oscillator synchronized, not only is sync voltage necessary, but the oscillator frequency must also be close to the sync frequency. To check whether a trouble of rolling picture is caused by no sync or incorrect oscillator frequency, vary the vertical hold control. The important thing to see is whether the picture can be made to roll both up and down.
If it does, this shows the oscillator can be set to the correct frequency. The trouble, then, is in the vertical sync. If not, the trouble is incorrect oscillator frequency. For deflection oscillator circuits, the RC values in the coupling circuits are the main factors in determining the frequency.
No horizontal hold. The picture tears apart in diagonal segments, as shown in Fig. 16-2.
Again the trouble can be in either the oscillator or the sync. In this case, though, there is the horizontal AFC stage for horizontal sync alone.
Vary the horizontal oscillator frequency to see if a whole picture can be produced. If not, the trouble is incorrect oscillator frequency. When a whole picture can be produced but it does not stay still horizontally, the trouble is usually in the horizontal AFC. A common trouble is a defective diode, which changes the dc control voltage.
Poor interlace. Inaccurate timing of the vertical scanning in even and odd fields causes poor interlacing of the scanning lines. The result is partial pairing or complete pairing, which reduces the detail in the picture. Stray pickup of pulses generated by the receiver's horizontal deflection circuits and coupled into the vertical sync and deflection circuits can cause interlace troubles.
Hum in the sync. Excessive hum in the horizontal sync produces bend in the picture as shown in Fig. 16-31. The hum in the sync bends the picture, but the edge of the raster is straight.
This shows that the hum is in the horizontal sync but not in the raster circuits.
With excessive hum in the vertical sync, the picture tends to show the vertical blanking bar across the middle of the picture, as in Fig. 16-1a, drifting slowly upward on the screen. Especially with weak signal, the oscillator can easily be triggered by 60-Hz hum voltage instead of vertical sync.
SUMMARY
1. The synchronizing pulses time the receiver scanning to make the reproduced picture hold still on the raster. Without vertical hold the picture rolls up or down.
Without horizontal hold, the picture is torn apart with diagonal black bars.
2. The sync separator clips the sync voltage from the composite video signal. Then the integrator filters out all but the vertical sync voltage, which triggers the vertical deflection oscillator at 60 Hz. Also, the horizontal sync is coupled to the AFC circuit to control the frequency of the horizontal deflection oscillator.
3. The RC integrator for vertical sync has a time constant very long for the horizontal pulse width but not for the vertical pulses. This is the vertical sync section of the receiver.
4. Noise in the sync can cause loss of synchronization, especially with weak signal.
5. A noise gate or switch cuts off the sync separator for noise pulses.
6. A common circuit for the sync separator uses a triode tube or transistor with signal bias beyond cutoff (Fig. 16-26).
7. Another common circuit is the gated sync separator. Either a pentagrid tube can be used, as in Fig. 16-28, or a twin pentode combining the sync separator and AGC stages, as in Fig. 16-29.
8. When the picture rolls vertically but it can be stopped temporarily with the hold control, this means no vertical synchronization. Check the integrator and vertical oscillator.
9. If varying the horizontal oscillator frequency control can produce a picture but it drifts into diagonal bars, this means no horizontal hold. Check the horizontal AFC circuit.
10. When the picture has normal contrast but it rolls vertically and tears horizontally on all channels, the trouble is no sync. Check the sync separator and amplifier stages.
11. Hum in the horizontal sync can cause sine-wave bend from top to bottom of the picture, as in Fig. 16-31. With hum in the vertical sync, the blanking bar drifts slowly from bottom to top of the picture. See Fig. 16-1a.
12. Automatic frequency control is used to lock in the horizontal deflection oscillator at 15,750 Hz. The AFC circuit compares the oscillator frequency with the sync frequency to produce dc output voltage proportional to their difference. This is the horizontal sync section of the receiver.
13. With a dual-diode sync discriminator for the horizontal AFC circuit, each diode has sync input and sawtooth voltage that indicates oscillator frequency. The dc output from two diodes measures any difference between the sync and scanning frequencies to hold the oscillator locked in at 15,750 Hz.
14. The time constant for the AFC filter is about 0.005 s to filter noise but allow fast lock-in when changing channels.
15. Overcorrection of the oscillator frequency can cause hunting in the AFC circuit.
In the picture, the result is piecrust or gear tooth effect (Fig. 16-23). A series RC combination is usually connected across the AFC filter capacitor as an antihunt network.
16. With horizontal AFC, picture information may be reproduced during horizontal retrace time. This effect can cause a white haze in the background corresponding to white picture information spread out by the fast flyback (Fig. 16-31).
Self-Examination (Answers at back of guide)
Answer True or False.
1. Without vertical sync, the bar produced by vertical blanking rolls up or down the screen.
2. The diagonal black bars resulting from no horizontal hold are produced by horizontal blanking.
3. The integrated vertical sync voltage triggers the vertical deflection oscillator.
4. The horizontal deflection oscillator frequency is controlled by an AFC circuit.
5. A grid-leak bias sync separator requires composite video signal with positive sync polarity at the grid.
6. Signal bias is reverse dc voltage proportional to the input voltage.
7. When a noise pulse triggers the vertical oscillator, the picture can roll out of sync.
8. Video signal voltage at the picture tube grid is about 3 V peak-to-peak.
9. The hammerhead pattern in Fig. 16-32 is a reproduction of the serrated vertical sync and equalizing pulses.
10. If the sync separator stage does not function, the picture will roll vertically and have diagonal bars at the same time.
11. Negative signal bias at the base of an NPN transistor is reverse voltage.
12. Weak picture signal can cause poor vertical and horizontal synchronization.
13. In Fig. 16-26, the diodes D1 and D2 form an unbalanced sync discriminator with negative sync voltage input.
14. In Fig. 16-27, the output at the collector of phase splitter Q2 is negative sync for the cathode of diode D2.
15. The dc output of the sync discriminator stage is directly coupled to the horizontal deflection oscillator.
16. Hunting in the sync discriminator stage causes a rolling picture.
17. In Fig. 16-27, if diode Olin the sync discriminator is defective, the picture will have diagonal bars.
18. Figure 16-31 shows 60-Hz hum in the horizontal sync but not in the raster.
19. The horizontal AFC is the only part of the receiver circuits operating just for horizontal sync.
20. The output from the RC integrator for vertical sync is a dc control voltage directly coupled to the vertical deflection oscillator.
Essay Questions
1. Give the specific function for the horizontal sync pulses, vertical pulses, and the equalizing pulses.
2. Describe briefly the sequence of separating the sync from the composite video signal to time the frequency of the vertical and horizontal deflection oscillators.
3. Give the function of the RC integrator for vertical sync.
4. Give the function of the horizontal AFC circuit.
5. Draw the diagram of a sync separator stage with grid-leak bias using a triode tube. Show input and output waveshapes.
6. (a) Do the same as in Question 5 for an NPN transistor. (b) Do the same with a PNP transistor.
7. Give two reasons for vertical rolling in the picture.
8. Give two reasons for diagonal bars in the picture.
9. In Fig. 16-26, give the function for C _p R„, C„, and C„.
10. In Fig. 16-27 give the function for R _p R„, C _p and C.
11. For the gated sync separator in Fig. 16-28, what input signals are applied to the two grids?
12. In Fig. 16-28, if the screen bypass C„ is shorted, what will be the effect in the picture?
13. What is the hammerhead pattern on the screen of the picture tube?
14. What is the pulse-cross display on the screen of the picture tube?
15. Describe briefly the difference between triggered sync and AFC.
16. Name the three input voltages to the push-pull horizontal sync discriminator in Fig. 16-19.
17. Name the two input voltages to the single-ended horizontal sync discriminator in Fig. 16-21.
18. In the balanced sync discriminator in Fig. 16-19, give the function for C _p R _p C 2, R2, R4, and C4.
19. In the unbalanced sync discriminator in Fig. 16-21 (a) Give the function for C _p R _p and R . (b) Why will the diodes D1 and D2 not conduct if the sync input has positive polarity?
20. (a) What is meant by hunting in the AFC circuit? (b) What is the effect in the picture? (c) What components form the antihunt network in Fig. 16-26? (d) Show where to add a filter and antihunt network for the sync discriminator output voltage in Fig. 16-27.
21. If C„ in Fig. 16-12 opens, why will the result be more vertical sync voltage?
22. Give the effect on the raster and picture for the following troubles in Fig. 16-26: (a) R„ open; (b) C„ open; (c) C„ open; (d) C, shorted.
23. Give the effect on the raster and picture for the following troubles in Fig. 16-27: (a) open collector in D2; (b) shorted junction in D1; (c) open diode D2.
24. Give two effects in the picture when 60-Hz hum is ii the video signal for the picture tube and in the horizontal sync.
Problems
1. Calculate the time constant for each RC section of the vertical integrator in Fig. 16-12, with R of 10 k O and C of 0.005 µF.
2. Calculate the time constant of the RC coupling circuits in Fig. 16-5a, b, and c.
3. A grid-leak bias circuit has 0.05-µF C and 2-M-o R. (a) Calculate the time constant.
(b) After C has been charged, how long will it take to discharge down to one-half of its voltage? (c) To 37 percent? (d) To zero? (Hint: See universal RC curve in Appendix D.)
4. A picture is out of horizontal hold with six diagonal bars. How far off is the oscillator frequency from 15,750 Hz?