.
Troubles in the raster, such as insufficient height or width, show in the picture also, as the picture can be considered as an overlay on the raster. The scanning circuits produce the raster. Then the video signal reproduces the picture information. Trouble in the raster circuits, therefore, will be evident even without a picture on the screen. In general, problems with size or shape are raster troubles. The raster circuits include the vertical and horizontal deflection circuits, with the common deflection yoke for scanning, as shown in Fig. 19-1. The sync circuits hold the picture still on the raster. Problems of picture quality, including interference, are troubles in the signal.
More details are described in the following topics:
19-1 Raster circuits
19-2 Troubles in height and width
19-3 No brightness
19-4 Picture troubles
19-5 Bars in the picture
19-6 Sound in the picture
19-7 Ghosts in the picture
19-8 Interference
19-9 Hum troubles
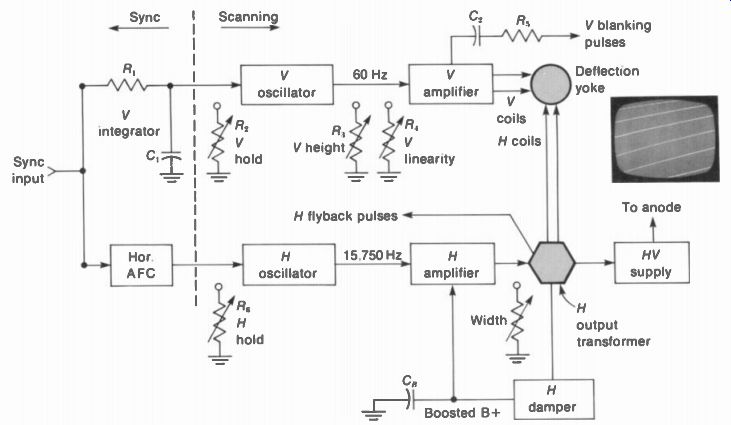
FIGURE 19-1 BLOCK DIAGRAM OF RASTER CIRCUITS.
19-1 Raster Circuits
The block diagram in Fig. 19-1 illustrates the stages for vertical and horizontal scanning. For vertical deflection, only a vertical oscillator operating at 60 Hz and the amplifier are necessary. The output stage is similar to a class A amplifier to supply enough sawtooth scanning current in the yoke. With tubes, the vertical oscillator and amplifier are usually combined in just one stage.
The horizontal circuits are more complicated because they include the damper stage and flyback high-voltage rectifier, in addition to the oscillator operating at 15,750 Hz which drives the output stage. The horizontal amplifier is always a separate stage because of its power requirements. It is a class C pulse amplifier, operating with the damper for more efficient scanning. In effect, the horizontal output stage serves as a switch that is pulsed into saturation output current. With transistors, a buffer amplifier is generally used to isolate the oscillator from the output stage, for both the vertical and horizontal deflection circuits.
Vertical scanning circuits. The vertical oscillator is triggered by vertical sync pulses to lock in at 60 Hz. This stage is either a multivibrator or a blocking oscillator. It produces sawtooth voltage output to drive the vertical amplifier that supplies the sawtooth current in the yoke. Note that flyback pulses are coupled to the picture tube to blank out vertical retrace lines.
The controls in the vertical deflection circuits include the height and linearity adjustments. These are on the back of the receiver chassis. Normally, they can be adjusted so that the raster fills the screen top to bottom, with equally spaced scanning lines. In addition, the vertical hold control adjusts the frequency just below 60 Hz to allow each vertical sync pulse to trigger the oscillator and hold it at the vertical scanning frequency.
Horizontal scanning circuit. The horizontal oscillator also is generally a multivibrator or blocking oscillator. However, the frequency is held at 15,750 Hz by the AFC circuit, instead of triggered sync. The oscillator drives the horizontal amplifier with its output transformer, often called the flyback transformer. The functions of the horizontal output circuit include supplying the following:
1. Horizontal scanning current in the horizontal deflection coils of the yoke.
2. Input to the high-voltage rectifier for anode voltage on the picture tube.
3. Input to the horizontal damper. This stage damps oscillations or ripples in the horizontal scanning current that occur just after flyback. In addition, the damper operates in conjunction with the horizontal amplifier to provide full cycles of horizontal scanning current. The damper scans the left side of the raster, about one-third to one-half the way across, and the amplifier finishes the traces to the right edge.
In addition, the damper serves as a rectifier to add dc voltage to the B+ supply. For example, with 140 V for B+, the damper can add 250 V. for a total of 390 V. This is called boosted B+ voltage. It is used for plate voltage on the horizontal and vertical amplifier tubes, for screen-grid voltage on the picture tube, and for other tubes requiring a high B+ voltage. The boost voltage is developed across capacitor C1 , in Fig. 19-1. The presence of the boosted B+ voltage shows that the damper is operating normally.
The horizontal output transformer generally has voltage taps or extra windings to supply flyback pulses for some stages in the signal circuits. Their function is to key on the stage just during horizontal retrace time. Two examples are keying pulses for the AGC stage and keying pulses for the burst separator in color receivers.
The horizontal hold control can be in either the oscillator or the AFC circuit. If there is a width control, it often varies the screen-grid voltage on the horizontal output tube. There are few, if any, controls to adjust width and linearity, because the horizontal output circuit is de signed for maximum efficiency in scanning and high voltage.
19-2 Troubles in Height and Width
When the raster does not have enough height, it looks like Fig. 19-2. The black bars at the top and bottom are the unused screen areas not scanned. This means that the sawtooth current in the vertical deflection coils does not have enough peak-to-peak amplitude to scan the full height of the raster. Assuming that the vertical height and linearity controls cannot be adjusted to fill the screen, insufficient height usually means trouble in the vertical output stage. If this is a tube, try a new one. The vertical oscillator is necessary for deflection, but it usually does not cause weak output because its only function is to drive the amplifier.
In many cases, the full height can be obtained only with poor linearity. The extreme case of vertical nonlinearity is a white bar at the bottom or top, caused by foldover of the scan- fling lines. The vertical nonlinearity is really an example of weak output, as too much drive is used on the vertical amplifier.
If there is no vertical output at all, the result is just a horizontal line across the center (Fig. 19-3). No vertical deflection means no output, either from the oscillator or from the amplifier.
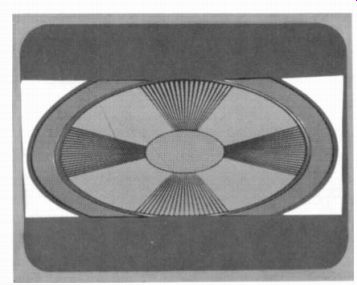
FIGURE 19-2 INSUFFICIENT HEIGHT IN RASTER AND PICTURE
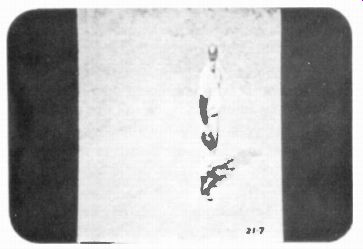
FIGURE 19-4 INSUFFICIENT WIDTH IN RASTER AND PICTURE.
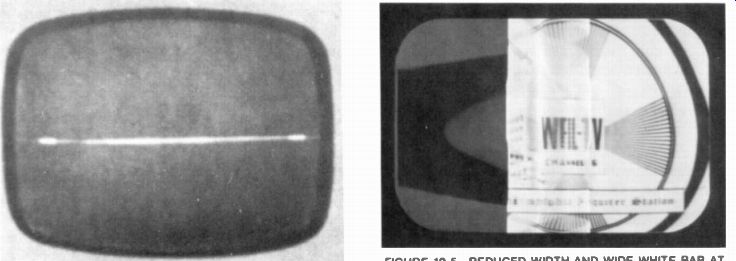
FIGURE 19-3 NO HEIGHT.

FIGURE 19-5 REDUCED WIDTH AND WIDE WHITE BAR AT LEFT. CAUSED BY OPEN B 4
BOOST CAPACITOR
Width troubles in the horizontal scanning are usually associated with the output stage and damper. When the whole raster is narrow, with out any vertical white bars at the left side, this indicates weak horizontal output (Fig. 19-4). How ever, when the width is drastically reduced at the left side, with a wide, white bar as in Fig. 19-5, this indicates trouble in the damping circuit.
One very definite trouble is the trapezoidal raster shown in Fig. 19-6. This is caused by a defect in the deflection yoke. The raster can be keystoned either vertically or horizontally. It is important to note that the deflection yoke has the balance in the coils that provides symmetry in the raster. Any trouble that makes the raster unsymmetrical is likely to be the result of a defective yoke.
19-3 No Brightness
This means no light from the screen on the picture tube, not to be confused with no picture on a good raster. Assuming that the low-voltage supply is operating and the sound is normal, no brightness is usually the result of no high voltage for the anode of the picture tube. For flyback high voltage the following circuits must be normal:
1. Horizontal oscillator driving the amplifier
2. Horizontal output stage driving the high voltage rectifier, through the high-voltage winding on the flyback transformer
3. Damper diode operating to produce boosted B+ voltage for the horizontal output stage
To check for high voltage, work backward from the high-voltage rectifier. Check this stage first for dc output to the anode of the picture tube. If the horizontal output is not driving the rectifier with high-voltage ac input, the trouble can be in the amplifier, transformer, or damper.
You can measure the boosted B+ voltage to see if the damper is operating normally. For the last possibility, the horizontal oscillator may not be operating to drive the amplifier.
It is still possible to have no brightness with normal high voltage on the anode. Assuming that the heater of the picture tube is lit, the trouble can be in the electrode voltages. The screen-grid voltage must be normal for there to be beam current. With color picture tubes. there is a separate focus voltage supply. If this voltage is zero or too low, there will not be any beam current. Finally, the grid-cathode bias can cut off the beam current. With cutoff voltage, how ever, you can usually see some afterglow on the screen of the picture tube just after the receiver is turned off. Check for afterglow in a dark room. If you see the afterglow, the picture tube has high voltage on the anode.
In color receivers, the screen can be very dark without Y video signal when there is dc coupling. Then a dc trouble in the Y video output stage changes the grid-cathode bias on the picture tube.
FIGURE 19-6 TRAPEZOIDAL RASTER. CAUSED BY DEFECTIVE YOKE
19-4 Picture Troubles
We consider the picture separate from the raster. The scanning circuits can produce a perfect raster but trouble in the signal circuits still can cause no picture, no color, snow in the picture, or a distorted picture.
No picture. It is useful to check whether the sound is normal. No picture with no sound means there is no signal through the rf tuner and the common IF amplifiers up to the sound take off point. The video detector and video amplifier may also be common to the picture and sound in monochrome receivers. Remember that the AGC circuit can cut off picture and sound by biasing off the rf and IF amplifiers.
Even though there is no picture, turn up the contrast control to see if this produces white speckles of snow on the raster. Actually, the snow is signal from noise generated in the mixer stage. The presence of snow shows that the signal from the mixer is being amplified in the IF and video amplifier. Then the trouble is in the antenna circuit, transmission line, and rf amplifier ahead of the mixer. If there is no snow, the trouble is in the stages after the mixer, including the IF and video stages. It should be noted that when the AGC circuit cuts off the picture, the raster is clean, without snow. When the antenna is not supplying signal, the raster has snow.
Also, there is a loud rushing noise in the sound with the volume at maximum.
If there is no picture but normal sound, the trouble is in the stages after the sound take off circuit. This section usually includes the video detector and video amplifier. In color receivers, if the Y video channel is open, the chroma section can still produce color on the screen of the picture tube.
Snow in the picture. See Fig. 19-7. Usually, the snow is a result of not having enough antenna signal. There may be trouble in the rf amplifier section, or the transmission line from the antenna may be open. A helpful check here is the fact that with an open line the picture is usually better on some channels when only one side of the transmission line is connected.
FIGURE 19-7 SNOWY PICTURE. CAUSED BY WEAK ANTENNA SIGNAL.
Weak picture with low brightness. This is often caused by low emission in an old picture tube. It can be recognized by a silvery bloom in white highlights of the picture, especially when the brightness is increased. This applies to both color and monochrome picture tubes.
No color in the picture. Assuming a normal monochrome picture on a white raster, this trouble means there is no color signal from the chroma section. Likely sources of trouble are the 3.58-MHz chroma amplifier, color oscillator, and burst amplifier stages. More details are given in Section 17.
Picture does not hold still. Vertical rolling is a trouble in the vertical sync or the vertical oscillator, operating at the wrong frequency. Trouble in the horizontal hold, with diagonal bars in the picture, is often caused by defective diodes in the horizontal AFC circuit. When the picture does not hold both vertically and horizontally, the trouble is no output from the sync separator.
Overloaded picture. As shown in Fig. 15-1 and explained in Section 15, overload distortion is usually an AGC trouble. The overload is caused by incorrect bias on the rf and IF amplifiers.
Bend in the picture. The bend is actually a case of weak horizontal synchronization just before the point where the picture tears into diagonal bars. The trouble in the horizontal sync can result from hum, overload distortion, interference, or a defect in the horizontal AFC circuit.
Smear and streaking. See Fig. 19-8. The streaking is especially evident trailing to the right after the edges of numbers or letters in the picture. The trail may be black after white, or the same as the original image. Any motion up or down of the smear and streaks makes this effect very obvious. The cause is phase distortion with time delay for low video frequencies up to about 200 kHz.
FIGURE 19-8 LOW-FREQUENCY SMEAR, WITH STREAKS AFTER LETTERING, CAUSED BY
LEAKY COUPLING CAPACITOR IN VIDEO AMPLIFIER
FIGURE 19-9 MULTIPLE OUTLINES IN PICTURE, CAUSED BY RINGING IN IF AMPLIFIER
The phase distortion is often caused by a leaky or open capacitor used for coupling or to bypass the video signal. Remember that a bypass is only a coupling capacitor to the chassis ground return for signal. In either case, the capacitor is in the signal path. A common example is the ac bypassing for dc voltage in the brightness control circuit. When these capacitors are leaky, they have too little capacitance and too much ac impedance, which changes the response for low video frequencies.
Ringing in the picture. See the multiple out lines in Fig. 19-9. The ringing means there are self-excited oscillations caused by an abrupt change in signal voltage. When the outlines change with the fine tuning control, this means the trouble is in the picture IF amplifier. n the video amplifier, the cause of ringing is excessive high-frequency response. A possible source is an open damping resistor across a series peaking coil.
19-5 Bars in the Picture
The way horizontal and vertical bars are produced on the screen of the picture tube can be illustrated experimentally by using an audio signal generator to supply video signal to the receiver. The variable-frequency generator has a range of 20 Hz to 200 kHz. The transmitted signal is not used. Instead, the output of the signal generator is coupled into the video amplifier, where the signal is amplified for the picture tube. As the generator signal varies the grid cathode voltage of the picture tube, pairs of dark and light bars are formed on the raster (Fig. 19-10). Horizontal bars are produced when the frequency of the signal at the picture tube grid is less than 15,750 Hz; above 15,750 Hz the bars are vertical or diagonal. Since the sync for the deflection oscillators is usually taken from the video amplifier in the receiver, the generator signal also supplies synchronization. The bars can be locked when the generator frequency is an exact multiple of the scanning frequency. Just vary the signal generator frequency to obtain the desired number of bars and adjust the receiver hold control to make the bars stay still.
Horizontal bars. Suppose that a 60-Hz sine wave signal is varying the control-grid voltage in synchronism with the vertical scanning motion at the field frequency of 60 Hz. During the positive half-cycle the signal makes the grid more positive, increasing the beam current and screen illumination. The negative half-cycle reduces the beam current and screen illumination. Since it takes 1 /,2 s for a half-cycle of the 60-Hz signal, the scanning beam moves halfway down the screen during this time. Therefore, if the positive half-cycle of the sine-wave signal coincides with the first half of the vertical scan, the top half of the picture will be brighter than the bottom half. The pattern on the screen then is a pair of horizontal bars, one bright and the other dark.
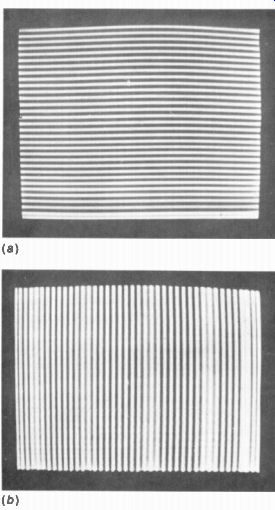
FIGURE 19-10 BAR PATTERNS PRODUCED BY SIGNAL GENERATOR. (a) HORIZONTAL BARS
WHEN FREQUENCY IS BELOW 15,750 Hz: (b) VERTICAL BARS WHEN FREQUENCY IS ABOVE
15,750 Hz.
When the signal generator output frequency is increased to multiples of 60 Hz, additional pairs of narrower horizontal bars will be formed on the screen, as shown in Fig. 19-10a.
The number of pairs of bars is equal to the signal generator frequency divided by the vertical scanning frequency. However, subtract any bars that may be produced during vertical retrace time if the signal frequency is high enough to produce more than about 20 pairs of bars. As an example, a frequency of 240 Hz results in 240/60 = 4 pairs of horizontal bars.
Vertical scanning linearity is indicated by the spacing between the parallel horizontal bars.
If the vertical scanning motion is linear, the bars will be equally spaced. Otherwise, the bars will be spread out or crowded together.
Vertical bars. When the frequency of the modulating signal becomes equal to the horizontal line-scanning frequency, vertical bars are formed instead of horizontal bars. Consider the case of a 15,750-Hz sine-wave signal varying the grid voltage in phase with the horizontal scanning. During one horizontal line the screen is made brighter for approximately one-half the picture width, as the positive half-cycle of the grid voltage increases the beam current; the negative half-cycle makes the screen darker.
The same effect occurs for succeeding horizontal lines, and the result is a pair of vertical bars on the screen, one bar white and the other dark.
If the frequency of the signal generator is increased to multiples of 15,750 Hz, additional pairs of narrower vertical bars will be produced on the screen, as shown in Fig. 19-10b. Their spacing indicates linearity of the horizontal scanning motion.
The number of pairs of vertical bars is equal to the frequency of the applied signal divided by the horizontal scanning frequency.
As an example, a frequency of 157.5 kHz results in 10 pairs of vertical bars. However, not all the bars may be visible. Some are formed during the horizontal retrace time if the signal frequency is high enough to produce more than about 10 pairs of bars. These bars formed during the flyback are wider because of the fast retrace.
They appear as variations of shading in the background, as can be seen in Fig. 19-10b. It is possible to determine the retrace time by counting the bars visible during the trace time and comparing this with the total number that should be produced.
Diagonal bars are produced when the signal frequency is higher than the horizontal line scanning frequency but is not an exact multiple.
In this case, the light and dark parts of each line are regularly displaced in successive order at different positions with respect to the start of the trace, instead of lining up one under the other.
The diagonal bars usually do not stay still because the signal frequency is not an exact multiple and does not synchronize the deflection oscillator.
19-6 Sound in the Picture
There are three types of sound interference: (1) horizontal bars from the audio signal; (2) a fine line pattern from the 4.5-MHz intercarrier sound signal; (3) a 920-kHz diagonal bar pattern as interference between the 4.5-MHz intercarrier sound and the 3.58-MHz color subcarrier. The 920-kHz beat is the most common form in which the sound signal interferes with the picture.
920-kHz beat. This effect can be seen in color plate XIII. The 920 kHz is the difference frequency of 4.5 - 3.58 = 0.92 MHz. With an interfering signal at 920 kHz, the number of bars is 920,000/15,734, which equals approximately 60. Audio sound bars. Slope detection can convert the modulation of the FM sound signal to audio voltage in the video detector output even though the diode is an AM detector. Then the audio combines with the video at the grid-cathode circuit of the picture tube. The result is horizontal bars, as in Fig. 19-11. The sound bars can be recognized, as they vary with the audio modulation and disappear when there is no voice or music.
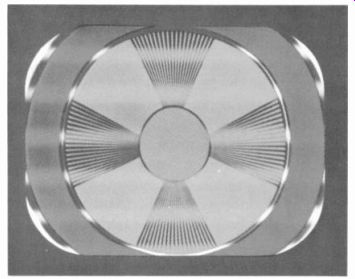
FIGURE 19-11 SOUND BARS IN THE PICTURE. THE WIDTH AND INTENSITY VARY WITH
THE AUDIO MODULATION.
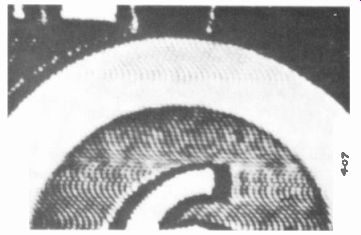
FIGURE 19-12 FINE HERRINGBONE OR "WORMY" EFFECT OF 4.5-MHz BEAT
IN PICTURE 4.5-MHz beat.
This effect is shown in Fig. 19-12. The interference pattern has about 225 pairs of thin black and white lines with small "wiggles" like a herringbone weave. This effect is called a "wormy" picture. The number of pairs of lines equals 4.5 MHz/15,750 Hz, which is approximately 285. The fine lines are caused by the 4.5-MHz carrier, while the herringbone weave is a result of frequency variations in the FM sound signal. When there is no voice or music, the herringbone effect disappears but the thin lines remain because they are produced by the sound carrier.
19-7 Ghosts in the Picture
A duplicate of the reproduced picture, to the side, as in Fig. 19-13, is called a ghost. The multiple pictures are caused by multiple signals.
The main picture is the direct signal received by the antenna from the transmitter. In addition, the antenna can receive signals produced by reflections of the transmitted signal by buildings, bridges, or other large metal structures.
The reflected signal takes longer to reach the receiver than the direct signal. As a result, a multipath signal can produce a ghost a little to the right of the main image. Reducing these ghosts caused by multipath signals is mainly a question of using a directional antenna, which receives signals best through a small angle from the front and very little from the back.
Built-in ghosts. In most cases, the cause of ghosts is an antenna problem. However, multiple images can be produced by either the receiver or a very long transmission line. These built-in ghosts can be recognized by the fact that usually there are three, four, or more images with uniform spacing.
Excessive response for the high video frequencies in the IF amplifier or video amplifier can cause built-in ghosts. These are the same on all channels. If the excessive response is in the picture IF amplifier, varying the fine tuning will affect the ghosts.
Ghosts caused by reflections of the antenna signal in a long transmission line change when hand capacitance is added by holding the line. These ghosts are not the same on all channels.
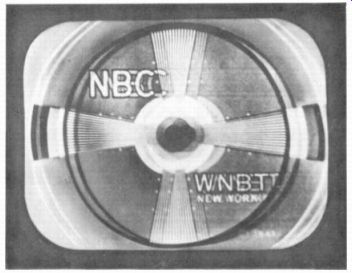
FIGURE 19-13 GHOST CAUSED BY REFLECTED SIGNAL AT ANTENNA.
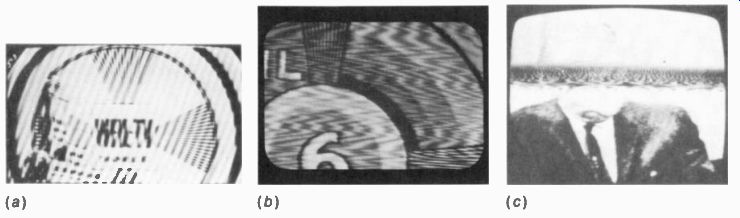
FIGURE 19-14 INTERFERENCE EFFECTS IN THE PICTURE. (a) UNIFORM DIAGONAL BARS
CAUSED BY CW INTERFERENCE: (b)HERRINGBONE WEAVE CAUSED BY FREQUENCY MOD ULATION:
(c) DIATHERMY INTERFERENCE.
Leading and trailing ghosts. A ghost resulting from multipath reception by the antenna is a trailing ghost, to the right of the main image.
However, a leading ghost can be produced to the left of the main image. One cause of leading ghosts is direct pickup of signal, especially in strong signal areas. In this case, the direct pickup can provide a picture before the antenna signal delivered by a long transmission line.
With direct pickup, the ghost will vary when people walk near the receiver.
Eliminating a leading ghost, to the left of the image, is a problem of reducing stray pickup.
Try shielding the transmission line and rf tuner, if necessary, and supplying more signal from the antenna. The antenna system and the rf amplifier can be checked for the possibility of a trouble that causes weak antenna signal. With an antenna distribution system, it must supply much more antenna signal than the direct pickup, at each receiver outlet.
19-8 Interference
Frequencies that are not even in the television broadcast band can produce interference in the picture because of heterodyning effects that cause interfering beat frequencies. As one ex ample, the rf interference can beat with the local oscillator in the rf tuner to produce difference frequencies that are in the IF passband of the receiver. Then the interfering signal beats with the picture carrier in the video detector to produce interference in the video signal. This causes interference in the picture. In addition, adjacent television broadcast channels can cause interference. Also, the interference can have frequencies in the IF band of 40 to 46 MHz.
All these are examples of interfering signals external to the receiver. The receiver can also generate its own interference as harmonics of the detected video or sound signals and the horizontal scanning current, which are radiated back to the signal circuits. Typical examples of interference patterns are shown in Fig. 19-14. A list of radio services that can cause interference is included in Appendix B. Diagonal lines. The uniform diagonal lines in Fig. 19-14a are caused by an unmodulated carrier wave (cw). They are of uniform thickness because there is no modulation. Usually, the bars shift slowly from one diagonal position, through the vertical, and to the opposite diagonal as the interfering carrier wave drifts in frequency. This type of interference can be caused by local oscillator radiation from a nearby receiver or from any unmodulated carrier wave. The number of bars and their thickness depends on the beat frequency produced by the cw interference. If the beat frequency resulting from the rf interference is less than 15,750 Hz, it will produce uniform horizontal bars, in a venetian-blind effect.
Herringbone weave. An interfering FM carrier wave produces interfering beats that vary in frequency. With a center frequency high enough to produce a fine-line interference pat tern, the frequency modulation adds a herring bone weave to the vertical or diagonal bars.
When the beat frequencies are too low for a diagonal-line pattern, instead of horizontal bars the FM interference produces a watery effect through the entire picture. Then the picture looks as if it were covered with a silk gauze, as in Fig. 19-14b.
Diathermy interference. Diathermy machines and other medical or industrial equipment usually produce the rf interference pattern shown in Fig. 19-14c. There may be two dark bands across the screen instead of the one shown, and the bars will be darker if the interference is stronger. This rf interference pattern is produced because diathermy equipment is effectively a transmitter. The waving effect is caused by frequency variations. The single band shows that there is a strong 60-Hz component in the interference; with 120-Hz modulation, there would be two bands.
Strong rf interference. In addition to bar pat terns in the picture, the light values are altered by the rf interference when it has enough amplitude. A very strong interfering signal, therefore, can produce a negative picture or black out the picture completely. The negative picture is a result of detection in an overloaded rf or IF amplifier, with the video signal modulating the picture carrier in reverse polarity.
How interference enters the receiver. An interfering rf signal can enter the receiver through the antenna and transmission line, through direct pickup by the chassis, or from the power line. Rf interference at the antenna input of the receiver must go through the rf tuner and, therefore, usually appears on specific channels.
Direct pickup of IF interference by the chassis results in the same interference on all channels.
If the rf interference is from the power line, reversing the plug and adding hand capacitance by holding the line should affect the interference. This can be reduced by an rf filter in the power line.
FM broadcast interference. An FM interference pattern only on channel 2 is usually caused by an FM broadcast station in the 88- to 108-MHz band. You may also hear the audio modulation. An FM trap in the antenna input circuit can be tuned to reject the interfering frequency and eliminate the interference.
Sound IF harmonics. Harmonics of the associated sound IF signal in the receiver can cause an FM interference pattern. Sound IF harmonic interference in the picture can be identified by the fact that it varies with the audio modulation of the associated sound signal and will disappear if a sound IF tube is removed.
Picture IF harmonics. Harmonics of the picture IF carrier signal are usually generated in the video detector. They can be coupled back to the rf tuner and cause interference in the picture.
This may appear as diagonal lines, depending on the beat frequency. There is usually a grainy effect due to amplitude modulation of the video signal by the high-frequency components. The frequency of the beat interference will vary widly with a slight change in the oscillator fine tuning control.
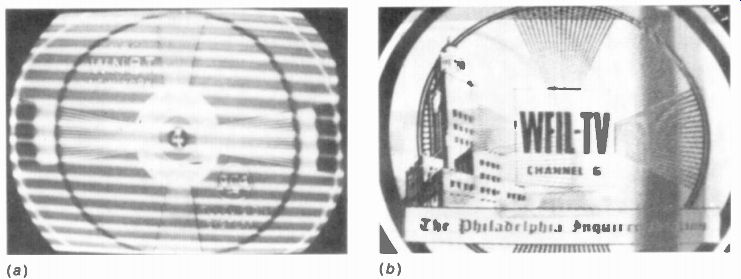
FIGURE 19-15 CHANNEL INTERFERENCE. (a) VENETIAN-BLIND EFFECT CAUSED BY CO-CHANNEL:
(b) WINDSHIELD-WIPER EFFECT CAUSED BY ADJACENT CHANNEL.
Co-channel interference. Stations broadcasting on the same channel are separated by 150 miles or more, but it is still possible for cochannel stations to interfere with each other, especially in fringe locations between cities. If the interfering signal is strong enough, its picture will be superimposed on the desired picture. In addition, there is usually a bar pattern resulting from the beat between the two picture carriers because of their offset frequencies. The beat is an audio frequency that produces a horizontal bar pattern, generally called venetian-blind effect (Fig. 19-15a). This interference usually appears on the low-band VHF channels 2 to 6. The remedy is a more directional antenna, especially for the front-to-back ratio, as interfering co channel stations are often in opposite directions. Or, an antenna rotator can be used.
Adjacent channel interference. When the picture signal of the upper adjacent channel is strong enough, the side bands corresponding to low video frequencies can beat with the desired picture carrier. Then picture information of the interfering station is superimposed on the desired picture. Most noticeable is the vertical bar produced by horizontal blanking, as it drifts from side to side because of the slight difference in horizontal phasing between the two signals.
This is generally called windshield-wiper effect (Fig. 19-15b). The remedy is a more directional antenna, but the IF selectivity can also be improved by wavetraps tuned to reject the adjacent channel intermediate frequencies be cause they are outside the required IF pass band. In the lower adjacent channel, its sound signal can interfere with the picture. Figure 19-16 illustrates how channels 2 and 4 are adjacent to channel 3, as the station tuned in.
Television receiver interference in radio receivers. Harmonics of the 15,750-Hz horizontal deflection current in the television receiver can cause beat-frequency whistles in nearby radio receivers. The whistles appear every 15 kHz with maximum points every 70 to 100 kHz, approximately, on the dial of the radio receiver. This interference can be reduced by inserting an rf filter in series with the power cord of the television receiver. These harmonics can also radiate into the signal circuits and cause interference in the picture.
External noise. Interfering pulse voltages can be produced by ignition systems in automobiles and by arcing in electric motors. This interference shows up as short, horizontal black streaks in the picture (Fig. 19-17). The picture may roll vertically and tear apart horizontally if the noise is strong enough to interfere with synchronization. It is important to notice that when the noise streaks are in a cluster forming a pair of horizontal hum bars, the arcing is from a device operating on the 60-Hz power line. Ignition noise streaks appear at random through the picture.
Arcing in the high-voltage power supply of the receiver can also produce noise streaks.
Usually, you can see the arcing in the high voltage cage.
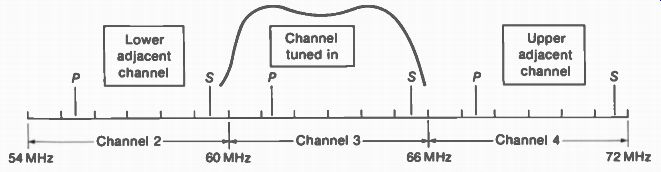
FIGURE 19-16 EXAMPLE OF CHANNELS 2 AND 4 AS ADJACENT CHANNELS WHEN RECEIVER
IS TUNED TO CHANNEL 3.
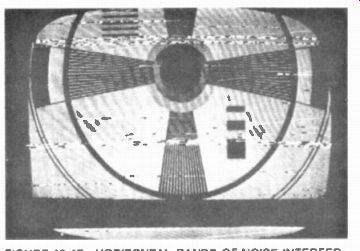
FIGURE 19-17 HORIZONTAL BANDS OF NOISE INTERFERENCE IN THE PICTURE. WITH VERTICAL
ROLLING
External noise interference can enter the receiver as pickup by the antenna or an un shielded transmission line, as direct pickup by the chassis, or through the ac power line.
Minimizing the interference effect in the picture involves supplying more antenna signal or reducing the noise pickup, or doing both, to provide a suitable signal-to-noise ratio. This may be accomplished by using a high-gain directive antenna, with vertical stacking. Moving the antenna out of the noise field by either increasing the antenna height or just finding an antenna placement farther from the noise source is often helpful. It may be necessary to use shielded transmission line to prevent noise pickup by the line.
To reduce pickup from the power line, a low-pass filter can be used. This unit consists of 1-mH rf chokes in series in each side of the line cord and 0.01-µF bypass capacitors across the line. Connect the filter at the point closest to the interference source in order to minimize radiation from the power line.
19-9 Hum Troubles
In addition to hum in the sound, excessive hum voltage can cause one or two pairs of horizontal hum bars. Usually, there is bend in the picture also. Hum at 60 Hz produces one pair of bars, as in Fig. 19-18; two pairs of bars result from 120-Hz hum.
When the hum frequency is 120 Hz, this is caused by excessive ripple in the B+ voltage from a full-wave rectifier with insufficient filtering. The electrolytic capacitors can become dry with age and lose their ability to remove ac ripple from the rectified dc output. When the hum frequency is 60 Hz, this can be caused by heater cathode leakage in a tube. Also, 60 Hz is the ripple frequency in the B+ output from a half-wave rectifier. Insufficient filtering here allows excessive 60-Hz hum voltage.
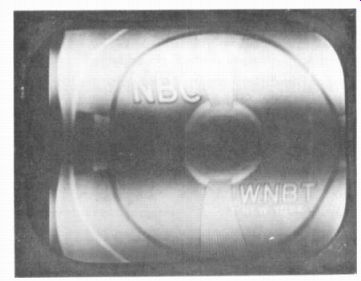
FIGURE 19-18 HUM BARS IN PICTURE BEND ALSO PRESENT BECAUSE OF HUM IN THE
HORIZONTAL SYNC
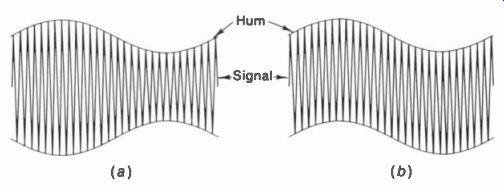
FIGURE 19-19 WAVEFORMS OF HUM COMBINING WITH HIGH-FREQUENCY SIGNAL (a) MODULATION
HUM WITH OPPOSITE ENVELOPES, (b) ADDITIVE HUM WITH PARALLEL ENVELOPES
The hum bars would stay still on the screen if the 60-Hz vertical scanning frequency were locked to the power-line frequency. How ever, with 59.94 Hz for vertical scanning, the hum bars for 60 Hz and 120 Hz drift slowly upward on the screen.
Modulation hum. Hum can be present in high frequency signal circuits, even though they are not able to amplify the hum frequency, if the hum voltage modulates the high-frequency signal. In a picture IF amplifier tuned to 45.75 MHz, for example, leakage between heater and cathode can allow the filament voltage to modulate the grid signal voltage. The result is IF output amplitude-modulated by the 60-Hz hum. Succeeding stages amplify the modulated IF signal, and when it is rectified the detected output includes the 60-Hz hum in the video signal.
Modulation hum is often called tunable hum.
Additive hum. In a circuit that has a plate load impedance for 60-Hz or 120-Hz ac voltages, the hum can be present in addition to the desired signal. Modulation is not necessary, since the circuit can amplify the low-frequency hum voltage itself. The audio amplifiers, video amplifiers, sync amplifiers, and vertical deflection circuits can amplify the hum voltage.
The difference in the waveforms for modulation hum and additive hum is shown in Fig. 19-19. Because of the modulation in Fig. 19-19a, the hum is evident only with a picture produced by the signal. In Fig. 19-19b, though, the hum is riding on the signal. Therefore, additive hum can also be seen in the raster even without a picture.
Hum bend in the raster. See Fig. 19-20. The edges of the raster have sine-wave bend be cause of hum. One cycle of bend is shown here for 60-Hz hum. With 120-Hz hum there are two cycles of bend at the edges of the raster. In Fig. 19-20a, the width of the horizontal scanning lines is varying at the hum frequency. This can be caused by hum in the horizontal scanning current. In Fig. 19-20b, the lines are displaced horizontally. Note that the two sides of the raster are parallel. This effect can be caused by hum in the horizontal AFC or in the horizontal oscillator.
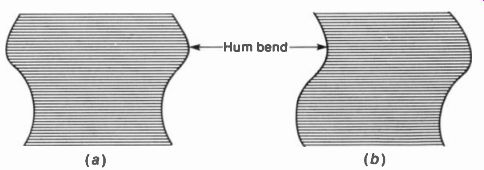
FIGURE 19-20 BEND IN RASTER, CAUSED BY HUM. (a) WIDTH MODULATED AT 60 Hz:
(b) LINES DISPLACED HORIZONTALLY AT 60 Hz.
SUMMARY
1. Troubles in the height, width, or shape of the raster are in the vertical and horizontal scanning circuits, including the deflection yoke.
2. The damper diode in the horizontal output circuit (a) damps oscillations; (b)
provides the left side of horizontal scanning; and (c) rectifies the deflection voltage to produce boosted B+ voltage.
3. The boosted B+ is generally used for plate voltage on the horizontal amplifier tube. Therefore, this stage cannot operate without the damper.
4. A trapezoidal raster is caused by a defective deflection yoke.
5. The usual cause of no brightness with normal sound is no high voltage. The trouble can be in the high-voltage rectifier or the horizontal scanning circuits.
6. Ghosts in the picture are usually caused by multipath signals received by the antenna. There is no way to eliminate these ghosts except by eliminating multipath reception at the antenna.
7. Random noise generated in the mixer stage is amplified by the receiver to produce snow in the picture. A snowy picture indicates there is not enough rf signal.
8. Hum in the video signal produces hum bars, often with bend in the picture.
9. The three ways of having sound interference in the picture are (a) horizontal bars from the audio, (b) 4.5-MHz beat, and (c) 920-kHz beat.
10. Troubles in the coupling and bypass capacitors in the video amplifier cause smear and streaking in the picture. The capacitor can be leaky or open.
11. Cochannel interference can produce a venetian blind effect, similar to the effect of audio signal in the picture. The remedy is a more directional antenna.
12. The upper adjacent channel can produce an interfering image superimposed on the main picture, with a windshield-wiper effect caused by the horizontal blanking bar drifting across the screen. The remedy is a more directional antenna.
Self-Examination (Answers at back of guide)
Match the troubles at the left with a possible cause or source at the right.
1. No height
2. No brightness
3. Poor vertical linearity
4. Trapezoidal raster
5. Insufficient width
6. Sound in picture
7. Two hum bars and bend
8. Smear with streaking
Weak horizontal amplifier
4.5-MHz trap
Filter capacitor in full-wave power supply
Weak high-voltage rectifier
Shorted turns in yoke coil
Video bypass capacitor
Cochannel interference
Audio output stage
9. Windshield-wiper effect
10. Snowy picture
11. No picture and no sound
12. Ghost
13. Blooming
4. Raster too blue
15. No color
16. No sound, but normal picture
i. Too much AGC bias
j. Vertical oscillator not operating
k. Weak vertical amplifier I. Screen controls for picture tube
m. Antenna
n. 3.58-MHz bandpass amplifier
o. Horizontal damper not operating
p. Rf amplifier
Essay Questions
1. Give the function and circuit for each of the following controls: height, vertical linearity, width, vertical hold, focus, and horizontal hold.
2. Give three functions of the horizontal output transformer.
3. What is meant by boosted B+ voltage?
4. Give two functions of the damper diode.
5. Give the functions of the vertical integrator circuit and horizontal AFC circuit.
6. Give an example of adjacent channel interference, other than the example of channels 2, 3, and 4 in Fig. 19-16.
7. Give an example of cochannel interference. How can this be reduced?
8. Give three ways in which the sound signal can interfere in the picture.
9. What is the difference between additive hum and tunable hum?
10. The picture has two pairs of hum bars, with bend in the picture but not in the raster. What is the most likely cause of this trouble?
11. The picture has a slight vertical bend, without any hum bars. What is a possible cause of this trouble?
12. The picture is reversed in black and white and torn apart in diagonal segments, with buzz in the sound. What is this trouble?
13. List the circuits that would be for sound alone in a color receiver.
14. Give three possible troubles that would cause no brightness, with normal sound.
15. Give two possible troubles that would cause no brightness and no sound.
16. Why does a weak rf amplifier cause a picture that has snow?
17. What is the main cause of ghosts in the picture?
18. Why is the video detector circuit usually shielded?
19. What is a possible cause of smear and streaking in the picture?
20. Describe the difference between ghosts from multipath signals and multiple outlines in the picture caused by ringing.
21. What is venetian-blind effect?
22. What is windshield-wiper effect?
Problems (Answers to selected problems at back of guide)
1. Refer to the example of adjacent channels in Fig. 19-16. (a) Calculate the carrier frequencies of P and S for channels 2, 3, and 4. (b) With the rf local oscillator at 107 MHz to tune in channel 3, calculate the IF values of P and S for the three channels.
2. Repeat Problem 1 for the example of channels 7 and 9 adjacent to channel 8 as the station tuned in.
3. Approximately how many pairs of horizontal bars can be produced by an interfering audio frequency of (a) 60 Hz, (b) 420 Hz?
4. Approximately how many pairs of vertical bars can be produced by an interfering frequency of (a) 920 kHz, (b) 4.5 MHz?
5. If a video signal is delayed 2 iks, how many inches will it be displaced horizontally to the right on a screen 20 in. wide?
6. Refer to Table 19-1 below and describe briefly the trouble for each figure listed and give a possible cause.
TABLE 19- 1 TROUBLES IN THE RASTER AND PICTURE
FIGURE TROUBLE CAUSE 19-2 19-3 19-4 19-6 19-7 19-8 19-12 19-13 19-17