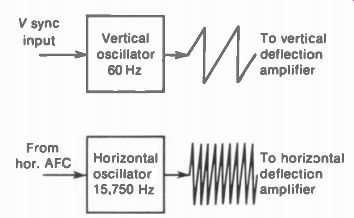
The scanning of the electron beam in the picture tube is made possible by the deflection oscillator stages in the receiver. As illustrated in Fig. 20-1, the deflection voltage generated by the vertical oscillator at 60 Hz* is coupled to the vertical deflection amplifier. This output stage supplies the amount of current needed for the vertical scanning coils in the deflection yoke mounted on the neck of the picture tube. Similarly, the horizontal oscillator produces the deflection voltage at 15,750 Hz needed for the horizontal output stage. The two types of oscillator circuits generally used are the blocking oscillator (Fig. 20-7) and the multivibrator (Fig. 20-18). These are free-running oscillators, which operate with or without sync input. However, the sync locks the oscillator into the correct frequency. The advantage of using the vertical and horizontal oscillators, instead of driving the deflection circuits directly with sync voltage, is that the raster is still produced between stations when the receiver has no signal.
More details are described in the following topics:
20-1 The sawtooth deflection waveform
20-2 Producing sawtooth voltage
20-3 Blocking oscillator and discharge tube
20-4 Analysis of blocking oscillator circuit
20-5 Blocking oscillator sawtooth generator
20-6 Transistorized blocking oscillator circuit
20-7 Frequency and size controls
20-8 Synchronizing the blocking oscillator
20- 9 Types of multivibrator circuits
20-10 Plate-coupled multivibrator
20-11 Cathode-coupled multivibrator
20-12 Multivibrator sawtooth generator
20-13 Synchronizing the multivibrator
20-14 Frequency dividers
20-15 Transistors in multivibrator circuits
20-16 Sawtooth, trapezoidal, and rectangular voltages and currents
20-17 Incorrect oscillator frequency
*Broadcast stations generally use the scanning frequencies of exactly 59.94 Hz and 15,734 Hz for color and monochrome programs. However, the nominal values of 60 Hz for V and 15,750 Hz for H are used here. In either case, the deflection oscillators will be locked in at the sync frequency.
20-1 The Sawtooth Deflection Waveform
Linear scanning requires the sawtooth waveform shown in Fig. 20-2 because it has: (1) a linear rise in amplitude which will deflect the electron beam at uniform speed for a linear trace without squeezing or spreading the picture in formation and (2) a sharp drop in amplitude for the fast retrace or flyback. These requirements apply to horizontal and vertical scanning. Note the following factors about the sawtooth wave form in Fig. 20-2:
1. One sawtooth cycle includes both trace and retrace. The frequency is 60 Hz for vertical scanning and 15,750 Hz for horizontal scanning.
2. The waveform is an ac voltage (E) or current (/), with an average-value axis of zero. The dotted lines in the figure show equal amplitudes above and below the zero axis. The electron beam can be centered by dc voltages or by a steady magnetic field. Then the ac sawtooth waveform of E or I deflects the beam to both sides of center. Zero amplitude on the sawtooth waveform is the time when the beam is at the center, without deflection.
3. The peak-to-peak amplitude of the sawtooth wave determines the amount of deflection away from center. The electron beam is at the extreme left and right edges of the raster when the horizontal-deflecting sawtooth wave has its peak positive and negative amplitudes. Similarly, the beam is at the top and bottom for the peak amplitudes of the sawtooth waveform for vertical deflection.
The sawtooth waveform can have opposite polarities, as shown in Fig. 20-3. In Fig. 20-3a, the waveform is a positive-going saw tooth, as the trace amplitudes increase in the positive direction. In Fig. 20-3b, the amplitudes increase in the negative direction for the trace.
In both cases, the trace includes the linear rise from the start at point 1 to the end of trace at the peak at point 2. This point also is the start of re trace, finishing at point 3 for a complete saw tooth cycle.
FIGURE 20-1 THE HORIZONTAL AND VERTICAL Deflection OSCILLATORS GENERATE SAVVTOOTH
VOLTAGE FOR THE SCANNING CIRCUITS
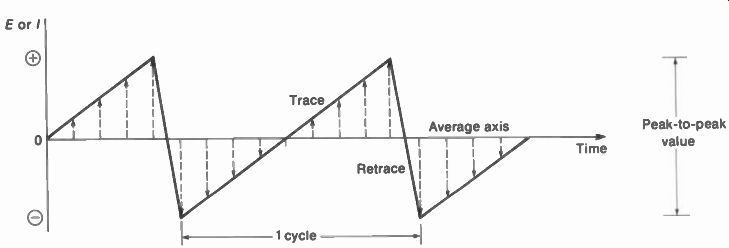
FIGURE 20-2 THE SAWTOOTH DEFLECTION WAVEFORM
For the specific case of horizontal scanning, the start of the trace at point 1 is when the beam is at the left edge of the raster. At the time of point 2 on the sawtooth, the beam is at the right edge. Then the retrace between points 2 and 3 makes the fast flyback to the left edge.
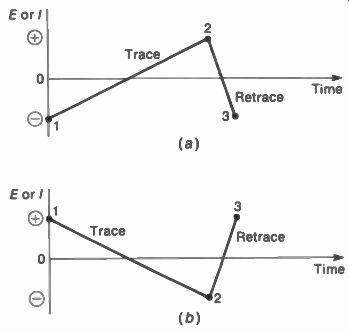
FIGURE 20-3 INVERTED POLARITIES OF THE SAWTOOTH WAVEFORM. (a) POSITIVE-GOING
TRACE; (b) NEGATIVE GOING TRACE.
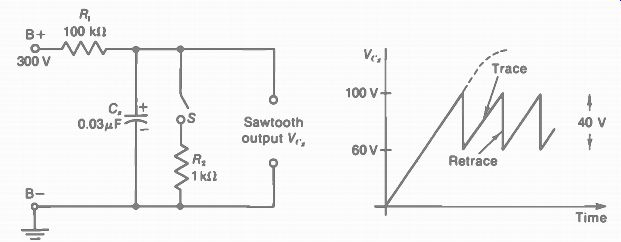
FIGURE 20-4 FUNDAMENTAL METHOD OF PRODUCING SAWTOOTH VOLTAGE. C, CHARGES
SLOWLY THROUGH HIGH RESISTANCE OF R, FOR LINEAR RISE. THEN S IS CLOSED TO
DISCHARGE C, FAST THROUGH A. FOR RETRACE.
Point 3 marks the start of another line for the next cycle of horizontal scanning.
Similarly, for vertical scanning point 1 is when the beam is at the top of the raster. At the time of point 2, the beam is at the bottom. Then the retrace between points 2 and 3 makes the vertical flyback to the top. Point 3 marks the start of another field for the next cycle of vertical scanning.
20-2 Producing Sawtooth Voltage
Usually, sawtooth voltage is obtained as the voltage output across a capacitor that is alternately charged slowly and discharged fast (see Fig. 20-4). There are two requirements:
1. Charge the capacitor through a high resistance in series with C, for a long time constant. The charging produces a linear rise of voltage across C. for the trace part of the sawtooth wave.
2. Discharge the same capacitor through a much smaller resistance for a relatively fast time constant. The sharp drop in capacitor voltage as it discharges is the retrace part of the sawtooth wave.
This sawtooth waveform is also called a ramp voltage, sweep voltage, or time base.
In Fig. 20-4, when dc voltage is applied the capacitor charges toward the B+ voltage applied. The result is an exponential charge curve, at a rate determined by the RC time constant.' The path for charging current is from B- to accumulate negative charge at the grounded side of C.,. Electrons are then repelled from the opposite plate to produce current through R _p returning to the B+ terminal of the voltage source. As charge builds up in the capacitor, the voltage across Cs increases. The rate of increase in voltage depends on the RC time constant.
This equals 0.003 s for charging C in the example here.
Let us assume that, when the voltage across C, builds up to 100 V, we close the switch. Then C. discharges through the low resistance path in parallel. The path for discharge current is from the negative side of C. through R, and the closed switch back to the positive side of C. ,. Practically no current flows through the R, path because of its high resistance compared with R. Since electrons lost from the negative side are added to the positive side, the charge in the capacitor is neutralized.
Then the voltage across Cs decreases toward zero. The RC, time constant of 0.00003 s for discharge is only one-hundredth of the time constant for charge. Therefore, the decrease in capacitor voltage, with a short time constant on discharge, is much faster than the voltage rise on charge.
[[See Appendix D for details of RC time constant. ]]
If we open the discharge switch when the voltage across C. has discharged down to 60 V, the capacitor will start charging again. From now on, the capacitor starts charging from a 60-V level. However, we can still discharge the capacitor by closing the switch every time V. reaches 100 V. Also, we open the switch to allow recharging when V,. is down to 60 V. The result is the sawtooth waveform shown for the output voltage across C.,. One cycle of the sawtooth wave includes a linear rise for trace and the sharp drop in amplitude for the retrace. The frequency of the sawtooth wave here depends or the rate of switching. Note that the peak-to peak amplitude of this sawtooth voltage wave form is 40 V, equal to the difference between the maximum at 100 V and the minimum at 60 V.
Actually, the switch S in Fig. 20-4 represents a gas tube, vacuum tube, or transistor that can be switched on or off at almost any speed.
When the tube or transistor is not conducting, this condition is the off position. Maximum conduction is the on position. Connected in parallel with Cs, the tube or transistor conducting maximum current provides a low-resistance discharge path to allow a fast decay of capacitor voltage for the retrace. In this application, we can call the tube a discharge tube. C, is often called the sawtooth capacitor or sweep capacitor.
The voltage rise on the sawtooth wave is kept linear by using only a small part of the exponential RC charge curve. As shown in Appendix D, the first 40 percent of the curve is linear within 1 percent. To limit the voltage rise to this linear part of the curve, the charging time should be no more than one-half the RC time constant.
A higher B+ voltage also improves linearity, as a specific amount of V,. is a smaller percentage of the applied voltage. Then a smaller part of the RC charge curve is used, the part where it is most linear.
20-3 Blocking Oscillator and Discharge Tube
Figure 20-5 shows how a vacuum tube can be used as a discharge tube in parallel with the sawtooth capacitor C,. While its grid voltage is more negative than cutoff, the discharge tube cannot conduct plate current. Then it is an open circuit. While the discharge tube is cut off, therefore, the sawtooth capacitor Cs in the plate circuit charges toward the B+ voltage, through the series resistance R, to produce the linear rise on the sawtooth voltage wave. When the grid voltage drives the discharge tube into conduction, its plate-to-cathode circuit becomes a low resistance equal to several hundred ohms. Then C. discharges quickly from cathode to plate through the discharge tube, producing the rapid fall in voltage for the flyback on the sawtooth voltage wave. Therefore, by applying narrow positive pulses to the grid of the discharge tube and keeping it cut off between pulses, a sawtooth wave of voltage is produced in the output.
Figure 20-6 illustrates how the linear rise of voltage in the output corresponds to the time when the grid is more negative than cutoff, while the flyback time coincides with the positive grid pulse. The result is a sawtooth wave of voltage output from the plate of the discharge tube with the same frequency as the grid-voltage pulses from the blocking oscillator.
Blocking oscillator circuit. Essentially Fig. 20-7 is a transformer-coupled oscillator with grid leak bias. The transformer provides grid feed back voltage with the polarity required to reinforce grid signal and start the oscillations.
When the oscillator feedback drives the grid positive, grid current flows to develop grid-leak bias. This regenerative circuit could oscillate with continuous sine-wave output at the natural resonant frequency of the transformer, depending on its inductance and stray capacitance.
However, several factors enable the oscillator to cut itself off with high negative grid-leak bias. A large amount of feedback is used. Also, the R _pC,. time constant is made long enough to allow the grid-leak bias to keep the tube cut off for a relatively long time. Finally, the transformer has high internal resistance for low 0, so that after the first cycle the sine-wave oscillations do not have enough amplitude to overcome the negative bias.
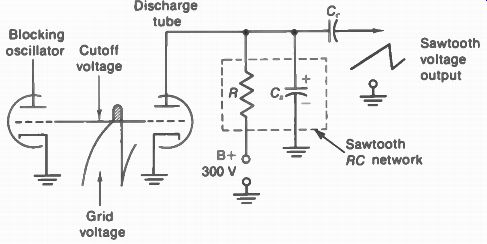
FIGURE 20-5 BLOCKING OSCILLATOR GRID VOLTAGE DRIVING DISCHARGE TUBE TO PRODUCE
SAWTOOTH VOLTAGE ACROSS C,. SHADED AREA IN GRID VOLTAGE INDICATES TIME OF
PLATE-CURRENT CONDUCTION.
The tube remains cut off until C. can discharge through R _p to the point where the grid-leak bias voltage is less than cutoff. Then plate current can flow again to provide feedback signal for the grid, and the cycle of operation repeats itself at the blocking rate. Therefore, the circuit operates as an intermittent or blocking oscillator. The tube conducts a large pulse of plate current for a short time and is cut off for a long time between pulses.
Pulse repetition frequency. As shown in Fig. 20-8, one sine-wave cycle of high amplitude is produced at the blocking rate. The succeeding sine waves, in dotted lines, do not have enough amplitude to overcome the negative grid-leak bias blocking the oscillator. The number of tines per second that the oscillator produces the pulse and then blocks itself is the pulse repetition rate, or frequency. This blocking frequency is much lower than the frequency of the sine waves, which is the ringing frequency or resonant frequency of the transformer (Fig. 2C-9).
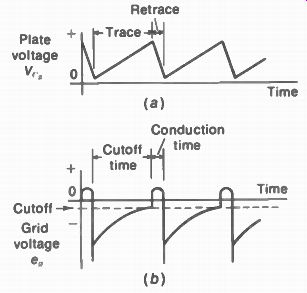
FIGURE 20-6 (a) HOW SAWTOOTH VOLTAGE ACROSS C, CORRESPONDS TO (b) GRID VOLTAGE.
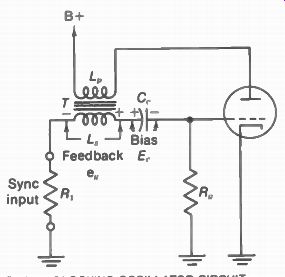
FIGURE 20-7 BLOCKING OSCILLATOR CIRCUIT
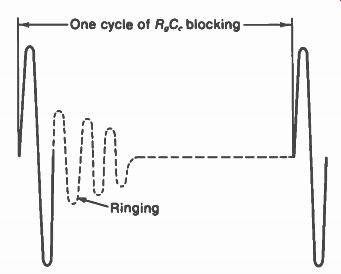
FIGURE 20-8 RINGING OF BLOCKING OSCILLATOR TRANS FORMER AT RESONANT FREQUENCY
OF ITS INDUCTANCE AND STRAY CAPACITANCE.
FIGURE 20-9 VERTICAL BLOCKING OSCILLATOR TRANS FORMER. HEIGHT IS 2 IN. (STANCOR)
For a deflection oscillator, the pulse repetition rate is what we consider to be the oscillator frequency. This is the rate at which the tube oscillates between conduction and cutoff. The blocking frequency is determined mainly by the R„C, time constant. In a horizontal deflection oscillator, its R„C„ time constant allows the blocking oscillator to operate at a pulse repetition frequency of 15,750 Hz; a vertical blocking oscillator operates at 60 Hz. The type of circuit that oscillates between conduction and cutoff is often called a relaxation oscillator, as the stage is relaxing while it is not conducting.
20-4 Analysis of Blocking Oscillator Circuit
The waveform of instantaneous grid voltage e e can be considered in two parts. One is the ac feedback voltage e„ for the grid, induced across the transformer secondary by a change in primary current. The other is the dc bias voltage E,., developed when the feedback signal drives the grid positive to produce grid current. E, can increase fast when grid current charges the coupling capacitor to produce the grid-leak bias. The bias voltage must decrease slowly, however, as Ce discharges through the high resistance of R, when the feedback signal voltage decreases.
At any instant, the net grid voltage e,. is equal to the algebraic sum of the bias E, and the signal drive e m. The grid signal voltage caused by feedback can drop to zero instantaneously when the feedback ceases, but the bias cannot.
This is why the oscillator can cut itself off with the grid-leak bias produced by its own feedback.
It is worth reviewing the fundamentals of induced voltage with a transformer to see how the feedback voltage can increase, decrease, or reverse polarity. First, the primary current must change to induce voltage in the secondary. The amount of induced voltage in the secondary winding increases with a sharper rate of change in primary current. A slower rate of current change means less induced voltage. When the current stops changing, there is zero induced voltage for the steady primary current.
Furthermore, we must consider the polarity of induced voltage. In the blocking oscillator transformer, plate current in the primary can flow in only the one direction, from the plate to the B+ voltage source. However, the current can either increase or decrease. Whatever polarity the induced voltage has for an increase of current, the polarity reverses for a decrease in current. The polarity reversal results from the fact that increasing current has an expanding magnetic field cutting across the winding, but the field collapses into the winding with de creasing current. The polarity of induced voltage reverses across both the primary and the secondary when the current change reverses from increasing to decreasing values, or vice versa.
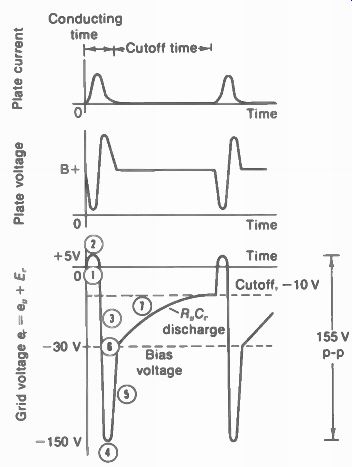
FIGURE 20-10 PLATE AND GRID WAVEFORMS IN BLOCKing OSCILLATOR CIRCUIT. SEE
TEXT FOR EXPLANATION OF NUMBERED STEPS IN GRID VOLTAGE.
The cycle of operations can be followed from the time power is applied to produce plate current. Note the plate and grid waveforms in Fig. 20-10. The numbers in the e, waveform correspond to the following steps in the circuit analysis:
1. Increasing plate current. Plate current flows immediately because the grid-leak bias is zero at the start. Now the plate current through L„ is increasing from zero. The windings are poled to make the resultant induced voltage positive at the grid side of L,. Therefore, in creasing plate current induces feedback voltage that drives the grid positive. The positive feed back increases the plate current still more. As a result of the regeneration, the plate current increases very quickly to its maximum value.
During this time when the feedback is driving the grid positive, grid current flows to develop negative bias a little less than the peak positive drive. As an example, for +35 V at the peak, the grid-leak bias may be about -30 V. Then the net grid voltage is +5 V. The positive grid voltage is maintained while e _p is positive and more than E,.. This part of the cycle occurs while the plate current is increasing to produce positive grid feedback voltage.
2. Maximum plate current. The rise in plate current is limited by saturation. Then the current increases at a slower rate. The result is less induced feedback voltage. However, the negative bias remains. With less positive grid drive, now the plate current starts to decrease. At this turning point, the grid feedback voltage changes in polarity from positive to negative. Plate current is still flowing, but it is decreasing instead of increasing.
3. Negative grid feedback. As the grid be comes less positive, the negative grid feedback decreases the plate current still further. The amplification of the tube then makes the plate current drop sharply toward zero. This fast drop in current produces a very large negative voltage at the grid.
4. Maximum negative grid feedback. The fastest drop in plate current produces the maximum negative voltage at the grid, which can be -150 V, or more. This large peak voltage in the negative direction is the result of two factors.
First, there is no grid current now. Without the load of grid current in the secondary, the primary current can drop faster than it rises.
Also, the negative grid feedback is series-aiding with the negative grid-leak bias so that now e„ is added to
5. Decreasing negative grid feedback. Be cause inductance opposes a change in current, the plate current in L _p decreases at a slower rate as it drops toward zero. The current decay in an inductance corresponds to a capacitor discharge curve, with the sharpest slope at the start. Therefore, the amount of negative feedback voltage decreases as the drop in plate current approaches zero. Plate current can flow even though the grid voltage is very negative, as the self-induced voltage across L _p makes the plate voltage rise to a positive value much higher than B+.
6. Plate current drops to zero. Now there is no feedback voltage at all. However, the grid leak bias produced while the grid was positive still remains after the feedback stops. This bias voltage keeps the tube cut off.
7. C,. discharges through R„. As C,. loses charge, its negative bias voltage decreases. If we take the example of -30 V maximum grid leak bias, and a grid-cutoff voltage of -10 V, the tube is cut off for the time it takes C,. to discharge 20 V, from -30 to -10 V. Therefore, the cutoff time depends on the R„C,. time constant.
When the grid-leak bias becomes less than the grid-cutoff voltage, plate current can flow again to produce the next pulse and the cycle is repeated. Therefore, the blocking oscillator continuously generates sharp positive grid pulses followed by relatively long periods of cutoff. The blocking rate is faster for a higher frequency, with a shorter time constant for The blocking oscillator frequency also depends on the tube characteristics, especially its grid cutoff voltage, the plate voltage, and the trans former. Frequency increases with less plate voltage because the grid cutoff voltage is reduced. However, the oscillator frequency is usually varied by adjusting either the R _pC, time constant or the bias voltage in the grid circuit.
20-5 Blocking Oscillator Sawtooth Generator
Instead of having a separate discharge tube, the blocking oscillator itself can have the sawtooth capacitor C, in the output circuit, as shown in Fig. 20-11. This circuit can be operated as a sawtooth generator for either vertical deflection at 60 Hz or horizontal deflection at 15,750 Hz.
Either a tube or a transistor can be used. The stage is a free-running oscillator, meaning it operates with or without sync input.
Single-triode circuit. In Fig. 20-11, C. is in the oscillator plate circuit. While the oscillator is cut off by its blocking action, Cs charges through the series resistance of R. and R _p toward the B+ voltage. When plate current flows during the oscillator pulse, C, discharges through the tube.
The discharge path for C, is from cathode to plate and through the plate winding of the trans former T. Note that the discharge current of C. is in the same direction as normal plate current during oscillator conduction. The frequency of the sawtooth voltage output is the frequency of the blocking oscillator.
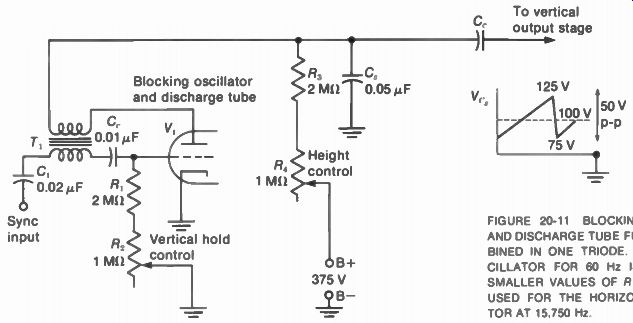
FIGURE 20-11 BLOCKING OSCILLATOR AND DISCHARGE TUBE FUNCTICNS combineD IN
ONE TRIODE. VERTCAL OSCILLATOR FOR 60 Hz IS SHOWN, BUT SMALLER VALUES OF R
AND C CAN BE USED FOR THE HORIZONTAL OSCILLATOR AT 15.750 Hz.
It should be noted that changes in plate voltage vary the oscillator frequency. This effect occurs when R, in the plate circuit is varied to adjust the height of the raster. The resulting change in E _p has the side effect of changing the oscillator frequency, which usually makes the picture roll. However, the frequency can be brought back to normal by readjusting the hold control R.
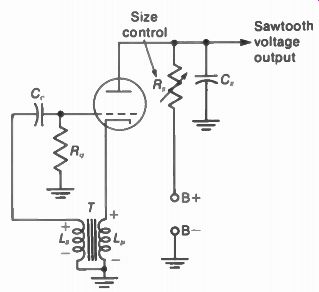
FIGURE 20-12 BLOCKING OSCILLATOR CIRCUIT WITH CATHODE FEEDBACK. POLARITIES
SHOWN FOR INCREASing CATHODE CURRENT.
Cathode feedback. In Fig. 20-12, the blocking oscillator transformer supplies feedback from cathode to grid. The plate current returns through L,„ from the ground side to cathode.
Note that the voltage polarities shown for in creasing cathode current induce positive grid feedback. The sawtooth capacitor C. is in the plate circuit without the transformer. While the tube is cut off, C, charges through R,. Then C. discharges through L _p and the tube when it con ducts at the blocking oscillator frequency.
20-6 Transistorized Blocking Oscillator Circuit
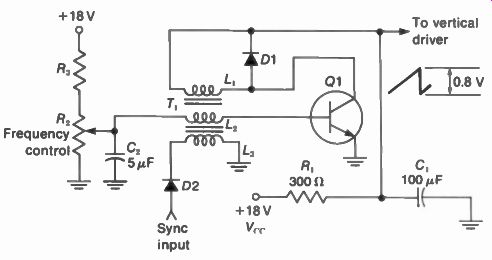
FIGURE 20-13 TRANSISTORIZED BLOCKING OSCILLATOR AS SAW TOOTH VOLTAGE GENERATOR
FOR VERTICAL DEFLECTION AT 60 Hz. THIS CIRCUIT CAN ALSO BE USED WITH SMALLER
RAND C VALUES FOR HORIZONTAL OSCILLATOR AT 15,750 Hz.
As shown in Fig. 20-13, this collector-coupled stage is similar to the plate-coupled oscillator in Fig. 20-7. The blocking oscillator transformer can also be emitter-coupled to the base, similar to the cathode coupling in Fig. 20-12.
In transistor circuits, capacitance values are much larger because the resistances are smaller. The 100-µF C, is the sawtooth capacitor with the 330-ohm R, in the collector circuit.
Also, the collector supply is much less than typical plate voltage for tubes. However, the required amount of sawtooth voltage for the driver stage is less than 1 V. The driver isolates the oscillator from the very low input resistance of the power output stage.
In Fig. 20-13, the oscillator frequency control R., varies the amount of positive forward voltage at the base of the NPN transistor. In order for a transistor oscillator to be free-running it must have forward bias, provided by the R2R1 voltage divider. Unlike a tube, a transistor is cut off without any bias.
The protective diodes D1 and D2 in Fig. 20-13 are needed with transistors. Remember that semiconductor diodes conduct only with positive anode voltage at the arrow terminal, or negative at the cathode. The diode is an open circuit for the opposite polarity. Q1 is in parallel with the collector winding to short-circuit transient negative voltage pulses that would put forward voltage on the collector. In the base circuit of the oscillator, D2 prevents positive voltage pulses from being coupled back into the sync circuits. The sync is inductively coupled to the base of Q1 by means of a separate winding L„ on the blocking oscillator transformer T,. The winding L, has the collector current, while L 2 provides feedback to the base.
20-7 Frequency and Size Controls
The frequency and amplitude of the oscillator output can be adjusted by variable resistances.
Referring to Fig. 20-11, R, varies the time constant of the grid-leak bias circuit to adjust the oscillator frequency. R, in the plate circuit determines the time constant for charging C. to ad just the peak-to-peak amplitude of the sawtooth voltage output.
Size control. Decreasing the resistance of R, in Fig. 20-11 makes the time constant shorter for charging C. Then the voltage across C, increases at a faster rate. However, the amount of time allowed for charging is equal to the cutoff period, as determined by the oscillator frequency. For any one frequency, therefore, C. can charge to a higher voltage because of the faster charging rate with a shorter time constant.
As a result, decreasing the resistance of the size control increases the amplitude of sawtooth voltage output to increase the size of the scanning raster. Increasing the resistance of the size control decreases the scanning amplitude.
Usually, a fixed resistance is in series with the control to limit the range of variations for easier adjustment.
This method of size control is generally used in the vertical deflection generator to ad just the height of the raster. Then it is called the height control.
Effect of C, time constant on amplitude and linearity. Figure 20-14 shows the effect on sawtooth voltage amplitude when the height control in Fig. 20-11 is varied. For zero resistance in R _p the time constant of RC. equals 0.1 s.
This is approximately six times longer than the vertical scanning period of 0.016 s. Therefore, C. can take on enough charge to raise its voltage by one-sixth the net charging voltage, since the charging time equals one-sixth of the time constant.
Let us assume 75 V across C. at the start of charge, after the first few cycles of charge and discharge. With B+ voltage of 375 V, the net charging voltage equals 375 - 75, or 300 V. Therefore, C. charges an additional 50 V, or one sixth of 300 V. This voltage equals the peak-to peak amplitude of sawtooth output, between 75 V and 125 V.
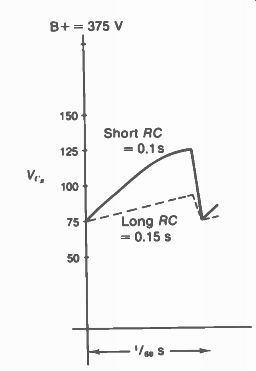
FIGURE 20-14 EFFECT OF VARYING THE TIME CONSTANT FOR C. IN FIG. 20-11. WITH
HEIGHT CONTROL AT MINIMUM AND MAXIMUM R.
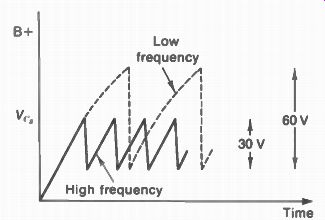
FIGURE 20-15 EFFECT OF FREQUENCY ON AMPLITUDE OF SAWTOOTH VOLTAGE OUTPUT.
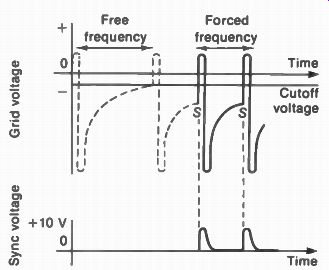
FIGURE 20-16 SYNCHRONIZING THE BLOCKING OSCILLA TOR WITH POSITIVE TRIGGER
PULSES IN THE GRID CIRCUIT.
At the opposite extreme, with the height control at maximum resistance, the time constant for charge equals 0.15 s. This is approximately ten times longer than 0.016 s. Therefore, C, rakes on additional charge to raise its voltage by one-tenth of 300 V. Then the peak-to-peak sawtooth voltage equals 30 V, between 75 V and 105 V. Note the better linearity but smaller amplitude with the longer time constant.
Frequency control. To control the oscillator frequency, the R _pC,. time constant in the oscillator grid circuit is varied. This determines how fast the negative bias voltage can discharge down to cutoff. A shorter time constant with smaller values for R„ and C,. allows a faster discharge for a higher frequency. Making the R _pC,. time constant longer lowers the oscillator frequency. The range of frequency control for the vertical oscillator is usually about 40 to 90 Hz.
The oscillator frequency control is adjusted to the point where the sync voltage can lock in the oscillator at the sync frequency to make the picture hold still. For this reason the frequency adjustment is generally called the hold control.
In the vertical oscillator, the vertical hold control generally is the oscillator frequency adjustment, as in Fig. 20-11. However, since the horizontal oscillator usually has automatic frequency control, the horizontal hold adjustment may be in the AFC circuit.
Effect of oscillator frequency on sawtooth amplitude. It should be noted that the frequency is determined by the oscillator grid circuit, while the sawtooth capacitor in the plate circuit of the discharge tube determines amplitude and linearity of the sawtooth voltage output. However, Changing the frequency will affect sawtooth amplitude and linearity. This idea is illustrated in Fig. 20-15. With any given time constant for C. on charge, if the frequency is higher, less time is available for charging. Then C„ is charged to a lower voltage at the time of discharge. For the opposite case, a lower frequency allows C. to charge to a higher voltage before discharge occurs, producing more sawtooth voltage output.
20-8 Synchronizing the Blocking Oscillator
A circuit like this is called a soft oscillator because its frequency is easily changed by variations in the electrode voltages. Its advantage, however, is that the oscillator can easily be synchronized to lock in at the sync frequency. The frequency can be synchronized either by sync pulses that trigger the oscillator into conduction at the sync frequency or by dc voltage to control the grid bias. The vertical deflection oscillator is usually locked in with triggered sync at 60 Hz.
However, the horizontal oscillator frequency is usually synchronized with dc control voltage produced by the horizontal AFC circuit.
Triggered sync. The blocking oscillator can be synchronized by small positive pulses injected in the grid circuit to trigger the oscillator into conduction at the frequency of the sync pulses. The sync voltage is applied in series with the grid winding of the transformer. Then the positive sync voltage cancels part of the grid bias voltage produced by the oscillator. For the vertical oscillator, the sync pulse from the integrator has a peak amplitude of 1 to 10 V. In Fig. 20-16, the positive sync pulses arrive at the times marked S, when the declining grid voltage is close to cutoff. Then a small sync voltage will be enough to drive the grid voltage momentarily above the cutoff voltage. As soon as plate current starts to flow, the oscillator goes through a complete cycle. With another positive sync pulse applied at a similar point of the following cycle, the oscillator again begins a new cycle at the time of the pulse. As a result, the pulses force the oscillator to operate at the sync frequency. The frequency of the oscillator without sync is called the free-running frequency; the synchronized oscillator frequency is the forced frequency.
The free-running frequency must be lower than the sync frequency. Then the sync pulses will drive the grid voltage in the positive direction when the oscillator is ready for triggering. This is the time when the grid bias has declined practically down to cutoff by itself, and needs only a slight additional positive voltage to start the flow of plate current and the beginning of a cycle. A positive sync pulse that occurs in the middle of the oscillator cycle must have a much higher value to drive the grid voltage to cutoff. The peak negative swing of the grid-voltage wave may be more than 150 V, but toward the end of the cycle a few volts of positive sync voltage can be enough to trigger the oscillator into conduction.
Sync voltage of negative polarity at the grid cannot trigger the blocking oscillator. Also, the oscillator cannot be triggered if the free frequency is slightly higher than the synchronizing frequency. Then the sync pulses will occur after the oscillator has started to conduct by itself, and they will have no effect.
Operating the oscillator at the same frequency as the synchronizing pulses does not provide good triggering because the oscillator frequency can drift above the sync frequency, resulting in no synchronization. For best synchronization, the free-running oscillator frequency is adjusted slightly lower than the forced frequency, so that the time between sync pulses is shorter than the time between pulses of the free-running oscillator. Then each synchronizing pulse occurs just before an oscillator pulse and forces the tube into conduction, thereby triggering every cycle to hold the oscillator locked in at the sync frequency.
Effect of noise. The triggering action can be made less sensitive to noise pulses by re turning the grid to a positive voltage, instead of chassis ground. The added positive voltage has two effects on the grid discharge. First, the negative bias declines to cutoff with a sharper slope because a smaller part of the R,C,. discharge curve is used. With a sharper slope of declining grid voltage, an interfering noise pulse just before the sync pulse will need much more amplitude to trigger the oscillator. The second effect is that the added positive voltage makes the negative bias decline to cutoff in less time, raising the oscillator frequency. However, the frequency control can be adjusted to bring the oscillator to the frequency desired.
Dc control voltage. In Fig. 20-17 positive dc control voltage is directly coupled to the blocking oscillator grid. R, varies the amount of dc voltage used to control the oscillator frequency.
In the waveshape below, the +10 V added decreases the negative grid voltage. As a result, less time is necessary for the grid leak bias to decline to cutoff to start the next cycle.
The blocking oscillator frequency is raised, therefore, by inserting positive dc control voltage to make the grid voltage less negative.
Synchronizing transistor oscillators. The same ideas apply for triggered sync and dc control voltage. Positive sync voltage is needed at the base of an NPN transistor to trigger a blocking oscillator. Or, negative sync triggers a PNP transistor. Similarly, more positive dc control voltage at the base of an NPN transistor increases the forward bias to raise the frequency.
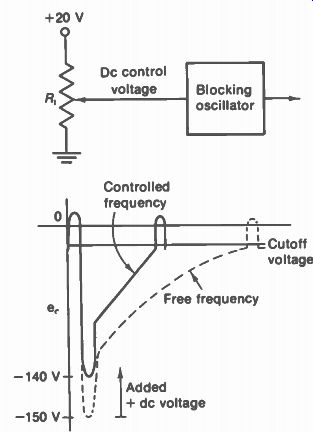
FIGURE 20-17 ADDING POSITIVE DC CONTROL VOLTAGE AT THE GRID TO RAISE THE
FREQUENCY OF THE BLOCKING OSCILLATOR.
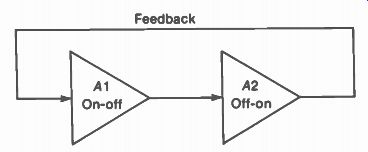
FIGURE 20-18 SWITCHING ACTION BETWEEN THE TWO AMPLIFIER STAGES IN A MULTIVIBRATOR.
Methods of coupling the sync. In Fig. 20-11, the 0.02-µF C, couples the vertical sync pulses from the sync separator to the grid of the triode tube. In Fig. 20-13, a separate winding on the blocking oscillator transformer couples the sync pulses to the transistor base. Either capacitive or inductive coupling can be used for the sync, with either tubes or transistors. However, transistor circuits generally have a separate sync winding on the blocking oscillator transformer in order to provide isolation between the oscillator and sync circuits.
20-9 Types of Multivibrator Circuits
The multivibrator (MV) is a pulse generator like the blocking oscillator, but no transformer is needed. As shown in Fig. 20-18, two amplifier stages A1 and A2 are used for the MV. They can be tubes or transistors. Feedback is used to make the output of one stage drive the input of the other. Since each amplifier inverts the polarity of its signal, the feedback is positive in the same polarity as the original input. Therefore, oscillations can be produced. The oscillations are in the on-and-off conditions for each stage. When one stage conducts, it cuts off the other. For instance, A1 conducting forces A2 into cutoff. Then, as soon as A2 starts to con duct again it cuts off Al. The rate at which the stages are cut off is the oscillator frequency.
One cycle includes cutoff for both stages. In the output circuit, the MV is basically a square-wave or rectangular-wave generator.
Multivibrator circuits can be classified according to the method of feedback. Then we have the following types: Plate-coupled MV. The plate of A1 drives the control grid of A2, and the plate of A2 drives the grid of A1, through the feed back line.
Cathode-coupled MV. The plate of A1 drives the control grid of A2, but A2 is coupled back to A1 only through a common cathode resistor for both stages.
Collector-coupled MV. This transistor circuit is similar to the plate-coupled MV. The collector corresponds to the plate and the base to the control grid.
Emitter-coupled MV. This transistor circuit is similar to the cathode-coupled MV. The emitter corresponds to the cathode, with an emitter resistance that is common to both stages.
The many applications of multivibrators include sawtooth generators, square-wave generators, trigger switches, and frequency dividers.
Multivibrators are also classified according to stability. A stable stage will remain in the off condition until it is triggered into conduction by a pulse from an external circuit. Three classes are: Astable MV. Neither stage is stable, as one can cut off the other, at the MV repetition rate.
This type is simply a free-running multivibrator.
Monostable MV. This circuit has one of the stages stable.
Bistable MV. This circuit has both stages in the stable condition.
The bistable MV and monostable MV are trigger circuits. This means they need an input pulse to upset the stable stage. Two important types are the Schmitt trigger circuit and the Eccles-Jordan trigger circuit. The Schmitt trigger circuit is similar to a cathode-coupled or emitter-coupled MV, but the trigger is not free running. Also, the Eccles-Jordan trigger is similar to a plate-coupled or collector-coupled MV, but the trigger circuit needs to be driven by input pulses. These triggers are also called flip-flop circuits, indicating that they can change abruptly from cutoff to conduction. After one stage flips into conduction because of the input pulse, it flops back into cutoff because of drive from the opposite stage. One application, of trigger circuits is producing square-wave output from sine-wave input pulses.
20-10 Plate-coupled Multiviorator
The basic circuit in Fig. 20-19 illustrates how A1 cuts off A2 and then A2 cuts off A1 at the oscillating frequency of the MV. The essential facts in the operation are:
1. Conditions are reversed when the stage that was cut off starts to conduct.
2. With capacitive coupling to each grid circuit, the period of cutoff depends mainly on the R _pC,. time constant.
The reason why conduction in one stage can cut off the other is the fact that when the plate current i _p increases from zero, the i„R, drop reduces the plate voltage e _p. This drop in positive e _p is a negative-going voltage pulse to the next grid.
At the start of operation in Fig. 20-19, plate voltage is applied, plate current begins in both tubes, and the MV immediately begins oscillating. The amount of plate current cannot be exactly the same in A1 and A2 even when both use the same supply voltage and equal values of R _p. No matter how small this difference in plate current may be, it is immediately amplified, and the result is that one tube conducts while the other is cut off. Assume that A1 conducts slightly more than A2 when plate voltage is applied. This drives the grid A2 slightly more negative. The negative signal is amplified and inverted to provide feedback that drives the grid ot A1 more positive, which in turn allows the first stage to drive the grid of A2 still more negative.
The amplification of the unbalance in the stage takes place almost instantaneously to drive the grid of A2 to cutoff immediately. The tube remains cut off for a period of time that depends upon the R2C, grid time constant, as C, discharges.
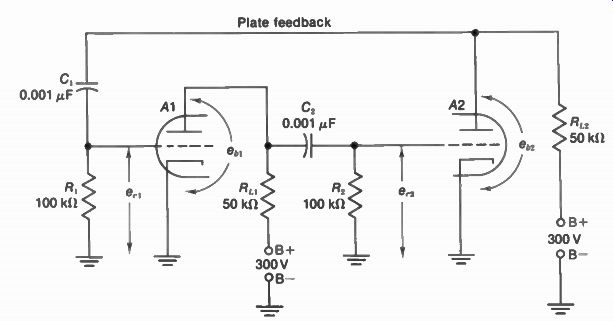
FIGURE 20-19 BASIC PLATE-COUPLED, FREE-RUNNING, SYMMETRICAL MULTIVIBRATOR
CIRCUIT.
The grid voltage of A2 then declines toward zero. As soon as the grid voltage is reduced to less than cutoff, plate current begins to flow. Then conduction in A2 cuts off A1. Now the cutoff time depends on the R,C, time constant. As a result, the slight initial unbalance sets up a regenerative switching action, with first one stage conducting and then the other.
Each stage conducts for a period equal to the time the other is cut off.
Analysis of multivibrator waveforms. Beginning at time A in Fig. 20-20, A2 has just been cut off because of conduction in A1. Assume that 4 mA of i _p flows through the 50-ohm R,. of the first tube, producing a 200-V drop in plate voltage.
Since the plate-to-cathode voltage applied across the R,C, coupling circuit is reduced abruptly from 300 V to 100 V, C, must discharge.
Instantaneously, the entire 200-V drop in voltage is developed across R _p with the grid side negative, cutting off A2.
As C, discharges, the voltage across R, declines toward zero with the typical RC discharge curve shown. When the grid voltage is down to cutoff, A2 begins to conduct plate current. The resultant decrease of e t , in A2 drives the grid of the first tube more negative, reducing its plate current and increasing the plate voltage. This drives the grid of A2 more positive, further reducing the plate voltage and allowing A2 to drive A1 still more negative. This amplification of the unbalance in the stage reverses the action of the two tubes almost instantaneously, with A1 now cut off and A2 conducting, as shown at time B.
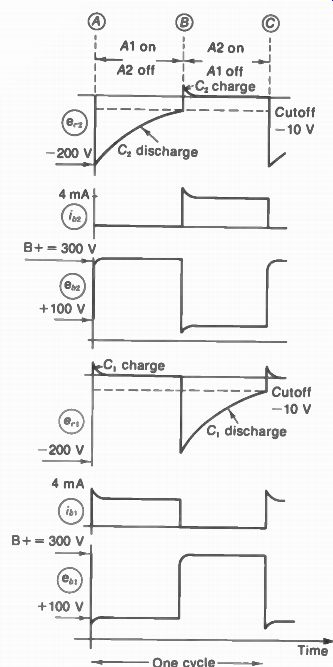
FIGURE 20-20 PLATE AND GRID WAVEFORMS FOR THE PLATE-COUPLED MV IN FIG 20-19
The plate-to-cathode voltage of the first tube, now cut off, rises immediately to B+, driving the grid of A2 positive. C, charges rapidly through the low resistance of the grid-to cathode circuit of A2, and the grid voltage is reduced to zero very soon, as C, becomes completely charged. The grid voltage for A2 remains at zero and the zero-bias plate current flows as long as A1 remains cut off.
Meanwhile, the coupling capacitor C, for the first tube is discharging through its grid resistor R _p and the negative grid voltage of A1 declines toward zero. When cutoff voltage is reached at time C in the illustration, conduction begins again in the first stage, cutting off A2 to repeat the cycle.
The waveforms for both stages are exactly the same but of opposite polarity, since one is conducting while the other is cut off. The period of conduction for each stage is equal to the cut off time of the other. It is the change from cutoff to conduction that initiates the switching operation.
The output voltage from either plate is a symmetrical square wave, as the plate voltage rises sharply to B+, remains at that value for a period equal to the cutoff time, and then drops sharply to some low value resulting from plate current flow. The slight departure from square corners is caused by charging of the coupling capacitors. The output is symmetrical because both tubes are cut off the same amount of time.
Multivibrator frequency. The time from A to C in Fig. 20-20 is one complete cycle, including a complete flip-flop of operating conditions The frequency may be from 1 to 100,000 Hz, depending primarily on the RC time constant of the grid coupling circuits. The period of one cycle is exactly equal to the sum of the cutoff periods for both stages. From the grid waveshapes ii Fig. 20-20, the cutoff time can be calculated as 0.0003 s, which is a half-cycle. For both tubes in this symmetrical MV, the total cutoff period is 2 0.0003 = 0.0006 s. The frequency then is 1/0.0006 s, or 1,667 Hz, approximately.
20-11 Cathode-coupled
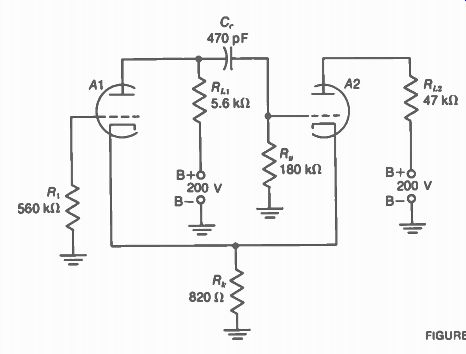
FIGURE 20-21 CATHODE-COUPLED MULTIVIBRATOR.
Multivibrator
As shown in Fig. 20-21, the coupling for feed back from A2 to A1 is produced by the common cathode resistor R4. As a result, this MV circuit is unsymmetrical. A2 must be cut off for a longer time. than A1 because A2 has the R„C, coupling circuit, while A1 does not.
How A2 is cut off. Referring to Fig. 20-21, when plate voltage is applied, both tubes start to conduct. The flow of plate current in A1 reduces its plate voltage, driving the grid of A2 negative.
The plate current in A2 is reduced because of the negative grid signal. This decreases the cathode voltage across R _p. Then A1 conducts more plate current, driving the grid of A2 more negative. The unbalance is amplified to drive A2 to cutoff almost instantaneously.
A2 is held cut off during the time C,. discharges through R _p R _p and the plate to-cathode resistance of A1, which is now con ducting. The negative grid voltage across R _p declines exponentially with the normal capacitor discharge curve until the grid voltage for A2 has been reduced to the grid cutoff voltage.
Then A2 starts to conduct.
How A1 is cut oft. With the plate current of A2 now flowing through the common cathode resistor, the cathode bias for A1 is increased, driving its grid negative. Plate current in A1 is reduced because of the additional cathode bias, allowing its plate voltage to rise toward the B+ of 200 V. The increase in plate voltage drives the grid of A2 more positive as C,. charges from the B supply through the grid-to-cathode circuit of A2 and R1,. With A2 driven more positive, its plate current increases, and more bias is developed across R, as the cathode voltage follows the applied grid voltage. The action is cumulative and results in A1 being cut off almost instantaneously by the plate current of A2. Now A1 is cut off. This cutoff time depends on how long it takes C,. to charge. Until C,. charges, the grid of A2 is positive enough to produce the amount of plate current needed to raise the cathode voltage enough to cut off A1.
It should be noted that the grid of A1 is at ground potential, since there is no grid-coupling circuit from the other tube. Therefore, A1 remains cut off as long as the cathode voltage exceeds its cutoff voltage, because this is the only input voltage.
When the cathode voltage drops below the cutoff value, because of decreasing plate current in A2, then A1 can start to conduct again. Then conduction in A1 cuts off A2 again to repeat the cycle. The circuit operates as a free-running multivibrator, therefore, as each tube alternately conducts to cut off plate current in the other tube. The waveshapes are shown in Fig. 20-22.
Note the following points:
1. The e„ voltage is zero with respect to ground because there is no input to this grid. Therefore, no waveshape is shown for the e r, grid voltage.
2. Instead, the e„, voltage is shown for A1 . This is the same as e k but with inverted polarity.
3. When C„ charges by grid current, in this example e„ is reduced from +12 V to +4 V. At this e _p the plate current of A2 is reduced enough to drop e k to 6 V. This is not enough to keep A1 cut off. Then A1 conducts to produce negative grid drive that cuts off A2.
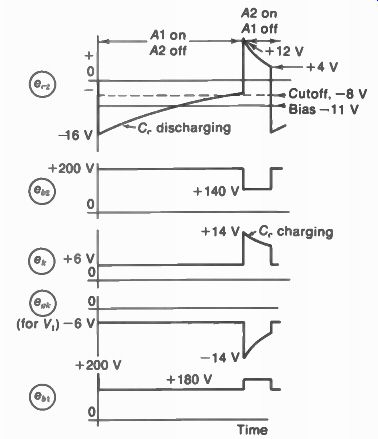
FIGURE 20-22 WAVEFORMS FOR THE CATHODE-COU PLED MV IN FIG. 20-21.
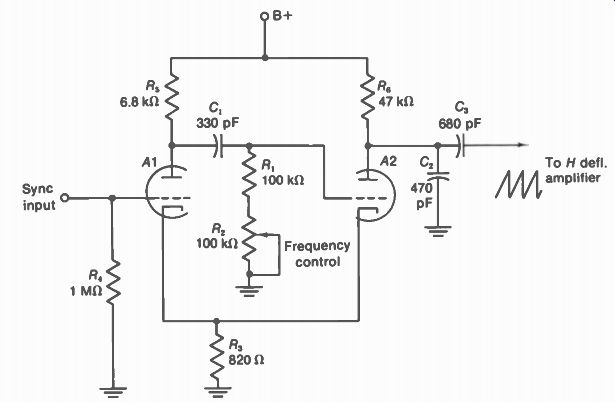
FIGURE 20-23 HORIZONTAL SAVVTOOTH GENERATOR USING CATHODE-COUPLED MV.
Summary of operation. A2 is cut off by negative grid voltage when the plate voltage of A1 drops with conduction. Therefore, the cutoff period for A2 depends on the grid time constant for C, to discharge through However, A1 is cut off by the cathode voltage across Rk produced by maximum plate current in A2. The reason why A2 is not cut off when the increased voltage across Rk cuts off A1 is that this is time when the grid of A2 is driven positive from the plate of Al. In fact, it is the positive grid drive at A2 that makes the cathode voltage rise.
The cathode voltage e k remains high enough to cut off A1 until C, is charged by grid current to the point when the positive grid drive on tube 2 drops close to zero. Therefore, the cutoff period for tube 1 depends on the time constant for charge of C„. This charging path is through the low resistance of approximately 2 k-o internal grid-cathode resistance of A2 when grid current flows, through Rk . and R _p, in tie A1 plate circuit while it is cut off. As a result, C, charges fast for a short period of cutoff in A1 compared with the slow discharge of C„ through R2 for a long period of cutoff in A2. The cathode coupled multivibrator, therefore, automatically produces unsymmetrical output, as A2 must be cut off for a much longer time than A1.
20-12 Multivibrator Sawtooth Generator
An unsymmetrical multivibrator can be used as a sawtooth generator by connecting a sawtooth capacitor in the plate circuit of the tube that is cut off a long time and conducting a short time.
Then this stage functions as a discharge tube. In the cathode-coupled multivibrator this tube is the one with the RC coupling circuit for grid drive from the plate of the opposite tube.
Figure 20-23 shows a typical circuit for a horizontal sawtooth oscillator. C, is the saw-tooth capacitor in the plate circuit of A2. While negative drive from A1 holds A2 cut off for a relatively long time C, charges toward B+ through R. The charging action produces a linear rise for the trace part of the sawtooth voltage across C2. When the grid of A2 is driven positive, because of cutoff in Al, then C, can discharge fast for the retrace part of the sawtooth wave.
The path of discharge current is through R„ and the low internal plate-cathode resistance in A2, which is now conducting. The sawtooth voltage output across C2 is coupled by C, to the grid circuit of the horizontal output stage. Figure 20-24 illustrates how the sawtooth voltage output corresponds to cutoff and conduction of the A2 stage.
Note that the variable resistance R, in the grid circuit of A2 serves as the frequency control. Decreasing R, reduces the cutoff time for A2 to raise the free frequency of the oscillator.
Increasing R, lowers the oscillator frequency.
The grid resistance for A1 does not control the oscillator frequency because its grid voltage is determined by the cathode voltage across Rt. However, this grid is the best connection for injecting sync because of isolation from the oscillator voltages.
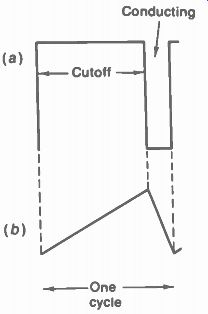
FIGURE 20-24 HOW SAWTOOTH VOLTAGE IS PRODUCED BY THE CATHODE-COUPLED MV IN
FIG 20-23 (a) RECTAN GULAR PLATE VOLTAGE OF A2 WITHOUT SAWTOOTH CAPACITOR
C2. (b)CORRESPONDING SAWTOOTH VOLTAGE WITH C,
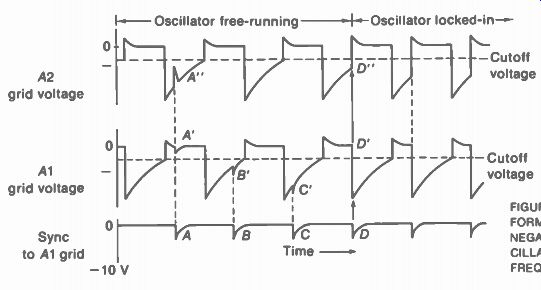
FIGURE 20-25 GRID-VOLTAGE WAVE FORMS IN MV SYNCHRONIZED BY NEGATIVE TRIGGER
PULSES. THE OSCILLATOR IS PULLED INTO THE SYNC FREQUENCY AT TIME D.
20-13 Synchronizing the Multivibrator
Either positive or negative sync polarity can be used with multivibrators. A positive pulse applied to the grid of a cutoff tube can cause switching action if the pulse is large enough to raise the grid voltage above cutoff. This idea corresponds to triggering the grid of a blocking oscillator with positive pulses. However, negative trigger pulses can be used, particularly in the cathode-coupled multivibrator. The requirement is that negative pulses applied to the conducting tube be amplified and inverted to produce positive pulses large enough at the grid of the cutoff tube to make it conduct.
Synchronization with negative trigger pulses is illustrated in Fig. 20-25. At time A, the negative pulse at the grid of A1 reduces its plate current, but the amplified pulse is not positive enough at the grid of A2 to make it conduct.
Therefore, the pulse has no effect on switching.
The negative pulses B and C also have no effect because they are applied to A1 while it is cut off.
However, at time D, the negative sync pulse is inverted and amplified enough to drive A2 from cutoff into conduction. Then operating conditions are switched as A2 conducts and cuts off. Once A2 is triggered by the sync voltage, the oscillator operates at the sync frequency as each sync pulse triggers each cycle.
Just as in blocking oscillator synchronization, the free frequency of the multivibrator must be slightly lower than the sync frequency.
Then the pulses occur just before the natural switching action would take place by itself, when the oscillator is ready for triggering.
Negative dc control voltage. The multivibrator frequency can also be varied by controlling its dc grid voltage. This method applies when the oscillator is controlled by an AFC circuit for horizontal synchronization. In the cathode-coupled multivibrator, negative dc control voltage at the A1 grid raises the oscillator frequency. Its added negative grid voltage reduces plate current when A1 conducts. The result is a smaller drop in plate voltage, and less negative drive at the A2 grid. Then less time is needed for C,. to discharge down to cutoff for conduction in A2.
With a shorter cutoff time for A2, the multivibrator frequency is increased.
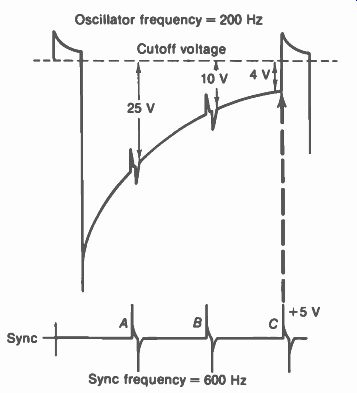
FIGURE 20-26 TRIGGER PULSES FORCING MV TO OPERATE AS FREQUENCY DIVIDER AT
ONE-THIRD THE SYNC FREQUENCY. EVERY THIRD PULSE WILL TRIGGER THE MV.
20-14 Frequency Dividers
Either the multivibrator or the blocking oscillator can be triggered at a sub-multiple of the sync frequency to act as a frequency divider. In Fig. 20-26, as an example, the input sync frequency of 600 Hz is divided by 3 to provide 200 Hz for the frequency of the MV output. The circuit is a divider, as the oscillator output frequency is an exact submultiple of the sync frequency input.
The sync voltage is coupled to the grid that needs positive pulses for triggering. For minimum sync voltage input, the free frequency of the oscillator is set slightly below the desired submultiple of the sync frequency. Then the oscillator is forced to lock in at the exact submultiple frequency because of the trigger pulses.
Note that the third sync pulse labeled C in Fig. 20-26 has enough amplitude to trigger the oscillator from cutoff into conduction. Pulses A and B do not affect the oscillator because they do not have enough amplitude to raise the grid voltage above cutoff. The reason is that the free frequency slightly under 200 Hz has been set much lower than the sync frequency of 600 Hz.
However, the third pulse C does trigger the oscillator into conduction. Then every third pulse triggers one oscillator cycle to produce output at one-third the sync frequency.
The voltages in Fig. 20-26 indicate how the frequency-division factor can be changed with more sync input. If the sync is increased to more than 10 V, pulse B will have enough amplitude to trigger the oscillator. Then it divides by 2 with output at 300 Hz, locked in by every second sync pulse. Or, sync voltage above 25 V could lock in the oscillator at the sync input frequency, without any frequency division. This relatively large sync voltage to trigger the oscillator for this example is necessary because the oscillator free frequency is not close to the sync frequency.
FIGURE 20-27 FREE-RUNNING, COLLECTOR-COUPLED. SYMMETRICAL MULTIVIBRATOR
20-15 Transistors in Multivibrator Circuits Two common-emitter stages are used for the amplifiers. Collector coupling for feedback corresponds to a plate-coupled MV. A common resistor for both emitter circuits corresponds to cathode coupling. Remember, though, that a transistor is cut off with zero bias. About 0.6-V forward voltage is needed for conduction in a silicon transistor. A constant value of saturation collector current flows with about 0.8-V forward bias, assuming a load resistance that drops the collector voltage below the base voltage.
The collector-coupled MV in Fig. 20-27 is a free-running, symmetrical MV with square wave output from either stage. C2 and R.2 provide coupling to the base of Q2. Feedback to the base of Q1 is provided by C, and R. Note that R, and R2 return to the +12-V supply in order to provide forward bias at the base for the NPN transistors. However, when the collector voltage of one stage drops, the negative drive at the next base produces cutoff. The multivibrator oscillates, with Q1 and Q2 alternately off and on as conduction in one stage cuts off the other.
20-16 Sawtooth, Trapezoidal, and Rectangular Voltages and Currents
In magnetic scanning, it is the current in the deflection coils that must have a sawtooth waveshape. The reason is that the magnetic field of the current deflects the electron beam.
With sawtooth current through the colts, the voltage across the inductance is not the same waveshape because inductance opposes any change in current.
We can make a comparison with the more familiar example of inductance L in sine-wave circuits. The self-induced voltage across L produced by changes in current is always 90 deg out of phase with the current through L This concept of phase angle, however, only applies to sine waves. The corresponding idea in non sinusoidal circuits is that inductance changes the waveshape of the voltage, compared with the current. Similarly, capacitance C can produce a 90° phase angle with sine waves, but the waveshape is changed in nonsinusoidal circuits.
For resistance R, however, there is no change in phase angle or waveshape between the current and voltage waveforms. More details of wave shaping with RL and RC circuits are described in Appendix D, on RC Time Constant. However, the main facts that apply to deflection circuits are illustrated in Figs. 20-28 to 20-31.
Sawtooth i„ and v„ for resistance. Figure 20-28 shows that with sawtooth current through R, the voltage across R also has the sawtooth wave form. Resistance does not concentrate the magnetic field like an inductance, or store electric charge like a capacitance. Therefore, R does not have any reaction to a change in voltage or current.
FIGURE 20-28 SAWTOOTH CURRENT i„ AND VOLTAGE v„ FOR RESISTANCE R.
FIGURE 20-29 SAWTOOTH CURRENT AND RECTANGU LAR VOLTAGE v, FOR A PURE INDUCTANCE L.
FIGURE 20-30 TRAPEZOIDAL VOLTAGE v _p WITH SAW TOOTH CURRENT FOR AN RL CIRCUIT.
Sawtooth i, and rectangular v, for inductance. See Fig. 20-29. The amount of induced voltage across L depends on the rate of change of current. A faster change in i t produces more self-induced voltage v,. Furthermore, for a constant rate of change in i _p the amount of v t is constant. As a result, v,. in Fig. 20-29 is at a relatively low level during the slow rise in i 1 . during trace time. Then the fast drop in i t produces a sharp voltage peak, or spike, for the fast retrace or flyback. The polarity of the flyback pulse must be opposite to the trace voltage because it. is decreasing instead of increasing. Therefore, sawtooth current in L produces rectangular voltage. Or, to produce sawtooth current in an inductance, it needs rectangular voltage applied.
Trapezoidal voltage for an RL circuit. This waveform combines the sawtooth voltage needed for R with the rectangular voltage needed for L, as shown in Fig. 20-30. With saw tooth current through a circuit having inductance and resistance, therefore, the voltage waveform is a trapezoid. Or to produce saw tooth current in a circuit with R and L, trapezoidal voltage must be applied.
Voltage waveshapes for horizontal deflection. The horizontal scanning coils are mainly inductive. Because of the large self-induced voltage produced by the fast horizontal flyback, the effect of L is much greater than the effect of R. Therefore, the voltage waveform is rectangular across the horizontal yoke coils and output transformer. The polarities of i and v may be as shown in Fig. 20-29 or inverted with positive flyback pulses.
Voltage waveshapes for vertical deflection. The self-induced voltage is smaller at the lower scanning frequency. Therefore, both R and L must be considered. With sawtooth current, the result is trapezoidal voltage across the RL circuit. The polarity may be as in Fig. 20-30, but can be inverted. Figure 20-31a illustrates a negative-going sawtooth waveform, and Fig. 20-31b, rectangular v, with a positive spike for flyback. The resultant trapezoid in Fig. 20-31c has the inverted polarity usually produced in the vertical output circuit.
FIGURE 20-31 INVERTED POLARITIES OF DEFLECTION VOLTAGE WAVEFORMS. (a) SAWTOOTH; (b) RECTANGULAR: (c) TRAPEZOIDAL.
FIGURE 20-32 SAWTOOTH CAPACITOR WITH PEAKING RESISTOR TO PRODUCE TRAPEZOIDAL VOL-AGE.
Trapezoidal voltage generator. This voltage waveform is often needed from the deflection °senator to drive the output stage. A circuit for generating trapezoidal voltage is shown in Fig. 20-32. It is the usual circuit for producing saw tooth voltage, but with the peaking resistor R _p added in series with C„. The peaking resistor produces voltage spikes that are combined with the sawtooth voltage across C. for trapezoidal voltage output.
The value of 8 k-o for R„ is small compared with 2 M-O for R. Therefore, the voltage across R _p is very small while C. is charging from B+ through R, when the discharge tube is cut off.
On discharge, though, R _p is relatively large compared with the low resistance of the conducting discharge tube. Then C. discharges fast, with a high value of discharge current, to develop a large negative pulse of voltage across R _p. This narrow pulse or spike is a negative voltage because it is produced by discharge current.
The voltages across C. and R _p are in series with each other across the output circuit.
Therefore, the trapezoidal voltage at point T to ground is the sum of the positive-going saw tooth voltage across C, and the negative voltage spikes across R _p. S-shape correction. In many cases the desired scanning current is not a perfectly linear saw tooth . Actually, this would stretch the raster at the edges for a wide-angle picture tube with a flat faceplate. The reason is that the edges of the screen are further away from the point of deflection, compared with the middle. To correct the problem, an S-shaping capacitor is often used for the sawtooth current. This may be in series with the yoke coils as a coupling capacitor, or in a shunt path. For both cases, the S capacitor resonates with the yoke inductance to add a sine-wave component. The result is to round off the peak amplitudes at the top and bottom of the sawtooth wave, corresponding to the edges of the raster. The S-shaping can be applied to vertical scanning and horizontal scanning.
20-17 Incorrect Oscillator Frequency
If the vertical hold control cannot stop the picture from rolling, even for an instant, this indicates the vertical oscillator is operating at the wrong frequency since it cannot be adjusted to 60 Hz. With the oscillator frequency lower than 60 Hz, the picture rolls upward; above 60 Hz the picture rolls downward.
Vertical roll. The reason for the rolling picture is illustrated in Fig. 20-33 for the case of vertical oscillator frequency too high. Notice the relative timing of vertical blanking in the composite video signal and vertical retrace in the sawtooth vertical deflection current. When both are at the same frequency, every vertical retrace occurs within vertical blanking time. Then vertical blanking is not visible at the top and bottom edges of the frame. However, with the vertical frequency too high, the sawtooth cycles advance in time with respect to the 60-Hz blanking pulses. Then vertical blanking occurs during trace time, instead of during retrace. Further more, each sawtooth advances into trace time for succeeding blanking pulses. As a result, the black bar produced across the screen by the vertical blanking pulse appears lower and lower down the screen for successive cycles.
Remember that the information for the top of the picture as it is transmitted always comes immediately after vertical blanking.
When the vertical oscillator is locked in sync, each frame is reproduced over the previous frame and then the picture holds still. However, when the picture information and blanking in each frame are reproduced lower on the screen than the previous frame, the picture appears to roll down. The same idea applies to rolling up.
FIGURE 20-33 WHY THE PICTURE WITH BLANKING BAR ROLLS UP OR DOWN WHEN VERTICAL SCANNING FREQUENCY IS NOT AT 60 Hz.
The farther the vertical scanning
frequency is from 60 Hz, the faster the picture rolls. The upward rolling is usually slower than the downward rolling because the oscillator frequency changes more gradually at the high resistance end of the hold control for low frequencies. If the vertical oscillator frequency can be made as low as 30 Hz or 20 Hz, which are submultiples of 60 Hz, two or three duplicate pictures will be seen one above the other.
If the frequency is raised to 120 Hz, the bottom of the picture will be superimposed on the top, usually with reduced height in the raster.
The main factor in the frequency of a blocking oscillator or multivibrator is the R,C,. time constant in the grid circuit. When either R„ or O. has a value too small, the oscillator frequency is too fast. When the R,C,. time constant is too long, the oscillator frequency is too slow.
Diagonal bars. When the horizontal oscillator is locked into the sync frequency of 15,750 Hz, the line structure holds together to show a complete picture and horizontal blanking is in visible at the left and right edges. If the oscillator is off the correct frequency, the picture will tear into diagonal segments. The diagonal black bars are produced by horizontal blanking pulses. The picture is in segments because the horizontal AFC circuit prevents individual horizontal lines from tearing apart, as the frequency cannot change from line to line. When the number of diagonal bars is continually changing, this shows the AFC circuit is not controlling the oscillator. When the bars are steady, the AFC circuit is holding the oscillator but at the wrong frequency.
In either case, the horizontal blanking pulses produce diagonal black bars when the horizontal oscillator is off the correct frequency. If the frequency differs from 15,750 Hz by 60 Hz, there will be one diagonal bar.
Every 60-Hz difference between the oscillator frequency and 15,750 Hz results in another diagonal bar. As the bars increase in number, they become thinner with less slope. The bars slope down to the left when the oscillator frequency is below 15,750 Hz, or up to the left above 15,750 Hz.
The reason for the diagonal bars is illustrated in Fig. 20-34, for the case of horizontal oscillator frequency too high. Notice how successive sawtooth cycles advance in time with respect to the blanking pulses transmitted at 15,750 Hz. The blanking pulse then goes into trace time. Each blanking pulse is 10 As wide,
reproducing black for about one-sixth of every line. Remember that the left edge of the picture is always immediately after horizontal blanking.
Furthermore, the blanking goes more into trace time for successive sawtooth cycles. For each lire, then, the black is more to the right.
Since vertical scanning is occurring at the same time, the black area moves down as it progresses to the right. Only five scanning lines are illustrated here, but if all the lines were shown the result would be one diagonal black bar from the top left corner to the bottom right corner. Then, the same action is repeated over the previous diagonal bar. The same idea applies to the case of oscillator frequency too low, but the black would start at the top right corner and progress diagonally down to the left.
Between the black diagonal bars, the picture information is reproduced in the wrong position to such an extent that the picture usually cannot be recognized. Near the bottom of each bar, the picture information is actually reversed in its left-right position. Also, the horizontal flyback during visible time stretches black or white information all the way across the screen.
FIGURE 20-34 WHY THE PICTURE TEARS DIAGONALLY WHEN THE HORIZONTAL SCANNING FREQUENCY IS NOT AT 15.750 Hz.
SUMMARY
1. Sawtooth voltage is produced by charging a capacitor C, slowly through a high resistance for the slow linear rise and discharging the capacitor fast through a low resistance for the retrace. One complete cycle includes trace and retrace.
2. A peaking resistor in series with C. on discharge produces a voltage spike that combines with the sawtooth to provide trapezoidal voltage waveshape.
3. The blocking oscillator is cut off for a relatively long time and conducting for a short time. Therefore, it can control the charge and discharge of a sawtooth capacitor. In the plate circuit, C. charges while the oscillator is cut off and discharges through the oscillator while it is conducting. The sawtooth voltage output is at the frequency of the blocking oscillator.
4. The blocking oscillator can be synchronized by positive trigger pulses at the grid.
The free-running frequency is adjusted slightly below the sync frequency to allow every pulse to force the tube into conduction.
5. The multivibrator uses two stages that are alternately conducting and cut off. The period of conduction for each depends on the cutoff time of the other. One cycle includes cutoff for both stages.
6. In the plate-coupled multivibrator in Fig. 20-19, the plate circuit of each tube is RC-coupled to drive the grid of the opposite tube. Conduction in one tube drops its plate voltage to drive the next grid negative beyond cutoff. The collector-coupled MV with transistors in Fig. 20-27 corresponds to the plate-coupled MV.
7. In the cathode-coupled multivibrator in Fig. 20-21, A1 cuts off A2 through the R„C,. coupling circuit, but A2 cuts off A1 through R„ . The output is unsymmetrical, as A2 is cut off a relatively long time and conducting a short time. Therefore, a saw tooth capacitor can be connected in the plate circuit of A2, serving as a discharge tube, to provide sawtooth voltage output at the multivibrator frequency. An emitter-coupled MV with transistors corresponds to the cathode coupled MV.
8. The cathode-coupled multivibrator can be synchronized by negative pulses at the A1 grid, which are amplified and inverted to become positive pulses at the grid of the A2 stage.
9. The free frequency of a blocking oscillator or cathode-coupled multivibrator is usually adjusted by making the grid resistor variable, to set the R„C. time constant. Larger values for R„ or C,. lower the oscillator frequency; decreasing R,C, raises the frequency.
10. The sawtooth voltage output can be adjusted by varying the resistance in series with Cs on charge. This size control increases the amplitude when the resistance is decreased; more resistance decreases the amplitude. Lower amplitudes allow better linearity, as a smaller part of the RC charge curve is used.
11. R has sawtooth current and voltage waveshapes; L has sawtooth current and rectangular voltage; an RL circuit has sawtooth current and trapezoidal voltage.
12. When the vertical oscillator is not at 60 Hz, the picture, with the black horizontal bar produced by vertical blanking, rolls up or down the screen. When the horizontal oscillator is not at 15,750 Hz, the picture tears into diagonal segments, with black diagonal bars produced by the horizontal blanking pulses.
Sell-Examination (Answers at back of guide)
Part A Answer True or False.
1. One cycle of the sawtooth waveform includes trace and retrace.
2. In a sawtooth wave of negative polarity, the trace is faster than the retrace.
3. The sawtooth waveform can be used for either current or voltage.
4. Sawtooth current through an inductance produces rectangular voltage with a big pulse during retrace.
5. The sawtooth capacitor charges through the discharge tube while it is cut off.
6. The vertical oscillator cannot operate without sync input.
7. The horizontal oscillator must be operating for the receiver to have flyback high voltage.
8. If the vertical oscillator does not operate, there will be just a bright line across the center of the screen.
9. Increasing the charging resistance for C. reduces the sawtooth voltage amplitude.
10. The free frequency of the oscillator must be set lower than the sync frequency.
11. When plate voltage drops, C. and R _p couple negative voltage drive to the next grid.
12. The cathode-coupled multivibrator can be used for a horizontal sawtooth generator.
13. In the cathode-coupled multivibrator, C. is in the plate circuit of the tube that has R,C,. coupling into its grid.
14. In a multivibrator, the sync voltage must drive the cutoff tube into conduction to lock in the oscillator at the sync frequency.
15. In a cathode-coupled multivibrator, the free frequency depends on the R,C,. time constant.
16. In a cathode-coupled multivibrator, the voltage across Rk cuts off both tubes at the same time.
17. When the picture rolls up, the vertical oscillator frequency is more than 60 Hz.
18. Two diagonal bars sloping down to the left indicate the horizontal oscillator frequency is 120 Hz below 15,750 Hz.
19. When the picture can be made to roll up and down with the vertical hold control but does not lock in, this indicates the trouble is no vertical sync.
20. If the oscillator frequency is increased, the sawtooth voltage across C. will decrease.
Part B FUI in the required value.
1. A 0.05-uF sawtooth capacitor charging through 3 Mi2 has a charge time constant of s.
2. The same capacitor discharging through 8 k-o and 11(0 in series has a discharge time constant of s.
3. A 0.01-µF capacitor charged to -60 V will discharge through a 3-Mhz resistor down to -6 V in s. (See Appendix D.)
4. If the vertical blocking oscillator transformer has a resonant frequency of 2,000 Hz, the time for one-half cycle of ringing is /As.
5. In the plate-coupled MV of Fig. 20-19, if each tube is cut off for 500 us, the oscillator frequency is _ _ _ _ Hz.
6. In the cathode-coupled MV of Fig. 20-23, if A1 is cut off 7.5 As and A2 is cut off 58 As, the sawtooth voltage output frequency is Hz.
7. In Fig. 20-23, when the cathode current through R„ is 20 mA, the cathode voltage equals _ _ __ V.
8. In the collector-coupled MV of Fig. 20-27, if the supply voltage is increased to 28 V. the peak-to-peak output will be approximately V.
9. In Fig. 20-11, if the sawtooth voltage across C. varies between 140 V and 110 V. the peak-to-peak output equals V.
10. In Fig. 20-26, if the free frequency is set at 295 Hz, the oscillator frequency will lock in at _ Hz.
Essay Questions
1. What is the function of the vertical deflection oscillator? The horizontal deflection oscillator?
2. Why is the sawtooth waveshape required for linear deflection? In magnetic deflection, why is the sawtooth waveshape required for current in the coils?
3. Give two factors that affect linearity of the voltage rise across C,.
4. Give three factors that affect cutoff time of the blocking oscillator. Give one factor affecting conduction time.
5. Referring to the numbered steps in the e,. waveshape in Fig. 20-10, which numbers occur during conduction and which during cut off
6. Draw the schematic diagram of a blocking oscillator-discharge tube trapezoidal voltage generator for vertical deflection, using a single triode. Indicate typical values of all components. Label the height and hold controls.
7. Why is the free-running frequency of a blocking oscillator lower than the sync frequency? Why is the polarity positive for sync voltage at the grid? Why does the frequency increase when positive dc grid voltage is added?
8. Referring to the cathode-coupled multivibrator in Fig. 20-21, what determines cutoff time and conduction time for A2? Cutoff and conduction time for A1?
9. Referring to the cathode-coupled multivibrator in Fig. 20-23, draw the voltage waveshapes at each electrode of A1 and A2 in a ladder diagram, with one under the other to show the different voltages at similar times.
10. In a cathode-coupled multivibrator, why is the polarity negative for sync voltage at the grid of A1? Why is the free frequency set lower than the sync frequency? Why does negative dc voltage added to the A1 grid increase the frequency?
11. Describe briefly the function of the height control and vertical hold control in a vertical deflection oscillator.
12. In a circuit with the sawtooth capacitor in the plate of the blocking oscillator, why does the picture usually roll when the height control is adjusted?
13. Explain briefly why the height of the raster can decrease when the vertical oscillator frequency is much higher than 60 Hz.
14. Show the waveform of sawtooth current through a pure inductance and the corresponding voltage.
15. Give the function of the peaking resistor in a trapezoidal voltage generator.
16. If the vertical oscillator locks in at 30 Hz, what will be the effect on the picture? What will be the effect at 120 Hz?
17. Name four types of multivibrators based on the method of coupling, using tubes and transistors.
18. Name three types of multivibrators based on stability.
19. What is the difference between a free-running multivibrator and a trigger circuit?
20. Name two types of MV trigger circuits.
21. Name five components or voltages that affect the frequency of a multivibrator or blocking oscillator.
22. Referring to the blocking oscillator in Fig. 20-11, give the functions of all components.
23. Referring to the plate-coupled MV in Fig. 20-19, give the functions of all components.
24. Referring to the collector-coupled MV in Fig. 20-27, give the functions of all components.
25. If R _p in Fig. 20-23 opens, what will be seen on the screen in a receiver using flyback high voltage? 26. If the primary winding opens in the blocking oscillator transformer in Fig. 20-11, what will be seen on the screen?
Problems (Answers to selected problems at back of guide)
1. With 100 V applied, C initially uncharged, and a time constant of 2 s, calculate V,. for the following charging periods: (a) 0.2 s; (b) 1.0 s; (c) 1.14 s; (d) 2 s; (e) 4 s; (f) 10 s. (Hint: See Appendix D.)
2. For the examples in Prob. 1, draw a graph showing V, versus time in seconds.
3. (a) A capacitor charged to 10 V is connected to a 110-V source. How much is V,. after one time constant? (b) C is then discharged for one time constant. How much is V_c?
4. A capacitor has a time constant of 0.045 s for charge. A separate discharge path has a time constant of 0.0002 s. The capacitor is charged from a 100-V source for 0.009 s and then discharged for 0.001 s. Draw the resulting sawtooth voltage across C, to scale, in voltage versus time. What is the frequency of the sawtooth voltage?
5. A 1-uF capacitor charged to 100 V is discharged through a 1-M-ohm resistor. (a) How much is the peak discharge current at the start of discharge? (b) How much is the resistor voltage then? (c) How much is the discharge current after 0.707 s? (d) How much is the resistor voltage now?
6. R_ is 1 M-ohm, with 1-µF C,. charged to an average plate voltage of 150 V. Then the plate voltage drops to 50 V and remains at that value for 2 s. Draw a graph with values of current and voltage across R, during the discharge.
7. Calculate the voltage induced across a 1-H inductance when the current: (a) increases from 0 to 20 mA in 100 µs; (b) decreases from 20 mA to 0 in 100 µs; (c) decreases from 20 mA to 0 in 10 µs. [Hint: e = L (di/dt)]
8. A sawtooth waveform of current through an 8-mH inductance increases from 0 to 300 mA during 50 µs, then drops to zero in 5 µs. Draw the waveforms ofcurrent and corresponding induced voltage, with values.