The sound associated with the picture is transmitted in the same 6-MHz channel but on a separate rf carrier as a frequency-modulated signal . In frequency modulation (FM), the instantaneous frequency of the modulated rf carrier is made to vary with the amount of audio modulating voltage. In amplitude modulation (AM), the audio modulating voltage varies the carrier amplitude. FM has several advantages because the amplitude of the modulated rf carrier can be kept constant, while the audio information is in the frequency variations. The main benefit of FM is its freedom from noise and interference. However, AM is used for broadcasting the picture signal because multipath reception of FM picture signals would produce severe distortion, instead of ghosts.
It should be noted that the principles of FM for the television sound signal apply in the same way for the FM radio broadcast band of 88 to 108 MHz. In television, the carrier frequency is shifted ±25 kHz for the maximum amount of audio voltage. In the FM radio broadcast band, the maximum frequency swing is ±75 kHz. The range of audio modulation frequencies is 50 to 15,000 Hz for both services. Furthermore, the principles of FM apply to video tape recording, repeater stations, and other uses where the benefits of an FM signal are desired. The details of frequency modulation are explained in the following topics:
27-1 Frequency changes in an FM signal
27-2 Audio modulation in an FM signal
27-3 Definitions of FM terms
27-4 Preemphasis and deemphasis
27-5 Advantages and disadvantages of FM
27-6 Reactance tube
27-7 Receiver requirements for the FM sound signal
27-8 Slope detection of an FM signal
27-9 Discriminator operation
27-10 Center-tuned discriminator
27-11 The limiter
27-12 Ratio detector
27-13 Quadrature-grid FM detector
27-14 Sound IF alignment
27-15 The audio amplifier section
27-16 Complete circuits for the associated sound signal
27-17 lntercarrier buzz
27-18 Multiplexed stereo sound
27-1 Frequency Changes in an FM Signal
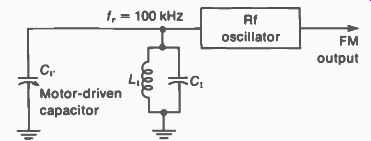
The idea of frequency modulation is illustrated in Fig. 27-1. This circuit is called a wobbulator, as the frequency is wobbled around the center value of 100 kHz by the motor-driven capacitor C. The inductance L, and fixed capacitance C, form the tuned circuit for the rf oscillator, resonant at 100 kHz. Also in the resonant circuit is the variable C1. Its shaft is driven by a motor which rotates the plates in and out of mesh to vary the oscillator frequency. The result is frequency modulation of the rf output from the oscillator.
Generally, C,- is made to rotate at the power-line frequency of 60 Hz. A capacitive semiconductor diode can be used instead of the motor-driven capacitor, however, to modulate the oscillator with the 60-Hz power-line voltage.
In either case, the rf output frequency is shifted periodically, at the rate of 60 Hz, to produce an FM signal. This method is used in sweep generators, where the rf signal sweeps through a range of frequencies at the repetition rate of 60 Hz.
FIGURE 27-1 AN EXAMPLE OF PRODUCING FREQUENCY MODULATION THE SHAFT OF THE
VARIABLE AIR CAPACITOR C, ROTATES IN AND OUT OF MESH TO CHANGE THE OSCILLATOR
FREQUENCY
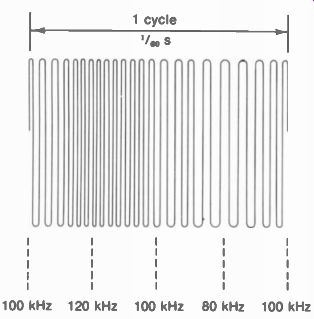
FIGURE 27-2 THE FM SIGNAL PRODUCED BY THE FREQUENCY MODULATION IN FIG. 27-1.
THE AMPLITUDE IS CONSTANT BUT THE INSTANTANEOUS FREQUENCY IS CONTINUOUSLY
CHANGING.
Referring to Fig. 27-1, assume that the oscillator is at 100 kHz with C, halfway in mesh.
Then the frequency varies above and below this center value of 100 kHz as the capacitor is driven in and out of mesh. With C, completely in mesh, the added capacitance in the tuned circuit is maximum and the output from the oscillator is at its lowest frequency. When C, is all the way out of mesh, the oscillator is at its highest frequency. For values between the two extremes, the oscillator frequency varies continuously between its highest and lowest values around the center frequency of 100 kHz. If the time for one complete revolution of C, is taken as '/,;„ s, the rf output of the oscillator will appear as in Fig. 27-2. The amplitude remains the same at all times but the frequency is changing continuously, with a swing of ± 20 KHz.
The frequency swing can be made almost any amount and has no relation to the repetition rate. For the same 60-Hz repetition rate, the carrier frequency could be varied by ± 30 kHz or ±50 kHz, depending on the amount of capacitance variation. Or, the same frequency swing of L , 20 kHz could be obtained at a rate slower or faster than 60 Hz by changing the speed of the shaft rotation.
27-2 Audio Modulation in an FM Signal
Figure 27-3 illustrates four examples of audio voltage producing frequency modulation of an rf carrier. An audio modulating amplitude of 10 V is assumed to produce a frequency change of 20 kHz with a 100-kHz carrier. Also, we assume linear modulation, so that one-half the audio voltage produces one-half this frequency swing, or twice the audio voltage would double the frequency swing. Notice that in all cases the amount of audio voltage decides the amount of frequency swing. The audio frequency is in the repetition rate of the frequency swings.
In Fig. 27-3a, the output of the transmitted signal is 100 kHz when the audio modulating voltage is at its zero value because this is the carrier frequency for no modulation. With modulation, the transmitted frequency continuously varies between the values of 100 ± 20 kHz. If the frequency increases for positive values of modulating voltage, it will decrease for negative values For the positive half-cycles of audio, the instantaneous frequency increases from 100 kHz to the maximum value of 120 kHz. The frequencies are between 100 and 120 kHz for values of audio voltage between 0 and +10 V. During the negative half-cycles the output frequency varies between 100 and 80 kHz as the audio voltage varies between 0 and -10 V. For the voltage shown in Fig. 27-3h, the amount of frequency change is the same 20 kHz because the audio amplitude is again 10 V. However, the rate at which the transmitted signal goes through its complete frequency swings is now 2,000 Hz because of the 2,000-Hz audio modulating frequency. Note that the carrier modulated by 2,000-Hz audio voltage goes through two complete cycles of frequency swing while the carrier modulated by 1,000 Hz goes through one complete cycle. A complete cycle of frequency swing is from the center frequency up to maximum, down to the middle frequency, decreasing to the lowest frequency value, and returning to center frequency.
For the audio modulating voltage shown in Fig. 27-3c, the maximum frequency change is only 10 kHz instead of 20 kHz, because the peak value of the audio is 5 V instead of 10 V. The rate at which the output signal swings about its center frequency is 1,000 Hz. For the modulating voltage of Fig. 27-3d, the maximum frequency change is still 10 kHz for 5V audio. However, the repetition rate is 2,000 complete swings per second, which is the audio frequency.
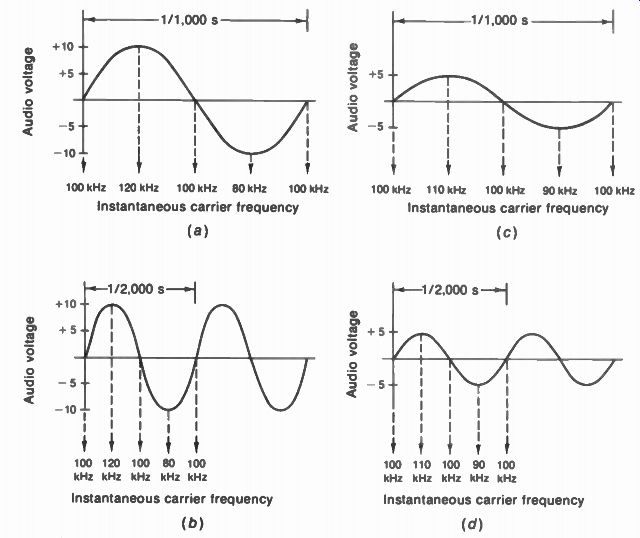
FIGURE 27-3 HOW THE AMOUNT OF FREQUENCY CHANGE IN THE RF CARRIER DEPENDS
ON THE AMOUNT OF VOLTAGE IN THE AUDIO MODULATION. (a) AUDIO OF 10 V AND 1,000
Hz, (b) AUDIO OF THE SAME 10 V BUT 2,000 Hz, (c) AUDIO REDUCED ONE-HALF TO
5 V. WITH FREQUENCY OF 1.000 Hz, (d) AUDIO OF 5V AND FREQUENCY OF 2.000 Hz
-- Instantaneous carrier frequency --
-------------------------

TABLE 27- 1 COMPARISON OF FM AND AM SIGNALS FM
Carrier amplitude is constant Carrier frequency varies with modulation Modulating-voltage amplitude determines rf carrier frequency Modulating frequency is rate of frequency changes in the rf carrier wave.
AM
Carrier amplitude varies with modulation Carrier frequency is constant Modulating-voltage amplitude determines rf carrier amplitude Modulating frequency is rate of amplitude changes in the rf carrier wave.
------------------------
The amount of frequency change in the transmitted carrier varies with the amplitude of the audio and should not be confused with the audio frequency. The frequency of the audio modulating voltage is the rate at which the carrier goes through its frequency swings. This determines the pitch of the sound as it is reproduced at the receiver. The amount of audio voltage determines the amount of frequency swing. This determines the intensity or loudness of the sound reproduced at the receiver. These characteristics of FM are summarized in Table 27-1.
27-3 Definitions of FM Terms
The following characteristics can help in explaining how an FM system operates.
Center frequency. This is the frequency of the transmitted rf carrier without modulation, or the output frequency at the time when the modulating signal voltage is at its zero value. The center frequency is also called rest frequency.
Frequency deviation. The frequency deviation is the change from the center frequency. As an example, an audio modulating voltage having a peak value of 5 V might produce the frequency change of 10 kHz at 2 V, and 50 kHz for its peak value of 5V. The peak deviation in this case is 50 kHz. The amount of frequency deviation depends on the amplitude of the audio modulating voltage.
Frequency swing. With equal amounts of change above and below center, the frequency swing is twice the deviation. As an example, when the audio modulating voltage has a peak amplitude on either its positive or negative half cycle of 5 V to produce a frequency deviation of 50 kHz, the frequency swing is ± -50 kHz, or a total of 100 kHz.
Percent modulation. This is the ratio of actual frequency swing to the amount defined as 100 percent modulation, expressed as a percentage.
For commercial FM broadcast stations, ±75 kHz is defined by the FCC as 100 percent modulation. For the aural or sound transmitter of commercial television broadcast stations, 100 percent modulation is defined as ± 25 kHz. If, for example, the audio modulating voltage for the associated sound signal in television produces a frequency swing of ± 15 kHz, the percent modulation is ' 5/ 25, or 60 percent. Less swing is used for the FM sound in television, compared with FM broadcasting, in order to conserve space in the television channel.
The percentage of modulation varies with the intensity of the audio voltage. For weak audio signals, the audio voltage is small, and there is little frequency swing, with a small percent modulation. The audio voltage is greater for the louder signals, and there is more frequency swing, producing a higher percent modulation. The frequency swing produced for the loudest audio signal should be that amount defined as 100 percent modulation.
Phase modulation (PM). In a phase modulator, the phase angle of the rf carrier is shifted iii pro portion to the amplitude of the audio modulating voltage. The varying phase causes changes in carrier frequency. Therefore, phase modulation results in an equivalent FM signal or indirect FM. In many cases, the FM transmitter actually uses a phase modulator in a crystal-controlled oscillator, for excellent stability of the center frequency.
An important characteristic of PM is the fact that the amount of equivalent indirect FM increases with higher audio frequencies. An audio correction filter is used in the modulation, though, to provide the same frequency swings as in direct FM.
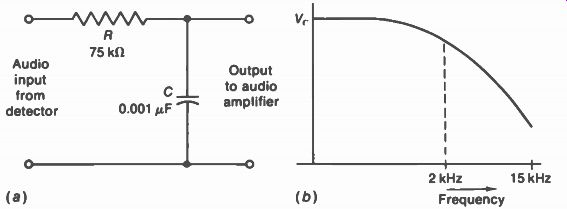
FIGURE 27-4 DEEMPHASIS CIRCUIT IN FM RECEIVER (a) LOW-PASS RC FILTER WITH
TIME CONSTANT OF 75 µs; (b) FREQUENCY RESPONSE
27-4 Preemphasis and De-emphasis
The preemphasis refers to boosting the relative amplitudes of the modulating voltage for higher audio frequencies, from 2,000 Hz to approximately 15 kHz. Deemphasis means attenuating these frequencies by the same amount they were boosted. However, the preemphasis is done at the transmitter, while the deemphasis is in the receiver. The purpose is to improve the signal to-noise ratio for FM reception.
For the transmitter, FCC standards specify that preemphasis shall be employed in accordance with the impedance-frequency characteristic of an LR network having a time constant of 75 As. This characteristic increases the audio modulating voltage for higher frequencies. At the receiver the deemphasis should have the same time constant of 75 µs, but with an opposite characteristic that reduces the amplitude of higher audio frequencies.
A low-pass RC filter, as in Fig. 27-4, is generally used for deemphasis in FM receivers, usually in the detector output circuit. The deemphasis network attenuates high audio frequencies fed to the audio amplifier. Since the shunt capacitance C has less reactance as the frequency increases, the deemphasized audio voltage has less amplitude for the higher audio frequencies. With a 75-µs time constant, the filter attenuates frequencies at about 1,000 Hz and above. The response is down 3 dB at 2 kHz.
While it would seem that no progress is made if the audio voltage is deemphasized to the same extent that it is preemphasized, a great improvement in signal-to-noise ratio is actually the result. The reason is that the interference is indirect FM produced as phase modulation by noise. When the signal and noise are both reduced by deemphasis, the signal returns to normal while the noise is reduced below normal. This is more effective in FM than in AM because the noise level in FM increases for higher audio frequencies. Finally, the de-emphasis has the greatest attenuation for the highest audio frequencies, doing the most good where it is most needed.
27-5 Advantages and Disadvantages of FM
The greatest advantage of FM is its ability to eliminate from the desired signal the effects of interference. The interference can be a modulated carrier from another FM or AM station, atmospheric or man-made static, or receiver noise. In any case, the effects of the interference on the desired signal can be made negligible in an FM system. This important advantage is an inherent part of the FM system. The reason is that the instantaneous frequency variations of the modulated carrier correspond to the desired signal, allowing interfering amplitude variations to be eliminated.
Transmitter efficiency. Because the carrier amplitude is constant in FM transmission, low level modulation can be used, with class C operation permissible for maximum efficiency in amplifying the FM signal. These factors allow a smaller, more economical, and efficient transmitter for FM. Furthermore, additions can be made to an FM transmitter just by adding rf power stages to increase the output.
Broadcast channels. Any FM service with wide frequency swings must be in the VHF or UHF band to allow for the greater bandwidth of the modulated signal. The commercial FM broad cast band is 88 to 108 MHz. The assigned channel is 200 kHz wide for each station. For the FM sound in television broadcasting, 50 kHz of the 6-MHz channel is used. The higher broadcast frequencies in the VHF and UHF bands have the disadvantage of reduced transmission distance, compared with the standard AM radio broadcast band of 535 to 1,605 kHz.
Audio frequency range. In general, the use of the VHF band allows a wider audio modulating frequency range. At the higher frequencies, a wider channel to accommodate the resultant side-band frequencies is feasible. This is true of either FM or AM. An AM radio station is limited to approximately 5 to 10 kHz as the highest audio modulating frequency because of the close spacing of assigned carrier frequencies in the standard broadcast band. Given a wide enough channel, though, an AM system can use as wide a modulating frequency range as FM. The picture carrier in television, for example, is amplitude-modulated with video frequencies as high as 4.2 MHz.
The audio modulating frequency range is 50 to 15,000 Hz for commercial FM broadcast stations and the FM sound in television. However, the extent to which this greater audio frequency range is made useful depends on the quality of the audio system in the receiver.
Multipath reception. Since the instantaneous frequency of an FM signal varies with time, the multipath signals at the receiver generally will have different frequencies at any instant. As a result, heterodyning action between the FM multipath signals at the receiver produces interfering beats that continuously change in frequency. The changing beat frequency can produce garbled sound, similar to the effect produced by nonlinear amplitude distortion in an audio amplifier. In picture reproduction, the interfering FM beat produces an interference pattern of bars, with a shimmering effect as the bars continuously change with the beat frequency. This is why AM is preferable to FM for broadcasting the picture signal, since multipath AM signals simply produce multiple ghost images.
FM is generally used for transmitting the picture and sound signals between microwave radio-relay stations. In this service, however, multipath reception is not a problem because directive antennas beam the signal directly from transmitter to receiver.
27-6 Reactance Tube
The circuit in Fig. 27-5 illustrates how a reactance tube can be used to produce FM directly by varying the frequency of the oscillator stage.
The oscillator has a tuned LC circuit without crystal control. Then the plate-cathode circuit of the reactance tube can be in parallel with the resonant LC circuit. As the reactance of the plate-cathode circuit is varied, the oscillator frequency changes.
Definition of reactance. The fundamental characteristic is that the voltage across a reactance be 90 deg. out of phase, or in quadrature, with the current through it. Lagging voltage is capacitive; leading voltage is inductive. It is not necessary to have an actual capacitor or coil.
The plate-cathode circuit of the reactance tube has quadrature feedback that makes the plate current i_p 90° out of phase with the plate voltage e„. This feature makes the plate-cathode circuit reactive. Since the reactance tube is across the LC circuit, its resonant frequency depends on the reactance of the plate-cathode circuit. Furthermore, this added reactance depends on the transconductance g,„ of the reactance tube.
Varying the grid voltage changes the g„, to vary the oscillator frequency.
Circuit arrangement. The tube shown in Fig. 27-5 is convenient because it has two control grids. Grid 3 is used for audio modulating voltage, while grid 1 has the required quadrature feedback voltage. In the plate circuit, L., is an rf choke to prevent the rf signal from shorting to ground, while C, is a dc blocking capacitor for the B+ voltage. Cathode bias is provided by Rk and Ck. The R„C,. coupling circuit feeds in the audio modulating voltage.
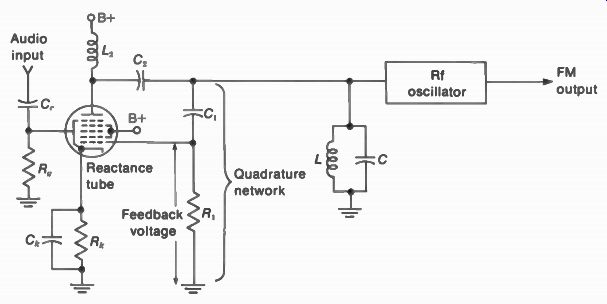
FIGURE 27-5 REACTANCE TUBE FOR PRODUCING FM. ITS PLATE-CATHODE CIRCUIT IS
ACROSS THE LC TUNED CIRCUIT OF THE OSCILLATOR.
The quadrature network. Note that the R,C, branch is connected from plate to cathode, across the LC tuned circuit. All the plate signal voltage is across the R,C, branch, but only the voltage across R, is fed back to grid 1. Most important, this feedback voltage is made to be in quadrature with e _p. The phase shift of 90' is accomplished by making the reactance of C, at least 10 times greater than the resistance of R. Then the capacitive current in this branch leads the plate voltage by practically 90 deg . The voltage across any resistance has the same phase as the current through it. Therefore, the feedback voltage across R, is also in quadrature with the plate voltage, 90 degr. leading e _p. The feedback voltage to grid 1 controls the plate current of the reactance tube. As a result, i _p is 90' leading e _p to make the plate cathode circuit a capacitive reactance. The tube can also be made an inductive reactance by feeding back quadrature voltage that is 90" lagging e _p. Functions. A reactance tube can be used two ways. When audio signal voltage varies the grid bias, this is an FM modulator. Then the rf oscillator frequency changes in step with the modulating voltage amplitude.
However, if a dc voltage is applied to shift the grid bias, then the stage is a reactance control tube to determine the oscillator frequency.
The dc bias can be a control voltage for automatic frequency control (AFC) to hold the oscillator at its correct frequency. In the television receiver, this AFC function can be applied to:
1. The rf local oscillator in the tuner to provide the correct oscillator frequency for each channel. This function is also called automatic fine tuning (AFT).
2. The 3.58-MHz color subcarrier oscillator to maintain the correct phase with respect to the color sync burst. This application is also called automatic phase control (APC).
3. A sine-wave horizontal deflection oscillator to keep the horizontal scanning synchronized. This application is one type of horizontal AFC. A reactance tube used as a control tube, however, can easily be replaced by a varactor semiconductor diode. Varying the dc voltage on a varactor connected across an LC tuned circuit accomplishes the same result of shifting the resonant frequency.
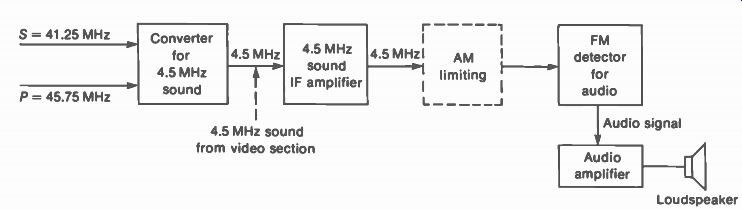
FIGURE 27-6 THE SOUND SECTION OF TELEVISION RECEIVERS. THE AM LIMITING CAN
BE IN A SEPARATE LIMITER STAGE OR AN ADDED FUNCTION OF THE FM DETECTOR.
27-7 Receiver Requirements for the FM Sound Signal
An FM receiver is a superheterodyne like a typical AM receiver. The fact that the signal is frequency-modulated does not affect the heterodyning, as the original frequency swing is maintained around a lower center frequency co-responding to the IF sound carrier. Figure 27-6 illustrates the requirements for the sound section in television receivers. After the desired station has been selected by the tuner, the main functions are IF amplification of the FM signal, AM limiting to remove noise or interference, and detection to recover the audio signal from the frequency swings. The audio amplifier drives the loudspeaker.
In Fig. 27-6, the circuit starts at the left with the intercarrier sound signal of 4.5 MHz.
This is the second sound IF carrier frequency in all television receivers, for VHF and UHF channels and for color and monochrome. In color receivers, the 4.5-MHz sound converter is a separate diode detector that beats the 41.25-MHz sound IF signal S with the 45.75-MHz picture IF signal P to produce the difference frequency of 4.5 MHz for the intercarrier sound signal.
Both the S and P signals are usually coupled into the 4.5-MHz converter from the last picture IF amplifier stage. In monochrome receivers, the video detector is generally used as the 4.5-MHz sound converter. Then the 4.5-MHz intercarrier sound signal is coupled from either the video detector or the video amplifier to the 4.5-MHz sound IF amplifier, without the need for a separate 4.5-MHz sound converter. This circuit arrangement is indicated by the dotted arrow into the sound IF amplifier. All the stages in Fig. 27-6 are for the sound alone, separate from the picture.
The 4.5-MHz sound IF signal is amplified to a level of several volts for the FM detector.
This stage recovers the audio modulation from the frequency swings in the FM signal. Then the detected audio signal is amplified in the audio section to have enough output to drive the loudspeaker.
The FM detector input is tuned to 4.5 MHz, the same as the output circuit of the sound IF amplifier. It is the tuned input circuit of the detector that can recognize the frequency variations in the FM signal.
Furthermore, it is important to realize the separate functions of the sound converter and FM detector stages. The sound converter produces the 4.5-MHz sound IF signal, but this is not the audio signal of 50 to 15,000 Hz needed by the audio amplifier. The 4.5-MHz signal has rf variations corresponding to the audio modulation. The purpose of having the 4.5-MHz signal is to obtain the advantages of intercarrier sound.
However, the FM detector is needed to rectify and filter the 4.5-MHz intercarrier sound signal in order to recover the audio modulation.
IF bandwidth. It may be of interest to note that the standard value is 10.7 MHz for the IF center frequency for the FM commercial broadcast band (88 to 108 MHz) in radio receivers. The IF bandwidth required is at least 150 kHz for the maximum frequency swing of - ± - 75 kHz around 10.7 MHz. For the associated sound signal in television receivers, the required IF bandwidth is 50 kHz, or more, for a maximum frequency swing of - ± - 25 kHz around 4.5 MHz. In both cases, though, the bandwidth needed for the FM signal is only a small percentage of the center frequency. This factor means that the IF tuned circuits can be aligned for maximum output at the intermediate frequency.
We can compare three examples to see the ratio of IF bandwidth to the center frequency. For ± 75 kHz, or 150 kHz, around 10.7 MHz, the ratio is 0.15 MHz/10.7 MHz, which equals 0.014 or 1.4 percent. For ± 25 kHz, or 50 kHz, around 4.5 MHz, the ratio is 0.05/4.5, which equals 0.011 or 1.1 percent. For the last example of an AM radio, which is considered a narrowband receiver, an IF bandwidth of ±5 kHz, or 10 kHz, is 2.2 percent of the 455-kHz intermediate frequency.
FM detector. An FM detector rectifies and filters the IF signal to recover the audio modulation, as in an AM detector. In addition, however, the FM detector requires a tuned circuit that has different output voltages for frequency swings above and below center. In effect, the response of the tuned circuit converts the FM signal to amplitude variations, which are then rectified and filtered. The main types of FM detector circuits are the center-tuned discriminator in Fig. 27-9, the ratio detector in Fig. 27-12, and the quadrature-grid detector in Fig. 27-16. They are all tuned to the center frequency.
AM limiting. Probably the main feature of FM is that amplitude limiting can be used to eliminate AM interference. This is possible because limiting the amplitude variations does not distort the frequency variations of the FM signal.
The function of AM rejection in the FM receiver is accomplished either by a separate limiter stage or by using an FM detector that does not respond to amplitude modulation. A limiter is an IF amplifier tuned to center frequency, but with the dc operating voltages reduced so that the stage operates as a saturated amplifier. For specific applications, the discriminator as an FM detector requires a limiter to remove AM from the IF signal input; the ratio detector and quadrature-grid detector do not use a limiter stage because these circuits are in sensitive to AM in the FM signal.
27-8 Slope Detection of an FM Signal
The sloping side of the IF response curve provides a varying amplitude response for different signal frequencies, as illustrated in Fig. 27-7. This effect is produced by having the IF center frequency at the side of the curve instead of the middle. Then the different amounts of IF gain for the varying frequencies result in corresponding amplitude variations. With the corresponding AM signal coupled into a diode rectifier, the output is the desired audio signal.
It should be noted that the frequency variations of the IF output are the same as in the input. The frequency variations of the FM signal do not disappear. What happens is that the output signal has amplitude variation added, corresponding to the frequency variations.
The principle of slope detection illustrates two requirements of FM detection: (1) Converting the FM signal into equivalent amplitude variations for the IF signal input to a rectifier, and (2) rectifying the audio variations in IF signal amplitude.
Slope detection is the reason why an FM signal can produce audio output in al AM receiver. In general, slight mistuning shifts the response to put the IF center frequency at the sloping side of the response curve. A specific example for television receivers is slope detection of the associated sound signal in the picture IF section, causing audio signal in the video detector output. In this case, the gain for the IF sound carrier of 41.25 MHz is too high on the sloping side of the picture IF response curve.
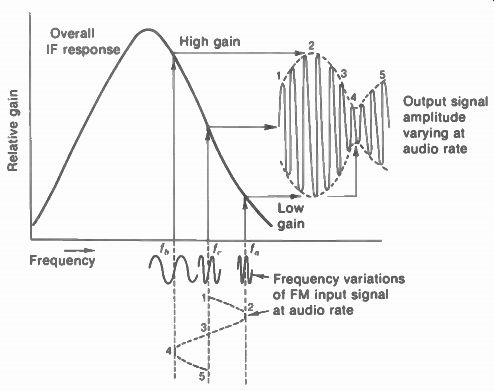
FIGURE 27-7 SLOPE DETECTION OF AN FM SIGNAL. AMPLITUDE VARIATIONS FOR THE
OUTPUT SIGNAL AT THE SIDE OF THE RESPONSE CURVE CORRESPOND TO THE FREQUENCY
VARIATIONS OF THE INPUT SIGNAL SHOWN AT THE BOTTOM. CENTER FREQUENCY IS f,
I , IS ABOVE: f, IS BELOW.
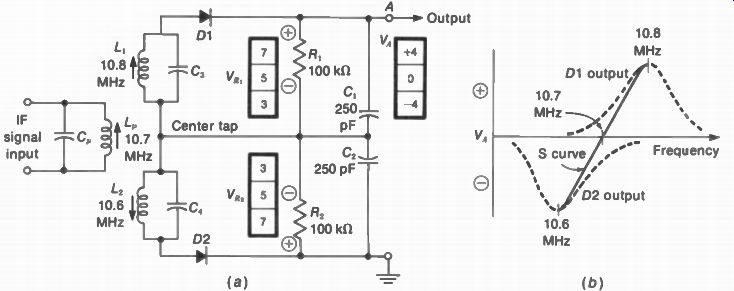
FIGURE 27-8 TRIPLE-TUNED DISCRIMINATOR FOR IF CENTER FREQUENCY OF 10.7 MHz.
(a) CIRCUIT; (b) S RESPONSE CURVE.
27-9 Discriminator Operation
As shown in Fig. 27-8a, the discriminator circuit uses two diodes for a balanced FM detector.
The operation is similar to slope detection, but with two response curves back to back, one for frequencies above center frequency and the other for frequencies below center. The basic characteristics are:
1. Discriminator input transformer for the two diodes. The tuned transformer proportions the amount of signal for each diode in accordance with the frequency deviation above and below center.
2. Two rectifiers in a balanced circuit. The purpose of the balance is to provide zero output at center frequency. Semiconductor diodes are generally used.
3. The response of the discriminator itself, separate from the IF amplifier, has the S-shaped curve shown in Fig. 27-8b. This S curve with two opposite polarities represents the result of two balanced diodes and the opposite responses of the discriminator transformer above and below center frequency.
The discriminator in Fig. 27-8 is shown for a center frequency of 10.7 MHz. However, the same results apply for a center frequency of 4.5 MHz, or any other value. The transformer is shown here with three stagger-tuned circuits, in order to illustrate the different responses above and below center frequency. The primary L„ is tuned to the center at 10.7 MHz. The secondary L, is tuned 100 kHz, or 0.1 MHz, above at 10.8 MHz. The other secondary L, is symmetrical below center, tuned to 10.6 MHz. This frequency separation of ± 0.1 MHz gives a total IF bandwidth of 0.2 MHz, or 200 kHz.
Balanced diode detection. Each diode is a rectifier with its own load resistor. When positive signal voltage is applied to the anode of D1, we can consider electron flow in the diode in the direction opposite to the arrow. The electron flow is from cathode to anode, through L, and the center-tap connection, returning to the diode cathode. The bypass C, across R, is a filter to remove IF signal from the audio output, just as in a conventional diode AM detector.
Note that the polarity of rectified voltage across R, is positive here, at the cathode side of the diode. The amount of rectified voltage depends on the amount of IF signal provided by the tuned circuit with L, resonant at 10.8 MHz.
In the same way, when IF signal voltage is applied to D2, it produces rectified output voltage across R2. This voltage must also be positive at the cathode side of D2, which is the bottom end of R2.
We can look at the two voltages 14, and V„, as being in series with each other because the output is taken from point A to ground, across both resistors. The polarities of these two voltages are opposing, as the top of R, is positive to ground while the top of R, is negative to ground. If V II, and V R2 were both 5V. the net output at point A would be 0 V to ground.
Therefore, we can consider the two diodes of a discriminator as being in series opposition for the rectified output. The zero-balance point occurs at center frequency, when the discriminator transformer supplies equal amounts of IF signal to the two diodes.
Audio output voltage. Assume now that the amount of signal voltage varies for the two diodes. For example, the signal voltage for D1 increases from 5 to 7 V while the signal for D2 decreases to 3V. Then D1 will conduct more plate current, producing a larger I R drop across R. Also, D2 conducts less current, to produce a smaller voltage drop across R . Now the voltages are unbalanced. The voltage across R, rises to 7 V while the voltage across R2 decreases to 3V. The net output at point A is the difference between 7 and 3 V. This equals 4V, positive with respect to ground because the positive voltage is greater.
When the applied signal voltages are reversed, 7V is applied to D2 and 3V to 01.
Then the voltage drop across R, is 7 V, with only 3 V across R,. The circuit is again unbalanced with an output voltage of 4 V, but this is now negative.
IF input voltage. The frequency swings are converted to corresponding amplitude variations in the signal applied to the two diodes by means of the triple-tuned coupling circuit for the IF signal. Assume first that the instantaneous frequency of the FM signal deviates above center frequency. Then the secondary with L, develops a greater signal voltage because the frequency of this tuned circuit is closer to resonance. The secondary voltage developed across L _p however, is now less than at center frequency because the signal frequency is farther removed from its resonant frequency.
With more signal voltage applied to D1 and less to D2, for a frequency deviation above rest frequency, diode 1 produces more rectified output. A net output voltage of positive polarity results. When the instantaneous frequency of the FM signal deviates below center frequency, more signal voltage is developed across the tuned circuit with L, for diode 2, and a negative output voltage is obtained.
With the primary tuned to center frequency, the two secondary circuits alternately provide more or less IF signal voltage for the two diode rectifiers. These amplitude variations correspond to the frequency variations in the FM signal.
Discriminator response curve. The typical S shaped curve for this balanced detector is shown in Fig. 27-8b. The output at center frequency is zero. For frequencies above center, the output voltage is positive and increases progressively for an increasing swing away from center frequency. Similarly, the output voltage is negative when the input signal is below center frequency. However, the same S-shaped curve with opposite polarity can be obtained by reversing connections to the diodes.
The composite response curve is the net result of the sloping responses of the two individual secondary tuned circuits. They provide outputs of opposite polarity because of the balanced arrangement of the diodes. The positive and negative peaks on the discriminator response curve occur at the resonant frequency for each of the two secondary tuned circuits.
This S-shaped response curve is characteristic of FM detector circuits. With FM signal input, the instantaneous frequency variations swing up and down the linear slope on the S curve to provide amplitude variations corresponding to the audio modulation. You can see the discriminator S curve on an oscilloscope connected to the audio output point A, with a sweep generator supplying the IF signal input.
The triple-tuned discriminator gives good linearity on the S response curve, but it is seldom used because mutual coupling of three tuned circuits makes alignment difficult. Similar results are obtained with a double-tuned trans former for the discriminator in Fig. 27-9 and the ratio detector in Fig. 27-12. In these transformers, both the primary and secondary are tuned to center frequency. However, the phase shift in the secondary varies with the frequency deviation.
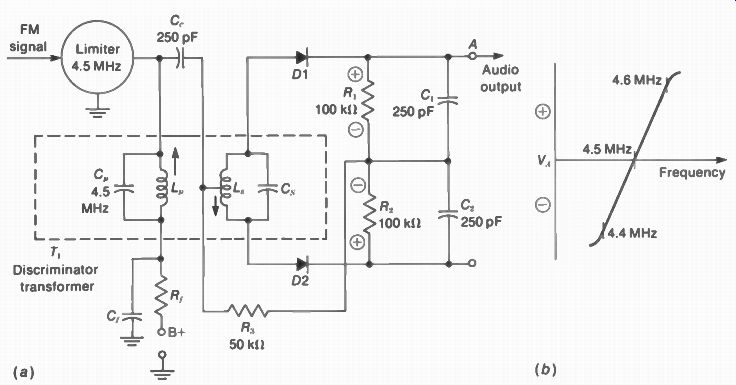
FIGURE 27-9 CENTER-TUNED DISCRIMINATOR FOR IF CENTER FREQUENCY OF 45 MHz.
(a) CIRCUIT: (b) S RESPONSE CURVE.
27-10 Center-tuned Discriminator
As shown in Fig. 27-9, the input transformer is double-tuned, with primary and secondary resonant at the center frequency of 4.5 MHz. This circuit is also called a phase-shift discriminator because the transformer distributes the IF signal to both diodes in proportion to the phase angle between the primary and secondary voltages. It is also called a Foster-Seeley discriminator.
In the input transformer, L _p and L. couple the IF signal inductively from the limiter stage to the diodes. The main feature of a discriminator transformer, though, is that the IF signal voltage from the primary is also coupled to the center tap of the secondary. The 250-pF coupling capacitor C. has negligible reactance at the IF signal frequency. The 50-k-ohm load resistor R3 is used to provide a dc return path for diode plate current, while maintaining a load impedance across the primary. An rf choke can be used in stead of R3.
Balanced detection. The two diode rectifiers are balanced in exactly the same way as in the triple-tuned discriminator. When equal signal voltages are applied to the two diodes, the rectified output is the same for the load resistors R1 and R2. The net output voltage across the two equal series-opposing voltages is zero. As the applied voltage for each of the diodes alternately increases, while signal for the other decreases, an output voltage of either positive or negative polarity is obtained.
Coupling circuit. As the FM signal varies in frequency, the IF signal voltage applied to the diodes is made to vary in amplitude by means of the coupling arrangement between the limiter stage and the discriminator. Note that signal from the limiter stage is simultaneously coupled to the discriminator in two ways: by induction across the IF transformer and by C,., which is in dependent of the mutual induction between L _p and L.
Furthermore, the induced voltage across the secondary is applied to the diode plates in push-pull by means of the center-tap return to cathode. The directly coupled voltage is the primary voltage itself and is applied in parallel to the two diodes. Both diodes are connected to the primary at the same point, which is the center tap. Therefore, the IF signal voltage for the two diodes is the resultant sum of an induced secondary voltage applied in push-pull and the primary voltage applied in parallel to the two diodes.
Quadrature phase. The secondary voltage e, is 90 deg out of phase with the primary voltage e _p at center frequency. This phase relation results because the secondary is tuned to resonance. In general, for a transformer where the secondary is tuned, the voltage across the secondary tuned circuit at resonance is 90 deg out of phase with the voltage across the primary. Furthermore, the phase angle varies around 90° as the applied signal varies above and below the resonant frequency.
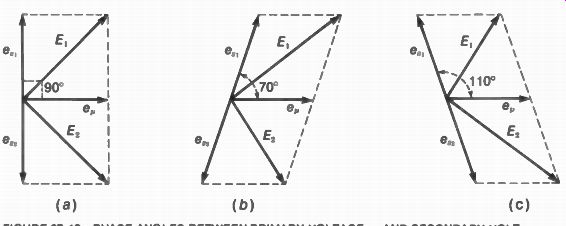
FIGURE 27-10 PHASE ANGLES BETWEEN PRIMARY VOLTAGE e _p AND SECONDARY VOLTAGE
e, FOR CENTER-TUNED DISCRIMINATOR TRANSFORMER; e, IS SPLIT INTO TWO OP POSITE
VOLTAGES e, and e„ BY THE CENTER TAP. (a) FOR RESONANCE AT CENTER FREQUENCY;
90 BETWEEN e _p AND e,; (b) ABOVE RESONANCE; 70° BETWEEN e _p AND e„, (c)
BELOW RESONANCE; 110° BETWEEN e _p AND e„.
Since the primary and secondary of the discriminator transformer are tuned to the IF carrier frequency, e„ and e, are 90° out of phase at center frequency. Both e r and e, are applied at the same time to the diode rectifiers D1 and D2. The primary signal voltage e _p connected to the center tap is effectively in series with the top half of L, for signal to D1 and the bottom half of L, for signal to D2. The phase relations between e„ and e„ are shown by the phasor diagrams in Fig. 27-10. At center frequency, they are 90 deg out of phase. As the FM signal swings around center frequency, the phase angle varies above and below 90°. Phase-angle swings. Figure 27-10a shows the case of resonance with the signal at center frequency. Then e, and e _p are 90° out of phase.
Note that e, is divided into two equal voltages of opposite polarity, e„, and e„, by the center-tap connection. Therefore, the 90° phase between primary and secondary voltages results in a 90° lagging angle for e _p to e„ but a 90° leading angle for e _p to e,. The E, voltage for 01 is the resultant of its two components e _p and e„. This combined sig- nails the actual voltage applied to the diode for rectification. Similarly, the E2 voltage for D2 is the combined resultant of e„ and e _p. The result ant voltages E, and E2 for the two diodes are equal in this case because of the 90 deg phase between e, and e _p Then e _p is out of phase by the same amount for either e _p or e„.
With equal amounts of signal voltage E, and E. applied to the two diodes, the rectified output of each is the same. Then the net voltage from the balanced output circuit at point A equals zero.
In Fig. 27-10b, when the IF signal is above center frequency, e _p is shown 70' out of phase with e _p instead of 90°. The reason for the change in phase angle is that L, tuned to center frequency is not resonant for the signal frequency above center. As an example, L„ is tuned to 4.5 MHz, but the signal now can be 25 kHz higher. The new phase angle of 70° shown in Fig. 27-10b makes e _p closer to the phase of e _p. As a result, the combined voltage E, increases, while E2 decreases. More signal is applied to D1 than to D2, and the net output voltage at point A is positive.
In Fig. 27-10c, the phase angle swings in the direction opposite that in b because the signal is below center frequency, instead of above.
Now e„ is shown 110° out of phase with e _p. Or, e _p is 70" out of phase with e„. The result is that e _p is closer to being in phase with e s2. Then E2 is greater than E. D2 produces more output than D1 now, as the net voltage is negative at point A. Discriminator response. The S curve in Fig. 27-9b has a bandwidth of 100 kHz on the slope, with a center frequency of 4.5 MHz. Although the frequency swing is only ±50 kHz for television sound, this means that just the linear part of the discriminator response around center frequency is used for FM detection. The linear slope is about one-half the distance between peaks.
Summary of audio detection. How the discriminator response recovers the desired audio voltage from the FM signal can be seen by reviewing the action of the phase-shift discriminator as the transmitted signal is modulated. When the audio modulating voltage is zero, the transmitted rf signal is at center frequency. Tuned in at the receiver, the signal is converted to the inter mediate frequency, amplified in the IF section, and coupled to the discriminator for rectification. With the signal at center frequency, the IF transformer coupling the signal to the discriminator is resonant and the secondary voltage is 90' out of phase with the primary voltage. The signal voltages applied to the discriminator diodes then are equal, and the output is zero.
As the transmitter is modulated, the audio modulating voltage produces frequency deviations above and below center frequency The audio modulation on the rf carrier is then reproduced at the output of the discriminator as a changing dc voltage. This varies in amplitude with the frequency deviation in the FM signal.
The rate of these voltage changes is the same as the rate of the frequency swings. which is the audio modulating frequency.
Effect of interfering amplitude modulation. Since the diodes are balanced at center frequency, the net output voltage is zero, regardless of the amplitude of the FM signal. For signal frequencies other than center frequency, however, any variation in amplitude of the IF signal is reproduced in the output of the discriminator. Therefore, a discriminator is preceded by a limiter stage, which has the function of eliminating AM interference in the FM signal coupled to the discriminator.
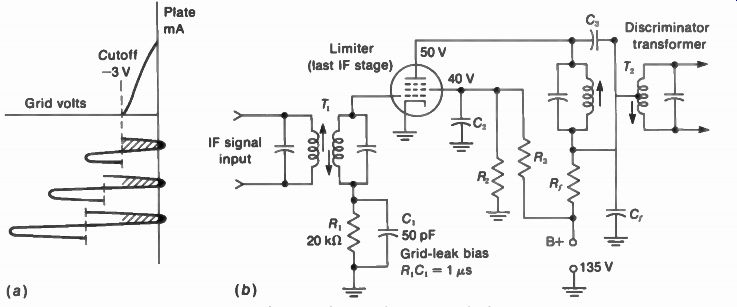
FIGURE 27-11 LIMITER STAGE FOR AN FM RECEIVER. BOTH 7, AND 7 2 ARE TUNED
TO THE IF CENTER FREQUENCY. (a) WAVEFORMS FOR DIFFERENT AMPLITUDES OF GRID
SIGNAL; (b) CIRCUIT WITH LOW PLATE AND SCREEN VOLTAGES ON PENTODE AMPLIFIER.
27-11 The Limiter
How the limiter functions is illustrated by the waveforms in Fig. 27-11a. Note that the signal has a peak amplitude greater than cutoff. The grid-cutoff value depends on the tube and its dc voltages. The amount of grid-leak bias, though, depends on the amount of signal. The grid-leak bias voltage developed will be approximately equal to the peak value of the signal swing. The bias results from grid current, which flows for a very small part of the positive half-cycle at the tip of the positive signal swing. Plate current, however, flows for almost the entire positive half cycle, as indicated by the shaded area in the illustration.
When the amplitude of the input grid signal increases, a greater negative bias voltage is developed. The grid-cutoff voltage remains the same, however, and the average plate current changes very little. Therefore, the amount of plate-current flow in the limiter stage is approximately constant for all signals with an amplitude large enough to develop grid-leak bias greater than the cutoff voltage.
With a relatively uniform value of average plate current, then, the output voltage across the tuned circuit is constant. Note that the frequency variations in the FM signal are maintained in the output, since the plate-current pulses are produced at the grid signal frequency. The LC tuned plate circuit provides complete sine-wave cycles of the signal.
The limiter stage is also an IF amplifier, with a voltage gain of about 5. Although a vacuum tube amplifier is shown in Fig. 27-11, the limiter stage can use a CE transistor amplifier.
Then the RC coupling circuit for signal to the base provides varying reverse bias proportional to signal strength, corresponding to grid-leak bias. A typical RC time constant is 1 to 4 u-s.
When the peak amplitude of the signal is too small, the limiting action fails because the stage is then a class A amplifier. Therefore, the preceding stages must have enough gain to saturate the limiter with the smallest useful antenna signal. Assuming 50 µV signal at the antenna, a voltage gain of 60,000 is needed for 3V at the limiter grid, for good limiting in this example.
This is the limiter-threshold value for limiting action. Below the limiting threshold, the receiver produces the rushing sound of noise generated in the mixer stage.
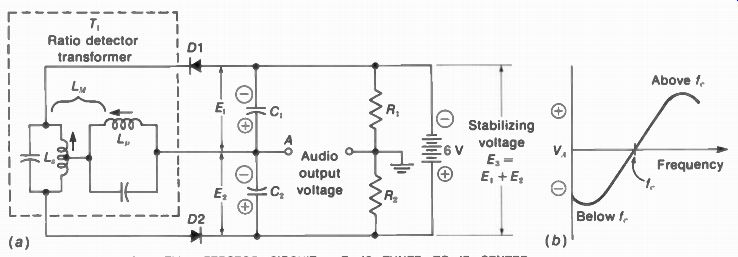
FIGURE 27-12 BASIC RATIO DETECTOR CIRCUIT. 7, IS TUNED TO IF CENTER FREQUENCY
(a) BALANCED CIRCUIT WITH AC AUDIO OUTPUT AT POINT A; (b) S. RESPONSE CURVE
27-12 Ratio Detector
This is an FM detector circuit insensitive to amplitude variations in the FM signal. Because no limiter stage is necessary, allowing fewer IF amplifiers, the ratio detector circuit is often used. As shown in Fig. 27-12, the circuit is al most like a discriminator, but for a ratio detector the two diodes are connected in series. Notice that D1 has IF signal applied to its cathode, while D2 has signal at the anode.
Circuit arrangement. In Fig. 27-12, the input coupling transformer T1 has the same function as in the phase-shift discriminator. Both the primary and secondary tuned circuits are resonant at the IF center frequency. The secondary is center-tapped to produce equal voltages of opposite polarity for the diode rectifiers, while the primary voltage is applied in parallel to both diodes. The transformer is shown in its equivalent form, with L„ indicating the mutual inductance between L„ and L. In the ratio detector, one diode is reversed so that the two half-wave rectifiers are in series for charging the stabilizing voltage source E, in the output side of the circuit. Another difference from a discriminator is that audio output is taken from point A at the junction of the two diode capacitors C1 and C2, with respect to the center tap on the stabilizing voltage.
Stabilizing voltage. In order to make the ratio detector insensitive to AM interference effects in the audio output, the total voltage E„, equal to the diode output voltages E, 4 E _p must be stabilized so that it cannot vary at the audio frequency rate. Then audio output is obtained at point A only when the ratio between E, and E, changes. This is why the circuit is called a ratio detector. The total voltage E„ remains fixed by the stabilizing voltage source.
Audio output signal. As each diode conducts it produces the rectified output voltage E, or E2 across C, or C2, approximately equal to the peak value of the IF signal applied to each rectifier. At center frequency, the input transformer proportions the IF signal voltage equally for the two diodes, resulting in equal voltages across C, and C. The output voltage at the audio takeoff point A is zero, therefore, since E1 and E2 are equal.
Note that these two voltages have opposite polarity at point A with respect to chassis ground.
When the FM signal input is above center frequency, however, we can assume D1 has more IF signal input than D2. Then the rectified diode voltage E1 is greater than E2. This makes point A more positive, producing audio output voltage of positive polarity.
Below center frequency, D2 has more IF signal input and E2 is greater than E. The result is audio output voltage of negative polarity at point A. This response is illustrated by the ratio detector S curve in Fig. 27-12, which is essentially the same as the discriminator response curve.
An important characteristic of the ratio detector output circuit can be illustrated by numerical examples. Assume that the frequency deviation above center frequency increases E, by 1 V. This makes point A more positive. At the same time, E2 decreases by 1 V. This makes point A less negative by 1 V, which is the same as making it 1 V more positive. The two rectified diode voltages E, and E2 thus produce the identical voltage change of 1 V in the positive direction at point A. Since the audio signal is taken from point A, the amount of output is the same as though only one diode were supplying audio voltage corresponding to the frequency variations in the FM signal.
As a result, the audio voltage output of a ratio detector is one-half the output of a discriminator, where the audio signal voltages from the two diodes are combined in series with each other at the audio takeoff point. The output in the ratio detector must be taken from the junction of the two diode loads because there is no audio signal voltage across the stabilizing voltage source.
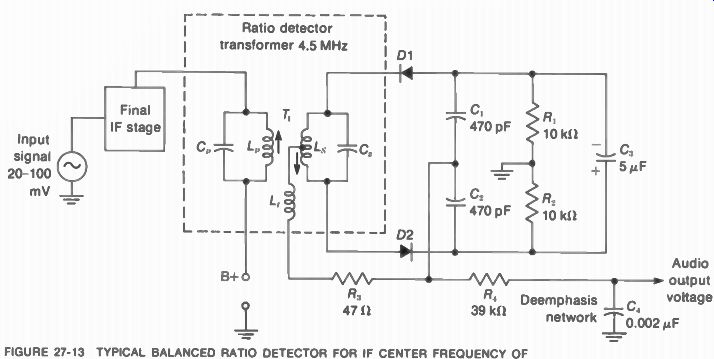
FIGURE 27-13 TYPICAL BALANCED RATIO DETECTOR FOR IF CENTER FREQUENCY OF 4.5
MHz. THE 5-µF ELECTROLYTIC CAPACITOR C3 PRODUCES THE REQUIRED DC STABILIZING
VOLTAGE.
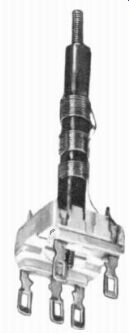
FIGURE 27-14 RATIO DETECTOR TRANSFORMER. HEIGHT IS 2 1/2 IN.
Typical circuit. If a battery were used for the stabilizing voltage, the diodes would operate only with a signal at least great enough to over come the battery bias on each diode. A large capacitor is used instead, as illustrated by C„ in the schematic diagram of a typical ratio detector circuit in Fig. 27-13. C.: charges through the two diodes in series, automatically providing the desired amount of stabilizing voltage for the IF signal level. The 5-1.tF capacitance of C„, generally called the stabilizing capacitor, is large enough to prevent the stabilizing voltage from varying at the audio frequency rate. A discharge time constant of about 0.1 s is required, as provided by R, in series with R2 across C„.
The tertiary winding L, of the ratio detector transformer is used to couple the primary signal voltage in parallel to the two diodes. L, is wound directly over the primary winding for very close coupling, so that the phase of the primary signal voltage across L _p and L, is practically the same. The construction of a ratio detector transformer with the tertiary winding is illustrated in Fig. 27-14. This arrangement with the tertiary winding, instead of direct coupling to the secondary center tap, is commonly used with the ratio detector circuit in order to match the high-impedance primary and the relatively low impedance secondary, which is loaded by the conduction in the diodes. The resistor R3 in series with L, limits the peak diode current, to improve the balance of the dynamic input capacitance of the diodes at high signal levels.
Because of the 90° phase relation between the voltages across the secondary and across L, at resonance, the circuit provides detection of the FM signal in the same manner as the phase-shift discriminator. Both the primary and secondary of the ratio detector transformer are tuned to the IF center frequency, which can be 10.7 MHz in FM broadcast receivers or 4.5 MHz for intercarrier-sound television receivers. The audio output voltage of the ratio detector is taken from the junction of the diode load capacitors C, and C2, in series with the audio deemphasis network, to supply the desired audio signal for the first audio amplifier.
The deemphasis circuit for the detector output consists of R., and C, with a time constant of 78 u-s. Since the high audio frequencies are preemphasized for a better signal-to-noise ratio in transmission, the deemphasis circuit attenuates the high frequencies to provide the original audio modulating signal. C, serves as a bypass for high audio frequencies, as illustrated by the deemphasis response curve in Fig. 27-4b.
Single-ended ratio detector. Figure 27-15 illustrates a ratio detector circuit that has an un balanced output circuit. The input circuit, which is shown in its equivalent form, is the same as in the balanced circuit. However, only the one diode load capacitor C, is used in the audio output circuit. Also, the stabilizing voltage across R, and C, is not center-tapped. It is not necessary to ground the center point of the stabilizing voltage source.
The only effect of the ground connection in Fig. 27-15 is to change the dc level of the audio output signal at A with respect to chassis ground. The same audio signal variations are obtained, but around a dc voltage axis equal to one-half the stabilizing voltage. However, the audio output always has a zero dc level with respect to the midpoint of the stabilizing source.
Only the one diode load capacitor C, is necessary in the output circuit to obtain the audio signal because it serves as the load for both diodes. Each diode charges C2 in proportion to the IF signal input for each rectifier, but in opposite polarity. Therefore, the voltage across C2 is the same audio output signal as in the balanced ratio detector. The capacitance of C2 is doubled in the single-ended circuit because it replaces two capacitors that are effectively in parallel for signal voltage in the balanced circuit.
Ratio-detector receiver characteristics. Referring back to Fig. 27-13, note that only 20 to 100 mV signal is applied to the grid of the IF stage driving the ratio detector. With a gain of about 100, the IF output of 2 to 10V will be enough to drive the diodes. Since no limiter is required, less IF gain is needed, as there is no fixed threshold voltage that must be exceeded.
The ratio detector automatically adjusts itself to the IF signal level.
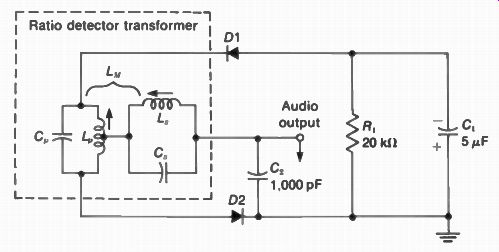
FIGURE 27-15 RATIO DETECTOR WITH SINGLE-ENDED OR UNBALANCED OUTPUT CITCUIT
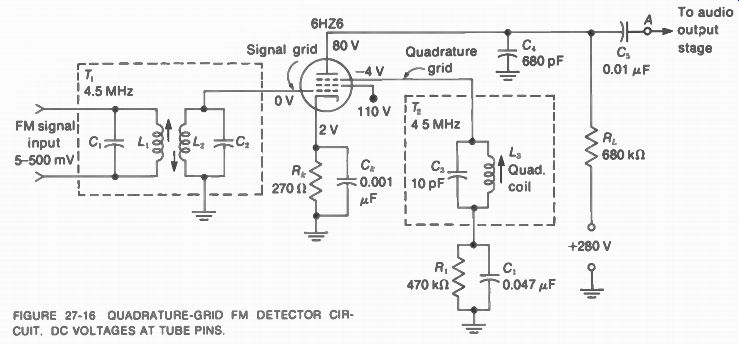
FIGURE 27-16 OUADRATURE-GRID FM DETECTOR CIRCUIT. DC VOLTAGES AT TUBE PINS.
27-13 Quadrature-Grid FM Detector
This circuit uses a pentode combining the functions of FM detector, AM limiter, and first audio amplifier. As shown in Fig. 27-16, the audio signal output has enough amplitude to drive the audio power output stage.
Either of two types of tubes can be used.
One is a gated-beam tube, such as the 6BN6.
The other is a sharp-cutoff pentode where grid 3 and grid 1 can be used as dual control grids.
Common tubes for this function are the 6DT6 or 6HZ6 pentodes and the 6V10 or 6Z10, combining a sharp-cutoff pentode with a beam-power audio output stage. These tubes are often used with heater ratings of 3V, 4 V, 5 V, 13V, and 17 V for series strings. In any case, this detector circuit requires a pentode with two sharp-cutoff control grids to control plate current. Typically, the cutoff is -3 V for grid 1 and -6 V for grid 3.
Referring to Fig. 27-16, the IF FM signal is applied to grid 1, which is the signal grid. Grid 3 also has the signal, but in quadrature phase, by space-charge coupling within the tube. The detected audio output is produced in the plate circuit because of the 90' phase between signals at grid 1 and grid 3.
Quadrature grid. The characteristics of grid 3 are important in the operation of this FM detector circuit. In tubes with multiple grids, when one grid has positive voltage with respect to cathode and the next grid is negative, this grid develops its own space charge corresponding to a virtual cathode. In the 6HZ6 here, grid 3 is at -4V, while grid 2 is the screen grid at +110 V. Therefore, electrons in the space current to the plate are slowed down enough near grid 3 to form an outer space charge. This is in addition to the normal space charge near the cathode.
The outer space charge serves as a source of electrons for the outer electrodes, including grid 3 and the plate.
With signal input voltage to grid 1, the space current is varied. Then the amount of space charge at the virtual cathode near grid 3 also varies. As a result, electrostatic induction by the varying space charge causes signal current to flow in the grid 3 circuit. The resonant circuit of L„ here provides signal voltage corresponding to the induced current.
The induced current in the grid 3 circuit lags by -90° the signal voltage at grid 1. At resonance, the voltage across the tuned circuit for grid 3 also lags the grid 1 voltage by -90 deg . This is why grid 3 is called the quadrature grid. The -90 degree phase applies at center frequency of the FM input. When the signal deviates below and above center frequency, the phase of the quadrature-grid signal varies below and above -90°. Gating action. In a tube with two control grids, each controls the plate current. Also, either one can cut off the output. Therefore, the grids serve as voltage-controlled gates to turn the output on or off. When the grid voltage allows plate current, the gate is open; when the grid voltage is more negative than cutoff, the gate is closed. Either grid can gate the plate current on or off.
When one gate is closed there is no plate current, even if the other gate is open. Therefore, both gates must be on at the same time to have output plate current. This feature is the basis for detecting the FM signal at grid 1 which is gated by the quadrature signal at grid 3 (see Fig. 27-17).
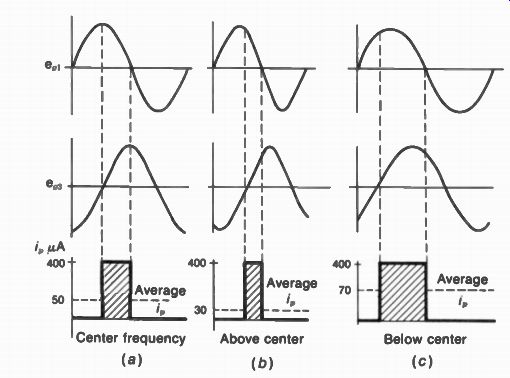
FIGURE 27-17 GATING ACTION OF GRIDS 1 AND 3 ON PLATE-CURRENT OUTPUT OF QUADRATURE-GRID
DETECTOR. THE AVERAGE i„ VARIES WITH FM DEVIATION. (a) AT CENTER FREQUENCY
e, LAGS e„, BY 90': (b) ABOVE CENTER FREQUENCY e„ LAGS MORE: (c) BELOW CENTER
FREQUENCY e„ LAGS LESS.
Circuit operation. In Fig. 27-16, the 4.5-MHz sound signal is coupled by T, to the signal grid of the FM detector. This signal is also in the quadrature-grid circuit, because of space charge coupling, but 90° out of phase with the input signal. The quadrature coil L, is adjusted to resonate with C„ at the IF center frequency of 4.5 MHz. Grid-leak bias is provided by RC. The phasing between the signals at grid 1 and grid 3 is shown in Fig. 27-17. At center frequency, in a, the two signal voltages are 90° out of phase. Plate current flows only for part of the cycle, when both grids gate i„ on. This time is indicated by the shaded area of the i„ wave form.
Above center frequency, in Fig. 27-17b, e _p„ lags e,„ by more than -90°. Then the two signals are closer to being of opposite phase. Therefore, the on time for i _p is shorter, resulting in narrower pulses of plate current. Although the amplitude is the same, equal to saturation i,„ the narrower pulses mean a smaller value of average plate current.
Below center frequency, in Fig. 27-17c, lags e _p by less than -90 deg . Then the two signals are closer to being in the same phase, and therefore the on time for i _p is longer, resulting in wider pulses, with a higher average value.
Remember that these phase changes for e„: , result from frequency deviations in the FM signal, which follow the audio modulating voltage. Similarly, the variations in average i _p follow the modulation in the FM signal. Although the plate-current pulses are at the IF signal frequency, the average plate current varies with the audio signal.
In the plate circuit, the integrating capacitor C, bypasses the IF variations, allowing the audio output voltage to be developed across the plate-load resistor R,.. The audio signal amplitude at the audio takeoff point A is about 14V peak value, for 25 kHz deviation from the center frequency of 4.5 MHz. This voltage is enough to drive the audio power output stage, without the need for a first audio voltage amplifier.
AM rejection. Undesired amplitude modulation is attenuated because of the following factors: The cathode bias resistor Rk is bypassed for IF but not for audio frequencies. The result ant degeneration of the audio signal reduces the effect of any high-amplitude interference.
Also, the IF transformer T, is damped by grid current when the signal amplitude at grid 1 exceeds the cathode bias of 2 V. The shunt damping lowers the Q of the tuned transformers, reducing the amount of signal voltage. Finally, grid 3 produces saturation plate current when it is driven positive. This grid has grid-leak bias, which increases with higher signal amplitudes to clamp the positive peak at zero voltage. The result is saturation plate current at a peak value of approximately 0.4 mA for typical signal input. In some circuits a variable cathode bias resistor is used as a buzz control, which is adjusted for best limiting.
Locked-oscillator mode. Without any input, or for weak signal, the 6HZ6 detector will oscillate at relatively low amplitude. The circuit is a tuned-grid tuned-plate oscillator, with grid 3 as the oscillator plate supplying feedback to grid 1 through interelectrode capacitance. Then the FM input becomes a synchronizing signal to lock in the oscillator at the signal frequency. Detection occurs because of the gating action of the two control grids in quadrature, as de scribed. However, the locked-oscillator feature is an advantage in rejecting AM with weak signal input. Then, the signal amplitude in the detector is always high enough to provide the required limiting action.
For weak signal input, the oscillations provide the required amplitude of grid voltage, synchronized by the FM input signal. With normal or strong signal, the input voltage itself has enough amplitude for AM limiting. The result is quadrature detection with good AM rejection for both weak and strong signals, in this locked-oscillator, quadrature-grid detector (LOQG) circuit.
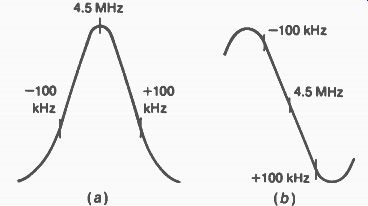
FIGURE 27-18 VISUAL RESPONSE CURVES FOR 4.5-MHz SOUND IF SECTION. (a) MAXIMUM
RESPONSE OF IF AMPLIFIERS; (b) S RESPONSE OF QUADRATURE-TUNED CIRCUIT IN FM
DETECTOR.
27-14 Sound IF Alignment
This consists of two parts: tuning the IF amplifier for maximum output and balancing the AM detector at center frequency. Typical response curves for the 4.5-MHz television sound are shown in Fig. 27-18. In FM broadcast receivers, the IF center frequency is 10.7 MHz, with the ±100-kHz markers farther apart for more band width. All these markers are usually available on sweep generators.
Discriminator-limiter combination. The IF amplifiers are aligned for maximum output at the input to the limiter. A visual response curve looks like Fig. 27-18a. However, the IF circuits can also be aligned for maximum grid-leak bias, measured by a dc voltmeter at the limiter grid.
For the discriminator transformer, the S curve can be obtained with an oscilloscope at the audio takeoff point. However, the discriminator can also be balanced with a dc voltmeter, as explained later.
Ratio detector receiver. The IF amplifiers can be aligned for maximum dc output across the stabilizing capacitor with a dc voltmeter. This IF alignment includes the primary of the ratio detector transformer but not the secondary.
A visual IF response curve like Fig. 27-18a can be obtained. However, the stabilizing capacitor must be disconnected temporarily. It bypasses the 60-Hz oscilloscope input signal, which is the modulation frequency of the sweep generator.
The secondary of the ratio detector trans former is aligned by checking the audio output voltage, not the stabilizing voltage. Either an S curve can be obtained at the audio takeoff point, as in Fig. 27-18b, or the ratio detector can be balanced with a dc voltmeter, similar to the discriminator alignment.
Quadrature-grid detector alignment. This circuit is usually aligned with FM input signal from a broadcast station. The procedure is to adjust the quadrature coil, 4.5-MHz IF transformers, and 4.5-MHz sound takeoff trap for best sound, with increasing volume and minimum distortion.
In addition, a dc voltmeter to check grid-leak bias on the quadrature grid will read maximum.
This voltage can be measured across R, in Fig. 27-16.
A specific procedure without any test equipment can be as follows:
1. Tune in a strong channel but attenuate the antenna signal until you hear hiss in the sound. This is receiver noise, indicating weak sound signal below the limiting level.
2. Adjust the quadrature coil for undistorted audio, with minimum hiss and no buzz.
3. The 4.5-MHz IF transformers are adjusted for maximum volume.
Balancing the discriminator. This is essentially tuning the input transformer to center frequency. It can be done without a visual response curve, using just a dc voltmeter and a conventional rf signal generator to supply un modulated output voltage at the signal frequency. A dc voltmeter is used because the output is a steady voltage when the input signal is not frequency-modulated, since there are no frequency variations to produce variations in the output. The meter should have an impedance of 20,000 W V or higher to avoid detuning the discriminator.
With the generator supplying signal at the IF center frequency, and the dc voltmeter connected across the audio output terminals:
1. Tune the primary of the discriminator transformer for maximum output.
2. Tune the secondary of the discriminator transformer for a sharp drop to zero.
It should be possible to produce either a positive or a negative output voltage when adjusting the secondary. Therefore, it should be tuned for zero indication at the balance point where the output voltage starts to swing from one polarity to the other. A gradual decrease to zero is the wrong indication, as this only means the circuit is being detuned away from center frequency.
When the signal generator frequency is varied manually above and below center frequency, the dc output voltage should vary from zero at center frequency to a maximum value at both sides of center frequency, with opposite polarities below and above center. The response should be symmetrical about center frequency, with equal output voltages produced for the same amount of frequency change below or above center frequency. The two points of maximum output voltage, corresponding to the two peaks on the discriminator response curve, should have the required frequency separation.
The actual polarity of the output voltage for a frequency deviation above or below center does not matter. It is only required that the output voltages be of opposite polarity for frequency deviations above and below center frequency.
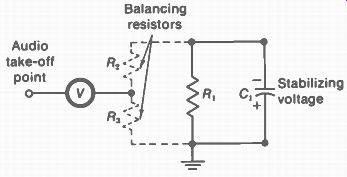
FIGURE 27-19 TEMPORARY RESISTOR CONNECTIONS TO BALANCE AUDIO TAKEOFF POINT
TO GROUND IN A SINGLE ENDED RATIO DETECTOR
Balancing the ratio detector. With the genera tor supplying signal at the IF center frequency:
1. Tune the primary of the ratio detector trans former for maximum output on the dc volt meter across the stabilizing capacitor.
2. Move the dc voltmeter to the audio takeoff point. Then tune the secondary for zero balance.
When the ratio detector has a single-ended output circuit, however, the audio output has a dc level equal to one-half the stabilizing voltage.
Therefore, usual practice is to insert two balancing resistors temporarily, as shown in Fig. 27-19. This converts the single-ended arrangement to a balanced output circuit, so that the ratio detector secondary can be aligned for balance at zero with the dc voltmeter.
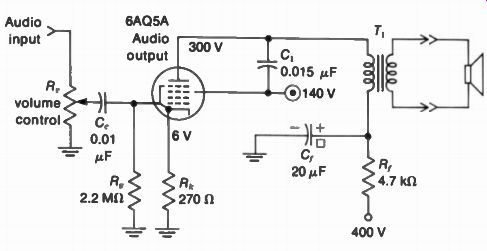
FIGURE 27-20 AUDIO OUTPUT TUBE TRANSFORMER-COUPLED TO LOUDSPEAKER.
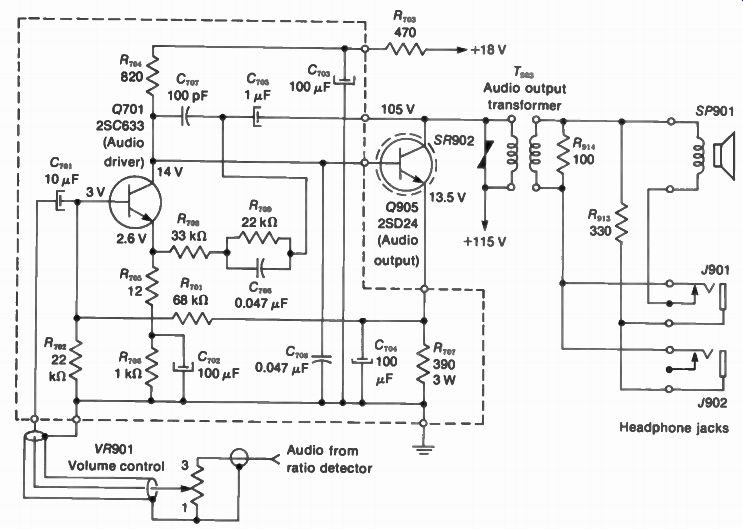
FIGURE 27-21 TRANSISTORIZED AUDIO AMPLIFIER R VALUES IN OHMS (SONY CHASSIS
KV 1210U)
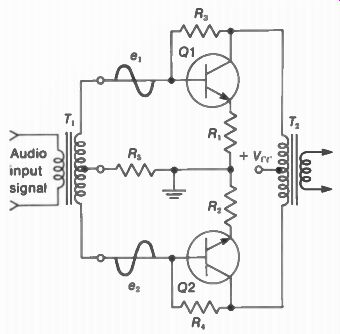
FIGURE 27-22 PUSH-PULL AUDIO AMPLIFIER WITH TRANSISTORS TO DRIVE LOUDSPEAKER
27-15 The Audio Amplifier Section
In receivers with vacuum tubes there is generally a quadrature-grid detector driving one audio output stage. This is a transformer-coupled to a 3.2-0 loudspeaker (Fig. 27-20). With solid-state circuits, though, the ratio detector or discriminator is generally used. These FM detector circuits require an audio amplifier to drive the power output stage (Fig. 27-21). In addition, transistorized audio output stages often use the push-pull circuits illustrated in Figs. 27-22 and 27-23. The loudspeaker impedance is generally 16 to 32 ohm for transistor circuits.
The volume control varies the amount of signal into the audio amplifier. When a tone control is used, it varies the treble response.
Either bypassing for high audio frequencies is varied or the amount of negative feedback is adjusted.
Audio output stage. In Fig. 27-20 the audio input at the volume control is obtained from the plate circuit of a quadrature-grid detector. C. and R _p provide the RC coupling. Cathode bias is produced by the 270-ohm Rk. This resistor is not bypassed, in order to degenerate the input signal. The degeneration, or negative feedback, reduces gain but also reduces distortion. Amplified output from the plate is coupled to the loudspeaker by the audio output transformer T. Its function is to match the low impedance of 3.2 ohm for the loudspeaker to the 10-k-ohm output impedance of the plate circuit. C, between the plate and screen grid is a bypass for high audio frequencies. It compensates for the resonant peak of the output transformer.
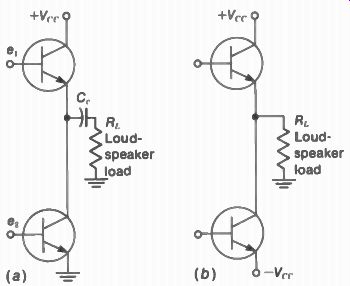
FIGURE 27-23 SERIES OUTPUT CONNECTIONS FOR PUSH PULL AUDIO AMPLIFIER TO ELIMINATE
OUTPUT TRANS FORMER. (a) ONE COLLECTOR SUPPLY V, , , (b) SYMMETRICAL VOLTAGE
SUPPLIES OF OPPOSITE POLARITY.
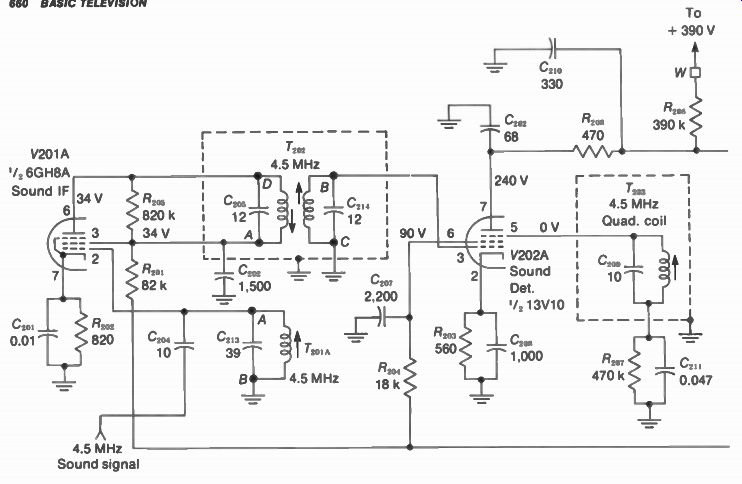
FIGURE 27-24 COMPLETE SOUND SECTION USING TUBES, IN MONOCHROME RECEIVER R
IN OHMS, C ABOVE 1 IN pF (RCA CHASSIS KCS 183)
In the plate circuit, R f and C f form a decoupling filter to isolate the transformer primary from the B+ supply. The 20-uF value for C f means it is an electrolytic capacitor. Usually this capacitor is one section of a filter capacitor can, as indicated by the square marking. When the cathode resistor Rk is bypassed, the Ck is an electrolytic capacitor of 100 to 200 uF, also as one section of a filter capacitor can.
Transistorized audio amplifier. In Fig. 27-21, transistor Q701 is a CE (common-emitter) stage. It is the first audio amplifier driving the CE power output stage 0905. The audio input from a ratio detector is coupled by C701 to the base of Q701. Shielded cable is used to prevent pickup of hum. The audio output from Q905 is transformer-coupled by T„,: , to the 16-ohm loudspeaker and the headphone jacks. The varistor SR902 across the primary protects the power output transistor Q905 from voltage breakdown if the secondary load should open when the volume is at a high level.
The collector load for Q701 is the 820-ohm R7 „ 1 . In the emitter circuit, R70, and R7 ,„, produce the emitter voltage of 2.6 V. R74, is not bypassed in order to degenerate the input signal, which reduces distortion and raises the input impedance. The base bias of 3 V on Q701 is taken from the emitter of 0905, through the 68-1(12 series-dropping resistor R7 „,.
The collector output circuit of Q701 is directly coupled to the base of 0905 to provide signal drive for the audio output stage. Negative feedback to reduce distortion is provided from the collector of Q905 to the base of Q701. The feedback line includes C7 „ 5, R7 _p with its shunt C710 _p and R711 _p in series. The 0.047-uF C,„„ at the base of 0905 is a bypass for high audio frequencies to reduce the treble response. The emitter voltage of 13.5 Von Q905 is produced by emitter current through R 7„7.
Push-pull audio output circuits. The basic arrangement is illustrated in Fig. 27-22 with two transistors. Both can be either NPN or PNP. Also, two vacuum tube amplifiers can be used.
The push-pull circuit can operate Class B or Class AB, as each stage supplies output signal on alternate half-cycles. The result is more power output with greater efficiency, compared with class A operation. A center-tapped output transformer T, is shown in Fig. 27-22 to drive the loudspeaker load. Also, the input transformer T, splits the phase of the audio signals e, and e„ driving the push-pull stages.
There are more possibilities for push-pull circuits with transistors than with tubes. First, the center-tapped output transformer T, can be eliminated because power transistors provide the low impedance needed to drive the loud speaker directly. As shown in the series output circuit in Fig. 27-23, the output is taken from the collector-emitter junction of the two transistors in series for dc supply voltage. In Fig. 27-23a, one dc supply voltage is used for both transistors. This circuit uses C, to block the dc voltage from the loudspeaker load R,. In Fig. 27-23b, equal voltage supplies of opposite polarity are used or the collector of one transistor and the emitter of the other transistor. Then the dc voltage is zero at the output, allowing a direct connection to the loudspeaker without C. Both circuits in Fig. 27-23 still need a phase splitter for push-pull input. To eliminate this requirement, the push-pull amplifier can use complementary symmetry, with one stage NPN and the other PNP. Or, both output stages can be the same type while the driver stages use opposite transistors, in a quasi-complementary amplifier.
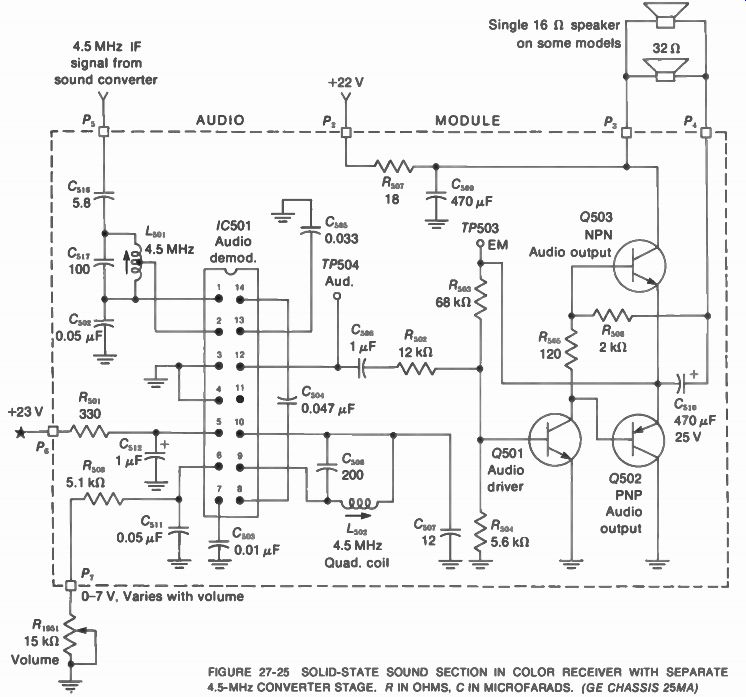
FIGURE 27-25 SOLID-STATE SOUND SECTION IN COLOR RECEIVER WITH SEPARATE 4.5-MHz
CONVERTER STAGE. R IN OHMS, C IN MICROFARADS. (GE CHASSIS 25MA)
27-16 Complete Circuits fcr the Associated Sound Signal
A complete sound section with vacuum tube amplifiers is shown in Fig. 27-24. This is a monochrome receiver, with the 4.5-MHz sound IF signal produced in the output of the video detector. Then the 10-uF C,„, couples the sound signal to the control grid of V201A. This pentode is a Lined IF amplifier, resonant at 4.5 MHz
The transformer 7" 203 „ is part of the 4.5-MHz sound takeoff trap T 203ji in the video detector output, not shown in this diagram. The plate trans- former T 212 of the sound IF amplifier is also tuned to 4.5 MHz, driving the quadrature-grid detector V202A. Both the detector and audio output stages use the dual-pentode tube 13V10. The quadrature-grid detector circuit is essentially the same as that illustrated in Fig. 27-16. Also, the audio output stage which drives the loud speaker is similar to Fig. 27-20. In Fig. 27-25 an integrated circuit is used for the 4.5-MHz sound IF amplifier and quadrature detector, but with discrete transistors for the audio amplifier. This entire sound section is on one small module board. The input is sound IF signal from a separate 4.5-MHz sound converter stage on the picture IF module board. The audio amplifier consists of a PNP driver for the push-pull output circuit with complementary symmetry. One collector supply is used for the NPN and PNP transistors in series for dc voltage.
27-17 Intercarrier Buzz
This is 60-Hz interference in the 4.5-MHz sound signal. The buzz is a result of cross-modulation by the picture signal, especially for white information when the picture carrier is at its minimum level. At the opposite extreme, the picture carrier is high for blanking and sync. The effect of the cross-modulation is AM interference in the sound signal, therefore, at the 60-Hz rate of the vertical blanking pulses. Normally, intercarrier buzz is not audible, though, because of the following factors:
1. The amplitude of the first sound IF carrier of 41.25 MHz is very low, at 5 to 10 percent.
2. Limiting in the 4.5-MHz sound IF circuits reduces the AM interference.
3. Exact balance in the FM detector eliminates AM interference at the center frequency.
Typical troubles that can cause intercarrier buzz are incorrect balance in the FM detector, a defective stabilizing capacitor in a ratio detector, and overload distortion in any of the IF stages common to picture and sound. The overload can be caused by a weak amplifier or incorrect bias, often because of AGC trouble.
27-18 Multiplexed Stereo Sound
Since stereophonic broadcasting with left (L) and right (R) audio signals is used in the FM broadcast band, similar methods are being considered to multiplex two audio signals for television sound. The problem is a little different, though, because of the smaller deviation of 25 kHz, compared with 75 kHz. Also, the horizontal deflection current at 15,750 Hz can cause interference in television receivers.
The general idea of multiplexing two signals on one subcarrier is illustrated by color television, where two color video signals are combined on the 3.58-MHz subcarrier. One suggested method for stereo sound in television uses the following standards: The L+R signal, which is compatible with monaural audio, uses the same modulating frequencies of 50 to 15,000 Hz with the same frequency deviation of ± 25 kHz. The L-R component, which is the stereo component, is on a suppressed subcarrier of 23.625 kHz. This frequency is 1.5 x 15,750 Hz.
The pilot frequency signal is 39.375 kHz for the subcarrier regenerator in the receiver. This pilot frequency is 2.5 x 15,750 Hz. The audio modulating frequency range of the L-R signal is 50 to 7,875 Hz, which is enough to give the extra dimension of stereo sound.
SUMMARY
1. In FM, the frequency of the transmitted carrier varies with the amplitude of the audio modulating voltage. Center or rest frequency is the carrier frequency with zero modulation voltage. Deviation is the frequency change from center frequency. Swing is the total deviation above and below center frequency.
2. The FCC defines 100 percent modulation as ± 25 kHz swing for the FM sound in television broadcasting and ± 75 kHz for commercial FM broadcast stations in the 88- to 108-MHz band.
3. A reactance-tube circuit provides either X t or X. that can be varied by its control grid voltage. The reactance tube then varies the frequency of a tuned oscillator.
4. Preemphasis in FM transmission boosts the audio amplitude and the resulting carrier deviation to improve the signal-to-noise ratio for higher audio frequencies. At the receiver, deemphasis after the FM signal is detected reduces the amplitude of higher audio frequencies to provide the original audio frequency response. The specified time constant is 75 us.
5. For slope detection of an FM signal, the IF center frequency is at the side of the IF response curve, to produce amplitude variations corresponding to the frequency variations. A diode detector can then recover those variations corresponding to the audio modulating signal. Slope detection is the reason why an AM receiver can receive FM signals.
6. A discriminator is a balanced FM detector using two diodes. The tuned input transformer changes the frequency variations of the IF signal to amplitude variations that are detected to produce audio output signal. The response curve of a discriminator is an S curve, consisting of two IF response curves of opposite polarity (see Fig. 27-9).
7. In the center-tuned or phase-shift discriminator, both the primary and the secondary are tuned to center frequency.
8. A limiter stage is a saturated class C amplifier to reduce amplitude variations in the IF signal.
9. The ratio detector uses a center-tuned input transformer with two diodes in series to charge the stabilizing capacitor (see Fig. 27-12). No limiter stage is necessary, as the ratio detector rejects AM interference.
10. In the quadrature-grid detector, the input IF transformer and quadrature coil are tuned to center frequency (see Fig. 27-16). No limiter stage is necessary, as the detector rejects AM interference. The amplified audio output in the plate circuit is enough to drive the audio output stage.
11. The quadrature coil is aligned with weak signal from a station for minimum hiss in the sound and maximum undistorted audio output.
12. Push-pull audio output stages can use PNP and NPN transistors for complementary symmetry.
13. In intercarrier sound receivers, the difference frequency of 4.5 MHz is produced as a beat in the sound converter stage, with the modulation of the FM sound signal. The sound IF amplifier and FM detector are always aligned at the center frequency of 4.5 MHz.
14. Intercarrier buzz is produced by 60-Hz blanking pulses from the picture signal in the 4.5-MHz intercarrier sound signal. The buzz can be reduced by AM rejection circuits and exact alignment of the FM detector. In addition, the sound IF response must be low in the common IF amplifier, compared with picture signal.
Self-Examination (Answers at back of guide)
Part A -- Fill in the missing answer.
1. The assigned carrier frequency of an FM broadcast station is 96.3 MHz. Its FM signal has a rest frequency or center frequency of MHz.
2. If 4-V peak audio amplitude changes the rf signal frequency from 200 to 210 kHz, the frequency deviation is kHz.
3. The total swing, then, for 8-V peak-to-peak audio is kHz.
4. For 100 percent modulation of the associated sound signal, the total frequency swing is kHz.
5. If 2-kHz deviation is produced by 2-V audio, then modulating voltage of 4V will produce a deviation of kHz.
6. If the audio modulation in Question 5 has the same amplitude but double the frequency, the deviation will be kHz.
7. The term quadrature indicates a phase angle of degrees.
8. The time constant for preemphasis is
9. The dc output of a balanced discriminator at center frequency is V.
10. The FM detector for the intercarrier sound signal is tuned to _ MHz.
Part B -- Answer True or False.
1. In FM, the loudest sounds produce maximum frequency deviation.
2. In FM, the audio modulating frequency determines the rate of frequency swing.
3. A 2-MHz carrier swings ± -100 kHz. Therefore, the instantaneous carrier frequency varies between 1.9 and 2.1 MHz.
4. A frequency swing of - ± - 5 kHz corresponds to 5 percent modulation for the television sound signal.
5. De-emphasis of the detected signal provides the most attenuation for the highest audio frequencies.
6. A separate diode is generally used in color receivers for the 4.5-MHz sound converter.
7. In a reactance-tube circuit, the grid feedback voltage is 90 degrees out of phase with the plate voltage.
8. AM rejection circuits in the FM receiver reduce noise and interference.
9. Push-pull amplifiers with transistors can eliminate the need for center-tapped transformers.
10. In a limiter stage, a typical time constant for grid-leak bias is 0.2 s.
11. Slope detection enables an AM receiver to detect an FM signal.
12. In an intercarrier sound receiver with a ratio detector, the primary and secondary are aligned at 4.5 MHz.
13. In the center-tuned discriminator, the primary and secondary voltages are 90 degrees out of phase at center frequency.
14. In the quadrature-grid detector, the signal grid and quadrature grid are 90 degrees out of phase at center frequency.
15. The audio output voltage of a quadrature-grid detector is usually 2 to 5 µV. 16. In a quadrature-grid detector, the audio output voltage is taken from the plate circuit.
17. The IF stages in a ratio-detector receiver can be aligned for maximum stabilizing voltage.
18. If the sound IF response is too high in the common IF amplifier, the result can be sound in the picture and buzz in the sound.
19. The sound takeoff trap is always tuned to 4.5 MHz in intercarrier sound receivers.
20. The S response curve of a discriminator shows two opposite polarities of detected output voltage.
Essay Questions
1. Compare how the carrier wave varies with audio modulation for AM and FM.
2. Define center frequency, deviation, swing, and percent modulation.
3. What characteristic of the FM signal determines loudness of the reproduced audio signal?
4. Define phase modulation. Why does PM produce equivalent FM?
5. Give two reasons for the improved noise reduction in an FM system.
6. Give two advantages of FM over AM and one disadvantage of FM, with both in the VHF band.
7. Why is deemphasis necessary in the FM receiver?
8. What are two important differences between an FM receiver and an AM receiver?
9. Give numerical values for the beat frequencies in the output of the mixer, showing that the amount of frequency swing of the 41.25-MHz IF signal in the receiver is the same as the FM sound signal transmitted in channel 2 at 54 to 60 MHz.
10. Compare how the 4.5-MHz IF signal is obtained in monochrome and color receivers.
11. Give three requirements for detecting an FM signal.
12. What is meant by slope detection?
13. Why is AM rejection an essential requirement of an FM receiver?
14. Draw the schematic diagram of a phase-shift discriminator circuit for an IF center frequency of 4.5 MHz and briefly describe how the circuit operates. Label the audio takeoff point.
15. Draw the schematic diagram of a balanced ratio circuit for an IF center frequency of 4.5 MHz. Indicate the audio takeoff point and the stabilizing voltage.
16. In the quadrature-grid detector circuit, where is the I= signal applied and where is the audio takeoff point?
17. Give two advantages of the quadrature-grid detector, compared with the discriminator.
18. Describe how to align the quadrature-grid detector at 4.5 MHz, using the trans mitted sound signal.
19. Give two reasons why television receivers use intercarrier sound. Give one disadvantage of intercarrier sound.
20. When aligning by the voltmeter method, what is the required indication when tuning the secondary in a phase-shift discriminator and in a ratio detector? Where is the meter connected in both cases?
21. Show the connections of the dc voltmeter and balancing resistors for aligning the secondary in a single-ended ratio detector.
22. In a sound IF circuit consisting of two IF stages and a ratio detector, describe how to align the entire section by: (a) the dc voltmeter method with a signal generator, and (b) the visual response curve method. Show the IF and detector curves, with marker frequencies for an IF center frequency of 4.5 MHz.
23. In a circuit consisting of two IF stages, limiter, and center-tuned discriminator, describe how to align the entire section by: (a) the dc voltmeter method with a signal generator, and (b) the visual response curve method. Show curves and marker frequencies for an IF center frequency of 10.7 MHz.
24. Describe how to align the 4.5-MHz sound IF section in Fig. 27-24.
25. In Fig. 27-21, give the functions of the following components: Q701, Q905, C7/. 1 , C70„, R707 , and T u.. 26. In Fig. 27-21, (a) how is the base voltage of 3 V obtained for Q701? (b) How is the base voltage of 14 V obtained for Q905? 27. In Fig. 27-24, give the functions of the following components: R2„ 2, R21, , C2 0 2. R2 0 7, T2011, C210, C2121 C2 in,' and T104.
28. In Fig. 27-25, give the functions for L,11, /- 502 , and 10501.
Problems (Answers to selected problems at back of guide)
1. An audio modulating voltage of 3 V at 1,000 Hz produces a frequency deviation of 15 kHz. Assuming linear modulation, calculate the deviation for the following examples of audio: (a) 1 V at 1,000 Hz; (b) 3 V at 1,000 Hz; (c) 6 V at 500 Hz; (d) 9 V at 100 Hz; (e) 0.3 V at 10 Hz.
2. Repeat Prob. 1 for a modulation system in which 3-V audio produces 10-kHz deviation.
3. For the RC de-emphasis circuit in Fig. 27-4, calculate the exact frequency at which X. equals R. What is the attenuation in dB at this frequency, compared with the response at 100 Hz?
4. A de-emphasis circuit has R of 75,000 i2 and C of 0.001 F. Consider this a series ac circuit with 10-V rms audio signal applied. (a) Make a table listing the values of X,., I, and V. at 100 Hz, 500 Hz, 1 kHz, 5 kHz, 10 kHz and 15 kHz. (b) Draw a graph showing the V,. values plotted against frequency.
5. In Fig. 27-21, determine the emitter current of Q905.
6. Give the function of each stage, with input and output signals, for the block diagram in Fig. 27-26 below, for the associated sound.
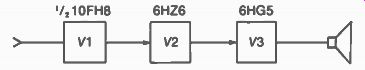
FIGURE 27-26 FOR PROBLEM 6