The work required may include antenna installation, replacing the picture tube, adjusting the setup controls, and troubleshooting defective circuits. Alignment is seldom necessary. Most troubles are caused by a defective tube, capacitor, resistor, or semiconductor device. Since tubes are the most common cause of trouble, they should be checked first, preferably by substituting a new tube. Also, circuits with high values of current or voltage are more likely to have trouble. These include the power supplies and deflection circuits, especially the horizontal output stage. The general idea of localizing the troubles to a section for raster, picture, color, or sound is described in Section 19. Here, we can analyze specific methods for finding the defective component. In addition, complete receiver circuits are included to show how all the sections fit together. The topics described here are:
28-1 Troubleshooting techniques
28-2 Test instruments
28-3 Dc voltage measurements
28-4 Oscilloscope measurements
28-5 Alignment curves
28-6 Signal injection
28-7 Color-bar generators
28-8 Schematic diagram of monochrome receiver with tubes
28-9 Schematic diagram of solid-state color receiver
28-10 Transistor troubles
28-1 Troubleshooting Techniques
We assume the trouble has been localized to one stage or section. Remember that the receiver was probably working fine until the trouble happened. Therefore, check for simple problems first. Substitute a new tube and other plug-in components that can be replaced easily.
Check for good connections at the pins of a module board or an interconnecting cable.
Power circuits often have a fuse, which should be tested.
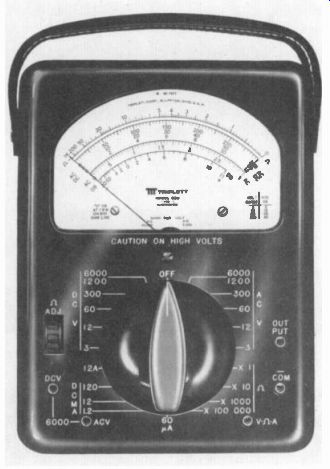
Then voltage and resistance measurements can be made, using a multimeter (Fig 28-1). Normal dc voltages, measured to chassis ground, are on the manufacturer's schematic diagram. In the signal circuits, the dc voltages are given for no ac signal input in order to eliminate the effects of AGC bias.
DC voltage tests. Always check the dc supply voltages. Then measure the electrode voltages at the pins for tubes, transistors, and IC units.
Normal cathode bias voltage on a tube generally means that the plate and screen-grid currents are correct. Similarly, normal emitter bias or source bias on a transistor amplifier indicates normal operation. Although the stage is usually amplifying ac signal, this function cannot be accomplished without the dc operating voltages.
A dc voltage that is too high indicates an open circuit. Look for an open resistor or coil.
Also, the tube or transistor may be off, creating an open circuit.
A dc voltage that is too low indicates a short circuit. Look for a shorted capacitor. Also, the tube or transistor may be conducting too much current because of incorrect bias.
Resistance tests. With the power off, resistors can be checked for an open, which reads infinity on the ohmmeter. An open coil winding or open fuse also has infinite resistance. Check capacitors for a short circuit, which reads zero on the ohmmeter. In a circuit that has B+ voltage, a shorted bypass or coupling capacitor changes the dc voltage distribution. However, an open capacitor does not affect the dc voltages.
For resistance checks in transistor circuits, be sure that the ohmmeter does not give a false indication by biasing a junction on. You can open any parallel paths or use reverse polarity for the ohmmeter leads.
FIGURE 28-1 VOLT-OHM-MILLIAMETER OR VOM. ACCURACY IS 2 PERCENT FOR DC MEASUREMENTS.
(TRIPLETT CORPORATION)
Resistors generally do not short but can become open because of age or excessive current. When an open resistor has a bypass capacitor, look for a short in the capacitor. This allows too much current in the resistor, burning it open. A resistor also can be partially open, with too high a resistance. Metal-film resistors often open where the leads connect to the film.
Effect of an open circuit. Not only does an open circuit have infinite resistance, but its effect can be checked with a dc voltmeter. The voltage is too high at one side of an open circuit and zero at the other side. This voltage check can be used to test a resistor, coil, or fuse for an open.
Ac voltage tests. An oscilloscope is used for checking ac video signal and deflection voltages. Normal waveshapes with peak-to-peak amplitudes are shown in the manufacturer's service notes. In the color circuits, the wave forms are shown with signal from a color-bar generator.
Open capacitor. This possibility can be checked by temporarily bridging the suspected capacitor with a good capacitor in parallel.
Capacitor substitution boxes for this purpose are available with a wide range of capacitance values. With an ohmmeter, an open capacitor does not show charging action.
Tube-socket adaptor. As shown in Fig. 28-2, this unit is an extension about 2 in. high. You plug the adaptor into the tube socket and the tube into the adaptor. Each pin on the adaptor has a tab for connecting the meter or oscilloscope. This way you can make connections to the tube pins from the top of the chassis.
Replacing components. Keep the same positions for connecting leads and ground returns.
This lead dress is often critical for high frequencies because of feedback and with high voltages to prevent corona and arcing. When replacing a resistor, a higher wattage rating than the original can be used. Also, a higher dc voltage rating is permissible for capacitors, except for electrolytic capacitors, which need the specified forming voltage. Do not replace mica or ceramic capacitors with tubular capacitors, because their inductance can affect the coupling or bypassing for high frequencies.
FIGURE 28-2 TUBE-SOCKET ADAPTOR. HEIGHT IS 2 IN.
On printed-wiring boards, an individual capacitor or resistor usually can be removed easily by clipping the leads close to the component. Then the new unit is just soldered to the old leads without disturbing the eyelet connections on the board. However, desoldering tools are available to suck out the solder at the eyelet.
Just be careful not to apply excessive heat to the printed wiring.
Product safety. Many parts in television receivers have special safety-related characteristics to protect against arcing, breakdown, x-rays, or fire hazard. These features may not be evident just from visual inspection. Such special components are often identified by the manufacturer by a shaded area on the schematic diagram and notes on the parts list. When re placement is necessary, the new components should have the required safety characteristics.
28-2 Test Instruments
The main requirement is a volt-ohmmeter. The multimeter actually makes the test that tells which component is defective. An oscilloscope is used to observe the video, sync, and color signals, to check waveshapes in the deflection circuits, and for visual response curves. More test instruments and a brief description of their functions are listed in the following sections.
Multimeter. This unit can be a volt-ohm milliammeter (VOM) or vacuum tube voltmeter (VTVM). However, the VTVM now is generally solid-state and may be battery-operated. This feature makes it portable, without the need for plugging into the ac power line. The VOM is a portable meter without any internal amplifier.
When the meter does not operate from the power line, the black ground lead of the meter can be connected to any point in the receiver.
Otherwise, the black lead must be at chassis ground or the meter readings may be incorrect.
The advantage of the VTVM type of dc voltmeter is its high input resistance of 11 m-ohm. on all ranges. A VOM generally has a sensitivity of 20,000 WV. On the 100-V range, as an example, the input resistance is 100 x 20 M-ohm = 2 M12. This value is really high enough to prevent meter loading in typical transistor circuits.
The dc voltmeter should have a low range of 1 to 3 V, full-scale, for transistor circuits.
Then the meter can read bias voltages from base to emitter. Typical values are 0.2 to 0.7 V. Oscilloscopes. The CRT in the oscilloscope shows a picture of the measured voltage. In order to observe color signals, response above 3.58 MHz is necessary for the vertical amplifier in the oscilloscope. Most units for this purpose have response up to 10 MHz.
Remember that 3.58 MHz is the frequency of the chroma signal before the demodulators.
However, after detection, the color video signals have the bandwidth of 0 to 0.5 MHz. Most general purpose oscilloscopes can easily show the waveforms of B - V. R - V. G - Y, B, R, and G video signals.
For the internal horizontal deflection, or time base, some oscilloscopes have triggered sweep. This method provides better synchronization of the oscilloscope trace, compared with a free-running time base. In addition, the triggered sync allows the time base to be calibrated.
As an additional feature, the oscilloscope can be a dual-trace type. This CRT shows two waveforms, one above the other, synchronized in time for comparisons of phase angle or waveform distortion.
It should be noted, however, that simpler oscilloscopes can perform the basic functions in testing television receivers. For alignment, the oscilloscope needs response only for 60 Hz, as the waveform is a detected signal. In video signal waveforms, the main requirement is to see the peak-to-peak amplitude, with vertical or horizontal sync. In the deflection circuits, the waveforms have the frequencies of 60 Hz for vertical scanning and 15,750 Hz for horizontal scanning.
Many oscilloscopes have calibrated vertical deflection. Then you can read the peak-to peak amplitude of the trace.
A low-capacitance probe (LCP) is generally needed to avoid distorting the waveshapes because of detuning. The LCP reduces the signal to the oscilloscope to 1 I of the input to the probe.
It should be noted that in transistor circuits, the oscilloscope waveshapes at the collector are better than those at the base. The reason is that the base-emitter junction has a nonlinear Eli characteristic.
Dot-bar generator. This unit supplies black and-white dots and crosshatch pattern for convergence adjustments, plus 3.58-MHz chroma signal for color bars. The chroma signal is used for checking the color circuits in the receiver.
Sweep generator. This unit is used to obtain visual response curves with an oscilloscope. In addition to the FM signal output, or sweep frequencies, the generator usually has built-in markers for the following alignment curves: rf, IF, 4.5-MHz sound, and 3.58-MHz color. A typical sweep generator is shown in Fig. 23-22 in the section on IF alignment.
Audio sine-wave or square-wave genera tor. This unit provides signal up to about 200 kHz for testing audio and video amplifiers. The square waves are useful for checking phase response.
Transistor tester. This unit tests for opens, shorts, leakage, and transconductance with both junction transistors and field-effect transistors.
Transistor curve tracer. This unit is used with an oscilloscope to provide a trace of the transistor characteristic curve for testing the transistor.
Dc power supply. This small unit provides B+ voltage for operating solid-state circuits, without the need for the power supply in the receiver.
Picture tube tester-rejuvenator. Besides testing emission from the cathode of the CRT, the rejuvenator can sometimes boost cathode emission, burn out internal shorts, or weld connections.
Picture tube test jig. As shown in Fig. 28-3, this unit has a color picture tube, with all its associated circuits, to operate the receiver chassis or a test bench in the service shop.
FIGURE 28-3 TEST JIG WITH COLOR PICTURE TUBE (MAGNAVOX CO.)
28-3 DC Voltage Measurements
Signal voltage in an amplifier is actually a pulsating or fluctuating dc voltage. The reason is that the plate or collector needs the B+ voltage to provide voltage gain in the stage. A dc volt meter reads the average dc level. The oscilloscope shows the ac signal variations. If the dc voltages are far from normal, the ac signal will usually not be correct. This factor is why dc voltage measurements are useful in localizing troubles in the ac signal.
In Fig. 28-4a, the fluctuating dc voltage represents signal at the plate or collector of a video amplifier. The variations in dc voltage result from signal variations in current through the load resistor. We can assume a B+ supply voltage of 140 V for this stage to allow for a signal swing between the peaks of 120 and 30 V. The average axis, shown at 50 V, is not through the middle of the voltage waveform because the signal is close to white for most of the cycle.
Since a dc voltmeter responds only to the average level of the signal, the meter at the plate or collector reads 50 V. the average dc value.
This dc component of 50 V is shown in Fig. 28-4b. The ac component of the signal consists of the variations around the average dc axis, as shown in Fig. 28-4c. in this example, the ac signal variations are between 120 and 30 V, for a peak-to-peak value of 90 V. It should be noted that an ac-coupled oscilloscope shows just the signal variations in Fig. 28-4c, around the zero axis at the center of the screen. However, a dc-coupled oscilloscope shows the dc level also, as in a.
Zero voltage at the plate or collector. Assuming the stage has a circuit for B+ voltage, this trouble means the supply path is open. Look for an open in the load resistor or decoupling resistor. With a transformer in the B+ supply line, check for an open winding.
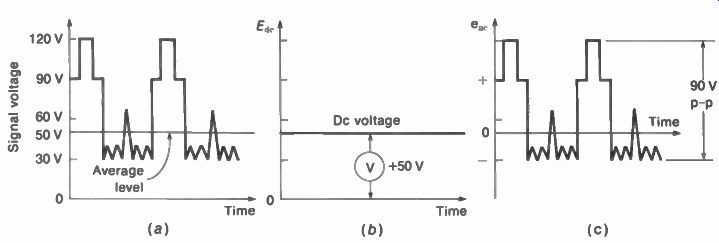
FIGURE 28-4 FLUCTUATING DC VOLTAGE AT PLATE OR COLLECTOR OF VIDEO AMPLIFI
ER (a) AC SIGNAL COMBINED WITH AVERAGE DC LEVEL. (b) DC LEVEL OF 50 V MEASURED
WITH DC VOLTMETER. (c) AC SIGNAL OF 90 V p-p, MEASURED WITH OSCIL LOSCOPE.
Full B+ voltage at the plate or collector. This trouble means the supply path is not open but there is no voltage drop by the plate or collector current. Assuming a resistance of 1 k-ohm or more, either for the load or for isolation, no voltage drop means zero current. Typical causes are (1) a defective tube or transistor, (2) an open cathode or emitter circuit, (3) zero screen-grid voltage, (4) excessive negative bias at the control grid, and (5) zero forward bias at the base.
When a stage has a resistance plate load, full B+ at the plate or collector shows that the supply voltage is connected but there is no IR drop. Without plate or collector current, there cannot be any output signal. Stages with a resistance load include the video amplifier, sync amplifier, first audio amplifier, and multivibrator deflection oscillators.
It should be noted that in tuned stages, such as the rf amplifier, picture IF amplifier, 4.5-MHz sound IF amplifier, and 3.58-MHz chroma amplifier, there may not be any resistance to drop the supply voltage. Then full B+ voltage at the plate or collector is normal.
Zero screen-grid voltage. This trouble usually results when a shorted bypass capacitor causes excessive current through the screen-grid resistor, which then burns open. In most tubes designed for positive screen-grid voltage, with out this accelerating potential there is no plate current and no output signal.
Cathode bias. An open cathode circuit opens the return path for plate current. The result is zero plate current and full B+ voltage at the plate. It is important to note that when you read the cathode voltage, the indication is not zero because the meter completes the cathode circuit. Since the meter resistance is much higher than the normal cathode resistance, the voltage reading is higher than normal instead of zero.
Actually the dc voltmeter across the open cathode circuit reads the grid cutoff voltage of the tube.
Emitter bias. Like a cathode, the emitter circuit completes the path for collector current. An open emitter, therefore, results in zero output current and full B+ voltage at the collector.
Dc-coupled stages. In this case, high dc voltages at the input circuit of the tube or transistor are normal because there is no coupling capacitor to block the B+ voltage. As an example for a tube, the control grid may be at 105 V. but the cathode at 108 V results in a grid-cathode bias of 105 - 108 = -3 V. Similarly, with the base at 30.6 V and the emitter at 30 V, the V„, is 0.6 V for forward bias on an NPN transistor.
Grid-leak bias. For tubes, the negative dc voltage at the control grid indicates the amount of ac signal rectified by the grid-cathode circuit. Oscillator stages generally use grid-leak bias, produced by the feedback. The presence of the bias indicates the oscillator is operating; no bias means there is no feedback and the oscillator is not operating.
In an amplifier that uses grid-leak bias, this dc voltage indicates the amount of ac signal input. The horizontal output stage usually has grid-leak bias of -40 to -70 V. produced by drive from the horizontal oscillator. Stages that generally use grid-leak bias are listed in Table 28-1, with typical values. These voltages are preferably measured with a VTVM for high impedance.
Detected signal voltage. The dc voltmeter can also be used to measure rectified ac signal voltage out of a detector. Typical values are 1 to 3 V. For instance, rectified voltage out of the video detector shows IF signal input.
28-4 Oscilloscope Measurements
The oscilloscope is used for measuring peak-to peak ac voltages. Besides showing the voltage waveform, the oscilloscope is necessary for measurements on a signal that is not a sine wave. Common uses in troubleshooting include checking video signal, chroma signal, sync pulses, and vertical or horizontal deflection voltages.
TABLE 28-1 TYPICAL GRID-LEAK BIAS VOLTAGES FOR TUBES
A typical oscilloscope is shown in Fig. 28-5, with the accessory probes in Fig. 28-6. Its vertical amplifier is calibrated so that peak-to peak voltage can be read directly. The cable for signal input to the vertical amplifier is used with one of the following: low-capacitance probe (LCP), direct probe, or demodulator probe.
Direct probe. This is just an extension of the shielded lead, without any isolating resistance.
Shielding is needed to prevent pickup of interfering signals. However, the shielded cable has a capacitance of about 60 pF. Also, the input capacitance of the oscilloscope is usually 10 pF. The total C is 70 pF. Therefore, the direct probe can be used only in circuits where this capacitance has little effect on the circuit to which the lead is connected. This usually means audio frequency circuits. In visual alignment, the direct probe can be used for detected sweep signal, as this frequency is 60 Hz.
Low-capacitance probe. This probe has an internal series R to isolate the capacitance of the cable and oscilloscope. Usually, the probe R is 9 times the internal R of the oscilloscope. Then the voltage divider provides one-tenth of the probe input to the oscilloscope. This means you must multiply the oscilloscope reading by 10 for the actual signal input at the probe. As an ex ample, when the oscilloscope trace measures 8 V p-p with the LCP, then the actual signal voltage in the receiver circuit is 80 V p-p.
The low-capacitance probe must be used in high-frequency or high-resistance circuits.
Also, the LCP is needed to observe the correct waveform of nonsinusoidal voltages. These factors mean that the LCP is used for video, sync, and deflection voltages, especially since there is usually enough signal to allow for 1:10 voltage division.
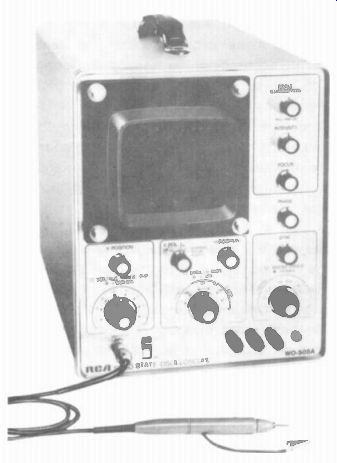
FIGURE 28-5 TYPICAL 5-IN. OSCILLOSCOPE WITH DIRECT/LOW-CAPACITANCE PROBE.
(RCA)
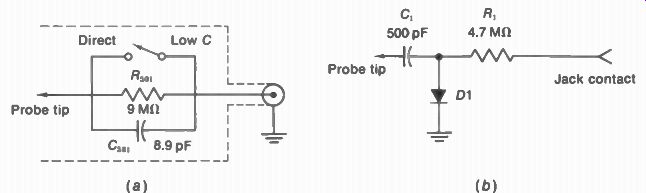
FIGURE 28-6 SCHEMATIC DIAGRAMS OF OSCILLOSCOPE PROBES (a) DIRECT AND LOW
CAPACITANCE. (b) DEMODULATOR (RCA)
Demodulator probe. This probe has an internal crystal diode rectifier. Therefore, the probe can be used to detect the envelope of an amplitude-modulated IF or rf signal. Also, the probe rectifies the sweep-generator signal, if this is necessary for visual response curves in the video, chroma, or IF circuits. The polarity for the dc output voltage of the detector probe is usually negative. About 0.5 V or more signal is necessary for the diode to operate as a rectifier.
Current measurements. Although the oscilloscope is a voltage-operated device, current waveforms can be observed and peak-to-peak measurements made the same way. This is done by inserting a known resistance in series with the circuit in such a manner that the current to be measured flows through the resistor. The voltage across this resistor is then coupled to the oscilloscope so that the waveshape can be observed and its amplitude measured as usual.
With the voltage measured, I can be calculated as E/R. The current amplitudes are in peak-to peak values, like the voltage amplitudes. As an example, suppose sawtooth deflection voltage across a 10-a R measures 6 V p-p. The current I then is 6/i„, equal to 0.6 A or 600 mA p-p.
The current waveshape is identical with the observed voltage waveshape. Current and voltage are in phase with each other in a resistance, and there is no change in waveshape.
The resistance to be inserted temporarily for the current measurement should be as small as possible so that it will not change the current in the circuit appreciably. In high-current circuits such as the deflection coils for transistors, a resistance of 1 II is high enough.
Frequency comparisons. In order to check frequencies with the oscilloscope, the unknown signal voltage is compared with a voltage source of known frequency. Since we are usually interested in the scanning frequencies of 60 and 15,750 Hz, which are audio frequencies, an audio signal generator with an accurate frequency calibration is used. The usual procedure is as follows:
1. Connect the voltage of unknown frequency to the vertical input of the oscilloscope. Ad just the internal sweep frequency for a trace of two cycles on the screen.
2. Disconnect the voltage and connect in its place the output of the audio oscillator.
3. Adjust the audio oscillator frequency for two cycles on the screen. Do not change the oscilloscope frequency controls.
4. The frequency of the audio oscillator is now equal to the frequency of the unknown voltage previously connected, since they both produce a trace of two cycles with the same sweep frequency.
The setting of the gain controls does not matter in the frequency comparison, and they can be adjusted for a pattern of convenient size.
The results can be very accurate when no sync is used for the oscilloscope sweep and the signal generator frequency is correct.
This same procedure can be used to check the accuracy of the signal generator at 60 and 15,750 Hz. For 60 Hz, compare the genera tor frequency with the ac power line. For 15,750 Hz, compare the generator frequency with the output of the horizontal deflection oscillator in a receiver where the picture is in horizontal sync, for monochrome. On a color broadcast, the horizontal line frequency is 15,734 Hz.
FIGURE 28-7 LISSAJOUS PATTERNS COMPARING PHASE BETWEEN TWO SINE WAVES OF THE SAME FREQUENCY. THE PHASE ANGLE IS f0.
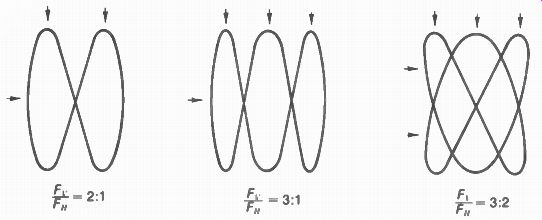
FIGURE 28-8 LISSAJOUS PATTERNS COMPARING FREQUENCIES OF TWO SINE WAVES. F,
IS FREQUENCY OF SIGNAL TO OSCILLOSCOPE VERTICAL INPUT; F _p IS FREQUENCY OF
HORIZONTAL INPUT. ARROWS INDICATE CLOSED LOOPS COUNTED FOR THE FREQUENCY RATIO.
Phase-angle measurements. The oscilloscope can also be used to compare the phases of two sine-wave voltages of the same frequency. One sine-wave voltage is applied to the vertical input of the oscilloscope. At the same time, the other sine-wave voltage is applied to the horizontal input. The oscilloscope internal sweep is not used. Both the vertical and horizontal voltages should produce the same amplitude in the oscilloscope trace.
The combined trace of two sine-wave voltages will look like one of the patterns in Fig. 28-7. The phase angle H can then be determined by calculating the ratio of the lengths B and A as shown, which gives the sine of the angle. For a circle, B/A equals 1 for the sine, and the angle is 90 deg . When B is one-half A, the sine equals 0.5 and N is 30 ° Remember, though, that phase angle measurements apply only for sine waves.
Lissajous patterns. The phase-angle patterns actually show a 1:1 frequency ratio. For higher ratios, the patterns in Fig. 28-8 are produced.
Count the loops across either the top or bottom of the trace for the value of F _p and count the loops at either side for F„. The frequency ratio is then equal to F,/F„. Be sure to count only closed loops: open loops should not be counted at all.
As an example, assume the horizontal input is 60-Hz power-line voltage as a reference frequency. The vertical input is signal from an audio oscillator; the calibration of the oscillator's frequency dial is to be checked. For a circle or line pattern, where F,IF„ is 1, the audio signal generator frequency is 60 Hz. With a ratio of 2 for F, IF _p, the vertical input frequency is 120 Hz. Furthermore, frequencies that are not exact multiples can be compared using this method.
For the case of F,IF„ equal to "/2, in this example the vertical input is 3/, x 60 = 90 Hz.
How to reproduce the picture on the oscilloscope screen. The cathode-ray tube in the oscilloscope can be used to see the picture on a green screen, if this is desired in checking a receiver. Note the following requirements:
1. The video signal output from the receiver is connected to the Z axis or intensity-modulation terminal of the oscilloscope. This terminal couples the signal to the control grid of the cathode-ray tube.
2. Sawtooth deflection voltage at 60 Hz from the receiver is connected to the vertical amplifier of the oscilloscope.
3. Sawtooth deflection voltage at 15,750 Hz is coupled to the horizontal amplifier of the oscilloscope, or the oscilloscope internal sweep can be used. With oscilloscope sweep, synchronization of the picture is difficult. With deflection voltage from the receiver, use an isolation resistor to prevent detuning of the horizontal oscillator.
The oscilloscope vertical and horizontal amplifiers then provide a scanning raster on the screen. Use the oscilloscope gain controls to adjust for convenient height and width. The video signal may produce a positive or negative picture, depending on polarity. A minimum of about 25 V p-p video signal is necessary.
Vectorscope. This test instrument combines a color-bar generator with an oscilloscope to show the phase angles of the hues. However, a separate generator can be used with a conventional oscilloscope to produce the vectorscope pattern. The output signals of the R - Y and B - Y demodulators are fed to the vertical and horizontal amplifiers of the oscilloscope. The trace is a circle with spokes or petals, as in Fig. 28-9. Each petal is a vector in the rosette pat tern, corresponding to the phase angle of one of the color bars.
28-5 Alignment Curves
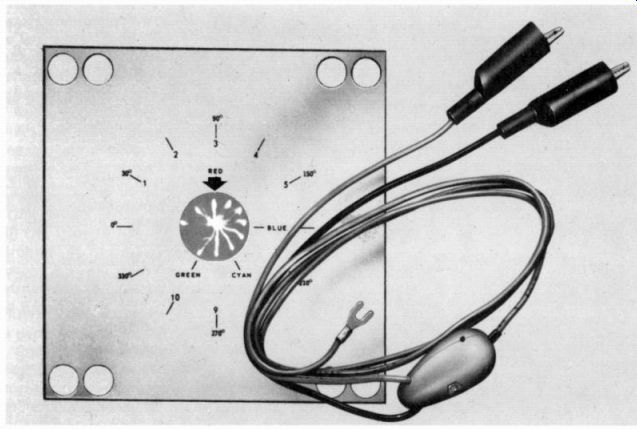
FIGURE 28-9 THE VECTORSCOPE TECHNIQUE WITH ACCESSORY PROBE AND TYPICAL ROSETTE
PATTERN ON SCREEN, FOR OSCILLOSCOPE IN FIG. 28-5. (RCA)
Figure 28-10 summarizes the visual response curves for different sections of the receiver, including chroma. The curves are shown up ward on the oscilloscope screen for positive polarity. However, the correct curve may be down from the zero baseline, with negative in put voltage to the oscilloscope. Be sure to have the curve in the polarity specified by the manufacturer's service notes. The wrong polarity can result from oscillations or overload distortion.
Which side of the curve corresponds to picture signal or sound signal is determined by the marker frequencies. The sweep frequencies may increase toward either the right or the left, depending on the generator. Some generators have a frequency-reversing switch. Notice that the picture carrier with its video modulating frequencies is at one side of the curves, while the sound and chroma subcarrier frequencies are on the opposite side. The sound and chroma frequencies are very close to each other.
For correct curves, the operating conditions of the circuits must not be changed by the test equipment. Use typical bias voltages and signal levels. Do not connect the generator directly to any circuit being tested unless a matching pad is used.
The following checks can be made to be sure the curve you see is the actual receiver response:
1. Reduce the signal input to make sure that the curve just becomes smaller, without changing its shape.
2. A curve that is perfectly flat probably is produced by overload distortion because of too much signal in either the receiver or oscilloscope.
3. The curve should disappear when you turn off the signal generator. If the curve re mains, the circuit is oscillating.
4. Reduce the marker amplitude to zero to see if the curve remains the same with or without the marker. If you see two markers that move in opposite directions when the marker frequency is varied, this usually means the curves were not phased correctly before the blanking was turned on.
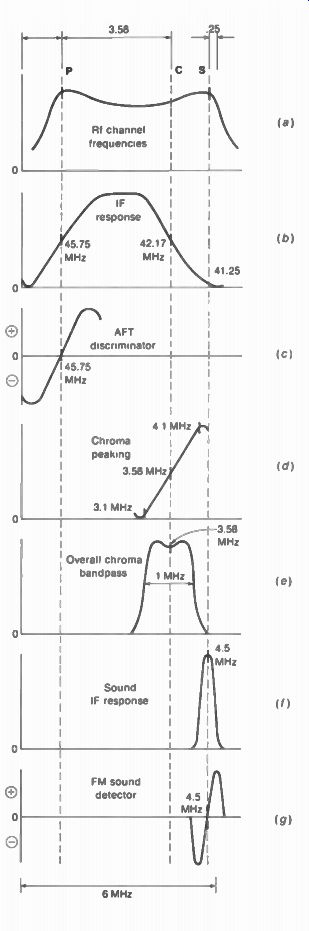
FIGURE 28-10 VISUAL RESPONSE CURVES FOR DIF FERENT SECTIONS OF TELEVISION
RECEIVER. (a) RF AMPLIFIER; (b) PICTURE IF AMPLIFIER; (c) DISCRIMINATOR FOR
AUTOMATIC FINE TUNING; (d) PEAKING FOR INPUT TO CHROMA BANDPASS AMPLIFIER;
(e) OVERALL 3.58-MHz BANDPASS, INCLUDING CHROMA PEAKING AND IF AMPLIFI ER;
(I) SOUND IF AMPLIFIER; (g) FM SOUND DETECTOR.
5. When the marker is too broad, it can be made narrower by connecting a 0.01-µF capacitor across the vertical input of the oscilloscope.
6. If the curve changes its shape when you touch the chassis, check the ground connections.
7. With weak signal input, the oscilloscope trace has "grass," which corresponds to snow in the picture, produced by receiver noise.
To summarize the requirements, you should have a clean curve without grass and with enough amplitude to see the markers clearly, and, most important, the curve should change only when you change the alignment adjustments.
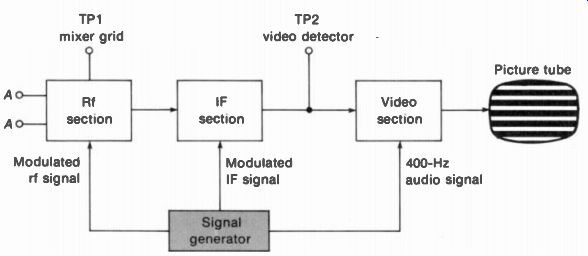
FIGURE 28-11 USING A GENERATOR TO INJECT TEST SIGNAL INTO RECEIVER CIRCUITS.
28-6 Signal Injection
In this method, your own test signal is used in the receiver circuits to see the effect on the screen of the picture tube. Figure 28-11 illustrates how a signal generator can be connected to check the video, IF, and rf sections. Individual stages also can be tested. Working back from the picture tube to the antenna input, you can localize a stage that does not pass the signal to produce bars on the screen. Note that this method is the opposite of using the signal from the station and checking waveforms with the oscilloscope. Now your generator supplies the signal and the picture tube shows the output. It is not necessary to use a sweep generator, as only one frequency is used for each test.
Generator signals. The following frequencies are used for the different sections:
1. Audio signal for the video section. This can be taken from an audio signal generator or the 400-Hz audio modulation on an rf signal generator.
2. IF signal at about 43 MHz for the picture IF section. This signal must have audio modulation, usually at 400 Hz, to produce bars on the screen.
3. Rf signal for any of the channel frequencies also with audio modulation.
Audio signal for the video section can be injected at the test point in the output circuit of the video detector. The IF signal input can be connected to the test point at the mixer grid, on the rf tuner. Finally, the modulated rf signal is connected to the antenna input terminals. Be sure the receiver is set for the channel frequency of the generator. The audio amplitude is generally 1 to 20 V. However, the rf output of the generator is usually less than 1 V. Injecting 60-Hz deflection voltage. With tubes, the 60-Hz heater voltage can be connected to the grid of the vertical amplifier to check operation of the output stage when there is no vertical scanning. Some vertical deflection on the screen shows the amplifier is operating.
Patching methods. This technique uses signal from a normal receiver to test a defective receiver. A few possibilities are "borrowing" CRT anode voltage, horizontal drive for the output stage, vertical deflection voltage, and audio signal. Also, the IF output cable from the tuner can be plugged into another receiver. Extension cables can be used. Also, a jumper wire may be needed for a common chassis ground between the two receivers. Use an isolation transformer for a chassis that is not isolated from the power line.
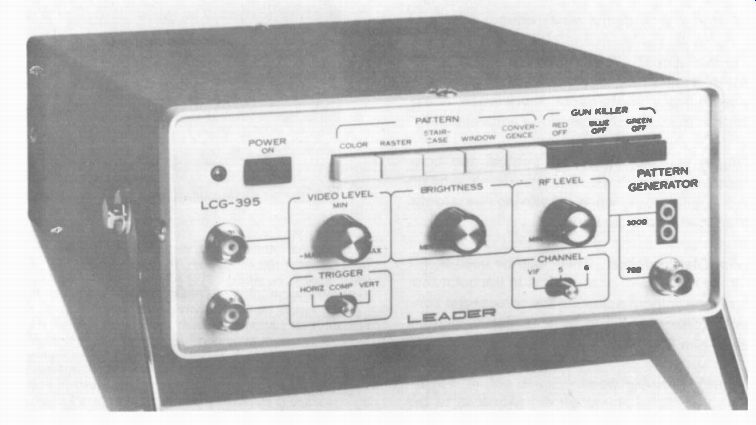
FIGURE 28-12 TYPICAL DOT-BAR GENERATOR. NOTE PATTERNS AVAILABLE FROM TOP
ROW OF SWITCHES. (LEADER INSTRUMENTS CORP.)
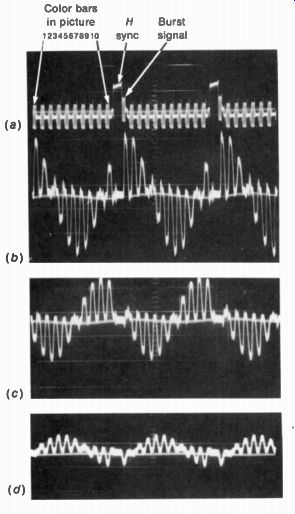
FIGURE 28-13 VIDEO SIGNAL WAVEFORMS WITH COLOR BAR SIGNAL. RELATIVE AMPLITUDES
ARE ALL TO THE SAME SCALE. (a) VIDEO DETECTOR OUTPUT: 1 V p-p FOR TRANSISTOR
CIRCUITS. (b) DEMODULATOR OUTPUT FOR -(B - Y) PHASE. MAXIMUM AMPLITUDE AT
BARS 1 AND 6 FOR B - 1 1 AXIS AND MINIMUM AT BARS 3 AND 9 FOR R - Y AXIS.
(c) DEMODULATOR OUTPUT FOR -(R - Y. MAXIMUM AMPLITUDE AT BARS 3 AND 9 FOR
R - Y AXIS AND MINI MUM AT BARS 1 AND 6 FOR B Y AXIS. (d) OUTPUT FOR -(G -
Y). MAXIMUM AMPLITUDE AT BARS 4 AND 10 FOR G - Y AXIS AND MINIMUM AT BARS
1 AND 7 FOR AXIS 90 AWAY
28-7 Color-Bar Generators
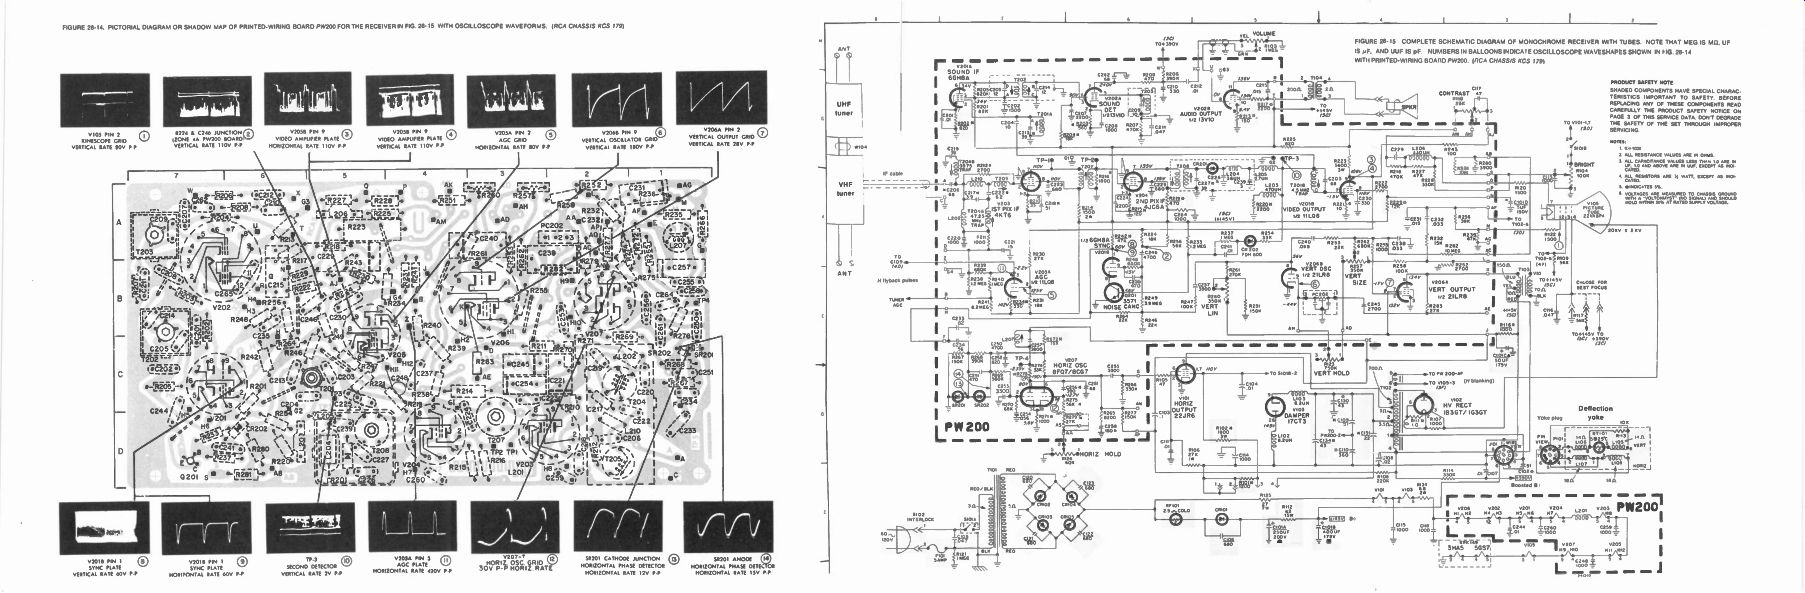
FIGURE 28-14, PICTORIAL DIAGRAM OR SHADOW MAP OF PRINTED-WIRING BOARD PW200
FOR THE RECEIVER IN FIG. 28-15 WITH OSCILLOSCOPE WAVEFORMS. (RCA CHASSIS KCS
179)
FIGURE 28-16 SCHEMATIC DIAGRAM OF SOLID-STATE COLOR RECEIVER, WITH OSCILLOSCOPE WAVEFORMS NOT SHOWN ARE RF TUNERS. AFC BOARD, REMOTE CONTROL . AND ONE-TOUCH AUTOMATIC CIRCUITS (GENERAL ELECTRIC 19JA CHASSIS)
TABLE 28-2 COLOR BARS IN KEYED RAINBOW PATTERN --- *Phase angles are clockwise from burst.
A typical unit is shown in Fig. 28-12, with a similar generator in Fig. 11-3. These are larger units that have multiple test signals in addition to color bars. Smaller dot-bar generators are avail able to provide just bars, dots, and crosshatch patterns. All these patterns are in black-and white for setup adjustments on a color picture tube, except the color-bar pattern for testing the chroma circuits. The rainbow of color bars and their phase angles are shown in color plates XI and XII. In addition to producing color bars, the generator in Fig. 28-10 has the following functions: Dot-crosshatch pattern. In this pattern, the white dots and crosshatch are combined. This pattern is used for convergence adjustments on a color picture tube.
Staircase signal. This provides shades of white and gray to check black-and-white tracking.
Raster. A white, noise-free raster is provided for purity adjustments. If the receiver does not have a normal-service switch, the generator can be used to provide the raster without a picture.
Window signal. The white rectangle about one-half the screen area provides low-frequency video signal. Furthermore, the window is exactly in the center for centering adjustments.
Trigger signals. These are vertical and horizontal synchronizing pulses for external sync on the oscilloscope when observing waveforms produced by the generator.
Gun-killer switches. These can be used to cut off the red, green, or blue guns in the color picture tube without adjusting the screen-grid controls in most vacuum tube receivers using a delta-gun CRT. Generator connections. Signal output is avail able from 300-ohm terminals for twin lead to the antenna terminals on the receiver. Most generators supply modulated rf output on channel 3, 4, or 5. The receiver must be switched to the channel of the generator. The rf output level is 1 to 10 mV. In addition, IF output can be taken from a 75-ohm jack for coaxial cable to the IF section of the receiver. Finally, the video output can be connected directly to the video amplifier. The video level is 1 to 3 V, in either positive or negative sync polarity.
The gated rainbow. The color bars and their phase angles in 30° steps are listed in Table 28-2.
The generator has an oscillator operating exactly 15,750 Hz below the color oscillator at 3.579545 MHz in the receiver. For every horizontal scanning line, therefore, the phase of the test signal shifts 360° with respect to the receiver oscillator. Furthermore, the generator has gating pulses to cut off the signal output every 30°. As a result, the generator output is divided into 30° intervals of bars with different hues. Each bar has a specific hue, 30' different from the next bar, with a black line between the bars for the time the signal is gated off.
Dividing 360° by 30° results in 12 intervals.
However, only 10 bars are visible. This specific number of bars can be used to see if there is horizontal overscan in the receiver. The two missing bars are blanked out by horizontal blanking in the receiver. In the generator, a horizontal sync pulse is inserted at a time that would be the twelfth bar. The generator output that would be the first bar is used as a color sync burst signal, also during horizontal blanking time. You can see this timing of signals in Fig. 28-13. The oscilloscope waveforms in the manufacturer's service notes for the color section of the receiver are generally with input signal from a gated-rainbow generator.
Oscilloscope waveforms for color bars. The photos in Fig. 28-13 are taken with a dual-trace, triggered oscilloscope to show the relative timing of the test signals from a color-bar genera tor. In Fig. 28-13a, at the top is the input signal of the generator, after the video detector. This shows 3.58-MHz chroma input before the color demodulation. Note the timing of the horizontal sync pulse, burst, and 10 color bars.
Figure 28-13b shows the color video output of the B - Y demodulator. Here there is no 3.58-MHz chroma but a gear-tooth of detected color video signal with a spoke for each bar. The demodulator output is maximum positive for the first bar. This hue is close to -(B - Y) phase or burst phase, as listed in Table 28-2. The output is maximum negative for the sixth bar, which is B - Y phase. This demodulator output is at a minimum or null at bars 3 and 9 for the R - Y axis, in quadrature phase with the B - Y axis.
Figure 28-13c shows the color video output of the R - Y demodulator. Here the demodulated voltage is maximum at bars 3 and 9 for phase angles on the R - Y axis. The null is at bars 1 and 6 for the axis of B - Y. Figure 28-13d shows the output for G - Y color video signal. Here the voltage is maximum at bars 4 and 10 for phase angles on the G - Y axis. For hues 90° away, the resulting null is at bars 1 and 7.
NTSC color-bar generator. This test instrument produces bars for red, green, and blue, with their complementary colors, at 100 percent saturation. The synchronizing signals and blanking pulses at 15,734 Hz, with the color burst, are inserted exactly as in television broad casting. Its function is testing broadcast equipment. However, the gated-rainbow generator, with hues 30° apart, is generally used for receiver servicing.
28-8 Schematic Diagram of Monochrome Receiver with Tubes
See Fig. 28-15 on foldout page. Note that the top and left borders have numbers and letters to mark zones for finding the components. For instance, the notation at the top "to +390 V (3C)" indicates a connection to boosted B+ of 390 V at the bottom right in zone 3C. In addition, the pictorial diagram in Fig. 28-14 shows a road map of the components on the printed wiring board PW200. The numbers in circles or balloons for oscilloscope waveshapes 1 to 14 match these points on the schematic diagram.
As an example, waveshape 10 for video detector output of 2 V p-p is taken at circle 10, which is also test point (TP) 3.
In the power supply at the bottom of the diagram, a full-wave bridge rectifier is used for B+ of 145 V. The power transformer T101 provides isolation from the ac line. All the heaters are in series, but they have direct current from the bridge rectifier. The diode CR1 blocks current in the heater line when the filter capacitors discharge. A 5-A fuse is in the primary of T101, and a 2.5 ohm fusible resistor protects the B+ line In the signal circuits, starting at zone 7F, the IF cable from the tuner feeds the first IF amplifier. There are two IF stages driving the video detector CR201. The one video amplifier, using the pentode section of an 11LQ8 tube, supplies 80-V p-p signal for the grid of the picture tube.
This signal is shown in oscilloscope waveform 1.
The contrast control in the plate circuit varies the amount of video signal. The brightness control varies the cathode bias on the picture tube, using the screen-grid voltage from the horizontal output tube in zone 5D. The 4.5-MHz intercarrier sound signal is taken from the video detector output to the sound section at the top of the diagram. The sound circuits include one 4.5-MHz amplifier, a quadrature-grid detector, and the audio output stage for the loudspeaker.
The sync separator is the triode V21I3 in zone 6F. This section uses the transistor D201 as a noise gate in the cathode return of the sync separator.
The keyed AGC stage uses the triode V205A. Horizontal flyback pulses for the plate are coupled in at terminal Z on the board, from C _p in the damper circuit. Video signal input is dc-coupled to the control grid of the AGC triode from the video output stage. AGC bias is supplied directly to the first IF amplifier and through terminal B to the rf tuner.
The vertical deflection circuit in zone 4E uses the 21LR8 triode-pentode for a plate coupled MV circuit. The vertical sawtooth capacitor is with a value of 0.033 µF. The vertical output transformer T103 is actually an autotransformer, with the bottom section connected to the plug for the deflection yoke. The secondary winding supplies feedback for the MV. It also provides vertical blanking pulses to the control grid of the picture tube.
The horizontal deflection oscillator in zone 70 uses the 8F07 twin-triode in a cathode coupled MV circuit. The sync discriminator with diodes SR201 and SR202 forms the horizontal AFC circuit. The sawtooth capacitor is the 180-pF capacitor C„, in series with R26;, for trapezoidal driving voltage to the grid of the horizontal amplifier. The width control is a series of taps for screen-grid voltage on the 22JR6 output tube.
In zone 4D, T102 is the horizontal output transformer. Terminal 3 goes to the plate of the horizontal amplifier, terminal 2 goes to the 17CT3 damper diode, and terminal 1 supplies current to the horizontal scanning coils through the yoke plug. The boosted B+ of 390 V is available at terminal 4, with C107 used as the boost capacitor. The high-voltage winding at the top of T102 supplies ac input to the 1B3/1G3, which produces anode voltage of 20 kV for the picture tube. In addition, the auxiliary winding at terminals 5 and 6 provides horizontal blanking pulses to the CRT screen grid.
28-9 Schematic Diagram of Solid-State Color Receiver
See Fig. 28-16 on foldout pate with oscilloscope waveforms. Starting at the top left in the diagram, the IF cable supplies signal from the VHF tuner. The IF amplifiers are integrated circuits in IC101. The 14 pins are numbered on the inside of the IC symbol, with dc voltages on the outside. Where two voltages are shown, the top value is with signal.
IC101 also includes the AGC circuits. At pin 6, the IF bias is taken out for adjustment by R,„. The rf bias adjustment is at pin 13. Also, the AGC bias from pin 12 is amplified by 0100 to provide enough AGC action for the rf amplifier on strong signals.
A separate sound converter is used, in the path with 0103. This video IF amplifier is not for video signal. It amplifies the IF signal to feed the 4.5-MHz sound detector Y103. In addition, the IF signal from 0103 is coupled to the AFC module for automatic fine tuning.
The 4.5-MHz intercarrier sound signal from Y103 is amplified and detected in the integrated circuit IC301. The quadrature coil is 1_, 31 . 0301 is the audio output stage driving the loudspeaker.
In the video circuits, Y102 is the video detector. The video preamplifier includes the transistors 0104, 0105, and 0106. The video driver stage 0109 supplies Y signal to the RGB drive section for matrixing with the color video signal.
In the video preamplifier circuits, the delay line for Y signal is between Q108 and Q107. The chroma takeoff for 3.58-MHz signal is from the emitter of Q104.
In the chroma section, Q501, Q502, and Q503 make up the 3.58-MHz bandpass amplifier.
The B- Y and R - Y demodulators, with the G - Y adder, are in the integrated circuit IC501.
Then the blue, red, and green amplifiers are used to provide enough color video signal to drive the three control grids of the picture tube.
The Y signal is injected into the emitter of each of these stages. which are 0600, Q604, and 0606.
The three cathodes of the CRT return to ground through the drive controls for red, green, and blue, with the common beam-current limiter stage Q113. Each drive control varies the amount of degeneration for the input signal at the control grid. Q113 limits the beam current by controlling the cathode bias on the CRT. The burst separator is 0504 at the bottom of the diagram. Signal input is from the emitter of the chroma amplifier 0502. The separated burst rings the crystal at 3.579545 MHz. This output is amplified by 0505, 0506, and Q507.
Then the subcarrier cw signal is coupled by T502 to /C501 at pins 6 and 7, for the B - Y and R - Y demodulators.
The automatic chroma control (ACC) uses Q653 and Q652 to control the gain of Q501 in the chroma section. Input signal proportional to burst amplitude is obtained from the crystal X501 in the subcarrier regenerator circuit. The color killer stage is Q650. Input is obtained from Q507 in the subcarrier generator circuit. The output of the color killer stage can cut off the chroma amplifier through Q652 in the ACC section.
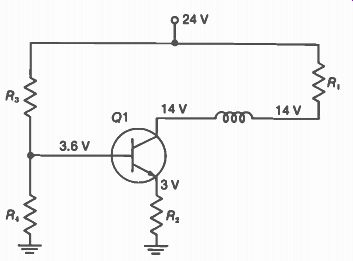
FIGURE 28-17 NORMAL DC VOLTAGES ON NPN SILICON TRANSISTOR FOR CE AMPLIFIER
WITH R IN COLLECTOR CIRCUIT.
In the vertical deflection circuits, the 0.47-µF capacitor C2 „ 8 at the collector of D262 is the sawtooth capacitor. D263 and D264 are driver stages for the pair of vertical output transistors D267 and D268. This output stage is a push-pull circuit using complementary symmetry with NPN and PNP transistors.
In the horizontal deflection circuits, D203 is a sine-wave oscillator. Its frequency is corrected by the reactance-control stage D202.
The sync discriminator for horizontal AFC stage consists of Y201 and Y202. The driver stage Q205 feeds the horizontal output stage D206 at the bottom of the diagram. The diode Y206 is the damper. The timer stage D204 provides the correct pulse width in the waveform for driving the power output transistor.
The high-voltage rectifier is Y210, in the output of the horizontal output transformer T204. The focus voltage is obtained by tapping down on the anode supply for the CRT. The low-voltage power supply is at the bottom left on the diagram. Y400 is a half-wave rectifier for most of the supply voltages. However, the scan-rectified output of 22 V is produced by Y402 from an auxiliary winding at terminal 8 on the horizontal output transformer. A series regulator circuit for this 22-V output keeps the supply voltage constant for the transistors in the signal circuits. Note that in the automatic degaussing circuit R404 is a positive-tempera ture-coefficient resistor (P.T.C.R.). The CRT heater winding of 6.3 V is wired for instant-on operation.
28-10 Transistor Troubles
In most cases, a defective transistor has an open lead internally or a shorted junction. These troubles usually are the result of overheating or excessive voltage, even temporarily. The transistor also can develop excessive leakage, which reduces gain and makes the transistor noisy. Opens and shorts can be checked for with a multimeter.
Ohmmeter tests. Avoid the R x 1 scale be cause it often has too much current for low power junctions. To check a semiconductor diode out of the circuit, just measure the forward and reverse resistances by reversing the ohm meter leads. In the forward direction the resistance should be low, usually about 100 I/ or less.
In the reverse direction, the resistance is much higher. For silicon junctions, the reverse resistance is practically infinite because there is so little leakage current. If the resistance is very low in both directions, the junction must be shorted. If there is infinite resistance in both directions, the diode is open.
For a PNP or NPN transistor, consider it as two diode junctions. One is from base to emitter and the other from base to collector. To check the emitter junction, measure the forward and reverse resistances to the base. Also, measure the forward and reverse resistances from the base to the collector to check this junction.
For an SCR, the resistance from gate to cathode should be checked like a diode junction. However, from the anode to the cathode or gate, the resistance is 10 M-o or more. The reason is that for either polarity of the ohmmeter at the anode, one of the internal junctions is reverse-biased.
With an FET, the gate electrode of the junction type can be tested as a diode with the source. However, with an insulated gate, the resistance to the source or drain is practically in finite in either polarity. For both types of FET, the resistance from drain to source is the R of the channel. This value is usually in kilohms, but check against a good FET of the same type.
Transistor voltage tests. In the circuit, the main question is usually whether the transistor is conducting or not. We assume a class A stage, where the amplifier conducts with or without signal. Consider the CE amplifier in Fig. 28-17 with normal dc operating voltages.
The collector voltage is 14 V because of the 10-V drop across R, from the 24-V supply. This IR drop is produced by collector current. Note that there is no voltage drop across L, because of its low dc resistance.
The emitter voltage is 3 V because of emitter current through R2. The R„R, voltage divider provides the base voltage of 3.6 V. The net forward bias here is 3.6 - 3 = 0.6 V. This forward bias from base to emitter allows collector current to flow.
When the collector circuit has resistance, the current can be checked by measuring the voltage drop. With a VOM, measure directly across the resistance. Then I f = V/R.
Typical values of I c are 1 to 10 mA for small-signal transistors rated at 250 mW or less.
An important test is to measure the for ward bias. With a VOM. measure directly from base to emitter. A typical bias is 0.6 V for silicon transistors. Any voltage above 0.7 V, approximately, indicates the junction is open.
A quick test of whether the transistor is operating can be done by temporarily shorting the base to emitter. Without forward bias, the transistor is cut off. Normal operation is indicated when the temporary short changes the output. However, be careful not to short the collector voltage to the base.
SUMMARY
1. Common troubles in receivers include defective tubes, capacitors, resistors, and semiconductor devices.
2. Resistors generally open rather than short. The open circuit can change the dc voltages. Coils and transformers also can open.
3. Capacitors can be either open or shorted. A shorted capacitor affects the dc voltages, but an open capacitor does not.
4. The main items of test equipment for receiver servicing are a multimeter, oscilloscope, and color-bar generator, with a sweep generator for visual alignment if desired.
5. Typical alignment curves for the television receiver are shown in Fig. 28-10.
6. The dc voltmeter is used to measure electrode voltages on tubes and transistors to localize a defective component. Normal dc voltages are shown on the manufacturer's schematic diagram.
7. The ohmmeter is used to check for an open resistor or shorted capacitor. An open capacitor does not show charging action.
8. Transistors and diodes can be checked out of the circuit with an ohmmeter. Test the PN junction with forward and reverse voltages by reversing the ohmmeter leads. A very low reading with both polarities indicates a short; a very high reading in both directions indicates an open.
9. The oscilloscope is used for ac voltage measurements in the video, color, sync, and deflection circuits. Typical peak-to-peak values are shown by the wave forms for receiver circuits in Figs. 28-15 and 28-16.
10. The three oscilloscope probes are used as follows: (a) Low-capacitance probe (LCP) for most measurements. Multiply the reading by 10 to allow for the voltage division by the LCP. (b) Direct probe for visual alignment curves where the sweep generator signal is demodulated. (c) Demodulator probe for IF, rf, and chroma circuits before demodulation.
Self-Examination (Answers at back of guide)
1. Infinite ohms
2. Zero ohms
3. Low-capacitance probe
4. V,„ of zero
5. Vat; of 0.6 V
6. Zero collector current
7. 2 V p-p video signal
8. -50 V grid-leak bias
9. Hues every 300
10. Horizontal bars on screen 11. One pair of bars on screen 12. No raster and no sound
Open collector circuit
Cutoff bias
Shorted capacitor
Gated rainbow generator
Open resistor
1:10 voltage divider
Open in series heater string
Forward bias
60-Hz hum
Audio signal in video amplifier
Horizontal output tube
Detector output
Match the items in the column at the right with those at the left.
Essay Questions
1. Give the uses for five types of test equipment.
2. Give two comparisons between a VOM and a VTVM.
3. Compare two types of oscilloscopes.
4. How is a vectorscope used?
5. Give the uses of the three probes for an oscilloscope.
6. Describe five ways to use a dot-bar generator.
7. How can you check an open fuse with a voltmeter while power is on?
8. How much is the resistance of a voltmeter on the 3-V range if it has a sensitivity of 20,000 WV? Why is the resistance the same for any reading on this range?
9. What is the internal sweep frequency of the oscilloscope required to see two cycles of the following waveshapes: (a) vertical oscillator output; (b) video signal with vertical sync; (c) horizontal oscillator output; (d) video signal with horizontal sync and color burst?
10. Which oscilloscope probe would you use at the following points: (a) grid of horizontal amplifier; (b) video signal at grid or cathode of picture tube; (c)
video detector output for IF alignment; (d) output of bandpass amplifier for chroma alignment? 11. Compare the methods of taking off the 4.5-MHz intercarrier sound signal for the monochrome receiver in Fig. 28-15 and the color receiver in Fig. 28-16.
12. How is the chroma signal obtained for the 3.58-MHz bandpass amplifier in Fig. 28-16?
13. Refer to the monochrome receiver in Fig. 28-15. (a) List four test points and their uses. (b) Label the two fuses and give their functions. (c) Describe the setup adjustments for height and width. (d) Give the functions for T102 in zone 4D; SR201, SR202, and L207 in zone 7D; T103 in zone 3E; T201A in zone 7G. 14. Refer to the color receiver in Fig. 28-16. (a) List eight sections in the circuit diagram and the function of each. (b) In which circuit is the 4-A fuse? (c)
Describe the circuits for drive and screen-grid adjustments on the red, green, and blue guns in the picture tube. (d) Give the functions for T204 in the horizontal section; T201 in the audio section; X501 in the color section; Y201 and Y202 in the sync section; Y102 in the video section. (e) Give the functions for transistors 0503, 0507, 0600, 0604, 0606, 0504, and Q652.
Problems (Answers to selected problems at back of guide)
1. Refer to the CE amplifier in Fig. 28-18 with R„ in the collector circuit. Calculate: (a) Normal V,.; (b) Normal VBE ; (C) V, with R, open.
2. Refer to the CE amplifier in Fig. 28-19 with the tuned LC circuit as the collector load. (a) How much is the normal V,? (b) Normal VisE ? (c) How much will a volt meter read at the emitter to ground with RE open?
FIGURE 28-18 FOR PROBLEM 1; FIGURE 28-19 FOR PROBLEM 2.