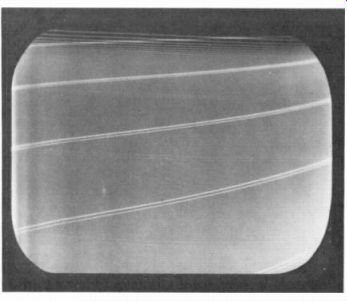
The rectangular area scanned by the electron beam as it is deflected horizontally
and vertically is called the raster. Figure 4-1 shows the scanning raster
on the picture tube screen, without any picture information. With video signal,
the picture tube re produces the picture on the raster. In addition, the deflection
must be synchronized with the picture. To time the horizontal and vertical
scanning correctly, synchronizing pulses are transmitted as part of the signal.
The scanning and synchronizing are explained in the following topics:
4-1 The sawtooth waveform for linear scanning
4-2 Standard scanning pattern
4-3 A sample frame of scanning
4-4 Flicker
4-5 Raster distortions
4-6 The synchronizing pulses
4-7 Scanning, synchronizing, and blanking frequencies
FIGURE 4-1 SCANNING RASTER ON SCREEN OF PICTURE TUBE (RETRACES ARE NORMALLY
BLANKED OUT). THIS RASTER IS NOT INTERLACED BECAUSE THERE IS NO VERTICAL SYNCHRONIZATION.
4-1 The Sawtooth Waveform for Linear Scanning
As an example of linear scanning, consider the sawtooth waveshape in Fig. 4-2 as scanning current for an electromagnetic tube. This current flows through the deflection coils in the yoke on the neck of the picture tube. Let the peak value be 400 mA. If 100 mA is needed to produce a deflection of 5 in., then 400 mA will deflect the beam 20 in. Furthermore, the linear rise on the sawtooth wave provides equal increases of 100 mA for each of the four equal periods of time shown. Each additional 100 mA deflects the beam another 5 in.
Horizontal scanning. This linear rise of current in the horizontal deflection coils deflects the beam across the screen with a continuous, uniform motion for the trace from left to right. At the peak of the rise, the sawtooth wave reverses direction and decreases rapidly to its initial value. This fast reversal produces the retrace or flyback.
The start of horizontal trace is at the left edge of the raster. The finish is at tie right edge, where the flyback produces retrace back to the let edge. See Fig. 4-3a. Note that "up" on the sawtooth wave corresponds to horizontal deflection to the right.
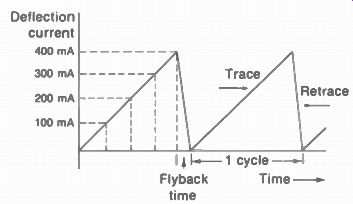
FIGURE 4-2 SAWTOOTH SCANNING WAVEFORM.
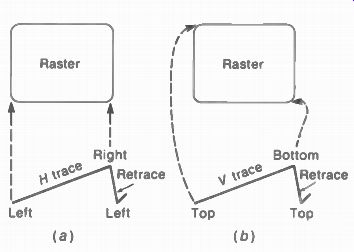
FIGURE 4-3 DIRECTIONS FOR TRACE AND RETRACE (a) HORIZONTAL; (b) VERTICAL.
Vertical scanning. This sawtooth current in the vertical deflection coils moves the electron beam from top to bottom of the raster. While the electron beam is being deflected horizontally, the vertical sawtooth deflection waveshape moves the beam downward with uniform speed.
Then the beam produces complete horizontal lines, one under the other.
The trace part of the sawtooth wave for vertical scanning deflects the beam to the bottom of the raster. Then the rapid vertical retrace returns the beam to the top. See Fig. 4-3b. Note that up on the sawtooth wave for vertical deflection shows increasing current to deflect the beam downward.
Scanning frequencies. Both trace and retrace are included in one cycle of the sawtooth wave.
Since the number of complete horizontal lines scanned in 1 s equals 15,750, for horizontal deflection the frequency of the sawtooth waves is 15,750 Hz. For vertical deflection, the frequency of the sawtooth waves equals the field scanning rate of 60 Hz. The vertical scanning motion at 60 Hz is much slower than the horizontal sweep rate of 15,750 Hz. As a result, many horizontal lines are scanned during one cycle of vertical scanning. We can consider that the vertical deflection makes the horizontal lines fill the raster from top to bottom.
Retrace time. During flyback time, both horizontal and vertical, all picture information is blanked out. Therefore, the retrace part of the sawtooth wave is made as short as possible, since retrace is wasted time in terms of picture information. For horizontal scanning, retrace time is approximately 10 percent of the total line period. With 63.5uis for a complete line, 10 percent equals 6.35 u-s for horizontal flyback time.
Practical limitations in the circuits producing the sawtooth waveform make it difficult to produce a faster flyback.
The lower-frequency vertical sawtooth waves usually have a flyback time less than 5 percent of one complete cycle. A vertical retrace 3 percent of 1 /„ s, as an example, equals 0.0005 s, or 500 p.s. Although vertical retrace is fast compared with vertical trace, note that 500 ps is much longer than a complete horizontal line, which takes 63.5 p.s. Actually, the vertical re trace time of 500 M5 includes approximately eight lines.
4-2 Standard Scanning Pattern
The scanning procedure that has been universally adopted employs horizontal linear scanning in an odd-line interlaced pattern. The FCC scanning specifications for television broad casting in the United States provide a standard scanning pattern that includes a total of 525 horizontal scanning lines in a rectangular frame having a 4.3 aspect ratio. The frames are repeated at a rate of 30 per second with two fields interlaced in each frame.
Interlacing procedure. Interlaced scanning can be compared with reading the interlaced lines written in Fig. 4-4.
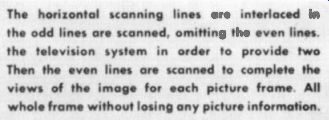
Here the information on the page is continuous if you read all the odd lines from top to bottom and then go back to the top to read all the even lines down to the bottom.
If the whole page were written and read in this interlaced pattern, the same amount of information would be available as though it were written in the usual way with all the lines in progressive order.
For interlaced scanning, therefore, all the odd lines from top to bottom of the frame are scanned first, skipping over the even lines. After this vertical scanning cycle, a rapid vertical re trace moves the electron scanning beam back to the top of the frame. Then all the even lines which were omitted in the previous scanning run are scanned from top to bottom.
Each frame is therefore divided into two fields. The first and all odd fields contain the odd lines in the frame, while the second and all even fields include the even scanning lines.
With two fields per frame and 30 complete frames scanned per second the field repetition rate is 60 per second and the vertical scanning frequency is 60 Hz. In fact, it is the doubling of the vertical scanning frequency from the 30-Hz frame rate to the 60-Hz field rate that makes the beam scan every other line in the frame.
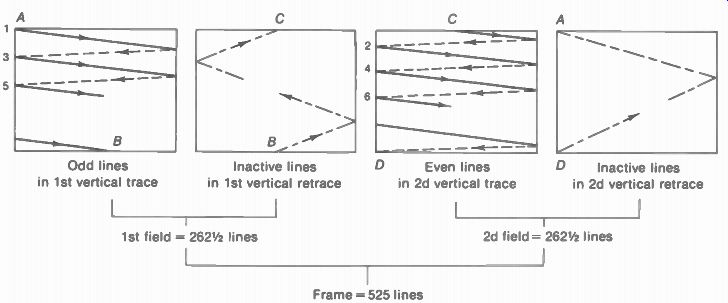
FIGURE 4-5 ODD-LINE INTERLACED SCANNING PROCEDURE.
Odd-line interlacing. The geometry of the standard odd-line interlaced scanning pattern is illustrated in Fig. 4-5. Actually, the electron gun aims the beam at the center, which is where the scanning starts from. For convenience, however, we can follow the motion starting at the upper left corner of the frame at point A. For this line 1, the beam sweeps across the frame with uniform velocity to cover all the picture elements in one horizontal line. At the end of this trace the beam then retraces rapidly to the left side of the frame, as shown by the dashed line in the illustration, to begin the next horizontal line.
Note that the horizontal lines slope down ward in the direction of scanning because the vertical deflecting signal simultaneously produces a vertical scanning motion, which is very slow compared with horizontal scanning. Also note that the slope of the horizontal trace from left to right is greater than during retrace from right to left. The reason is that the faster retrace does not allow the beam so much time to be deflected vertically.
-----------
Then the even lines are scanned to complete the views of the image for each picture frame. A1 whole frame without losing any picture information.
FIGURE 4-4 INTERLACED LINES. READ THE FIRST AND ODD LINES AND THEN THE SECOND
AND EVEN LINES
--------------------------------
After line 1, the beam is at the left side ready to scan line 3, omitting the second line.
This skipping of lines is accomplished by doubling the vertical scanning frequency from the frame repetition rate of 30 to the field frequency of 60 Hz. Deflecting the beam vertically at twice the speed necessary to scan 525 lines produces a complete vertical scanning period for only 2627, lines, with alternate lines left blank. The electron beam scans all the odd lines, then, finally reaching a position such as B in the figure at the bottom of the frame.
At time B the vertical retrace begins because of flyback on the vertical sawtooth deflecting signal. Then the beam is brought back to the top of the frame to begin the second, or even, field. As shown in Fig. 4-5, the beam moves from point B up to C, traversing a whole number of horizontal lines.
This vertical retrace time is long enough for the beam to scan several horizontal lines.
We can call these vertical retrace lines, meaning complete horizontal lines scanned during vertical flyback. Note that the vertical retrace lines slope upward, as the beam is moving up while it scans horizontally. The upward slope of vertical retrace lines is greater than the downward slope of lines scanned during vertical trace because the flyback upward is much faster than the trace downward. Any lines scanned during vertical re trace are not visible, though, because the electron beam is cut off by blanking voltage during vertical flyback time. The vertical retrace lines are inactive because they are blanked out.
Horizontal scanning during the second field begins with the beam at point C in Fig. 4-5.
This point is at the middle of a horizontal line because the first field contains 262 lines plus one-half a line. After scanning a half line from point C. the beam scans line 2 in the second field. Then the beam scans between the odd lines to produce the even lines that were omitted during the scanning of the first field. The vertical scanning motion is exactly the same as in the previous field, giving all the horizontal lines the same slope downward in the direction of scanning. As a result, all the even lines in the second field are scanned down to point D. Points D and B are a half line away from each other because the second field started with a half line.
The vertical retrace in the second field starts at point D in Fig. 4-5. From here, vertical flyback returns the beam to the top. With a whole number of vertical retrace lines, the beam finishes the second vertical retrace at A. The beam will always finish the second vertical re trace where the first trace started because the number of vertical retrace lines is the same in both fields. At point A, then, the scanning beam has just completed two fields or one frame and is ready to start the third field to repeat the scanning pattern.
All odd fields begin at point A and are the same. All even fields begin at point C and are the same. Since the beginning of the even-field scanning at C is on the same horizontal level as A with a separation of one-half line, and since the slope of all the lines is the same, the even lines in the even fields fall exactly between the odd lines in the odd field. The essential requirement for this odd-line interlace is that the starting points at the top of the frame be separated by exactly one-half line between even and odd fields.
4-3 A Sample Frame of Scanning
A complete scanning pattern is shown in Fig. 4-6 with the corresponding horizontal and vertical sawtooth waveforms to illustrate odd-line interlacing. A total of 21 lines in the frame is used for simplicity, instead of 525. The 21 lines are interlaced in two fields per frame. One-half the 21-line total, or 10 1 /2 lines, are in each field. Of the 10 1 /2 lines in a field, we can assume 1 line is scanned during vertical retrace for a convenient vertical flyback time. Then 9 1/2 lines are scanned during vertical trace in each field.
The entire frame has 2 x 972, or 19, lines scanned during vertical trace, plus 2 vertical re trace lines.
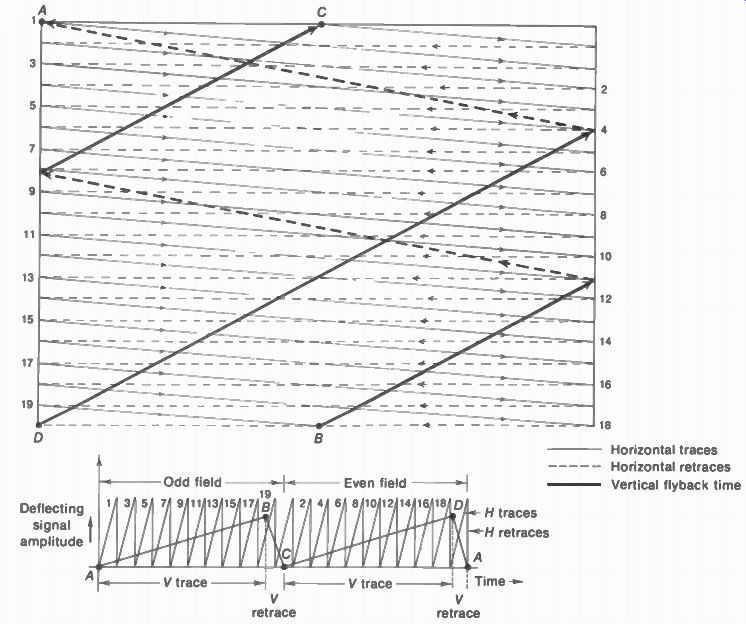
FIGURE 4-6 A SAMPLE SCANNING PATTERN FOR 21 INTERLACED _INES. WITH CORRE
SPONDING SAWTOOTH DEFLECTION WAVEFORMS. BEGINNING AT POINT A. THE SCAN NING
MOTION CONTINUES THROUGH B, C. D, AND BACK TO A AGAIN.
Starting in the upper left corner at A in Fig. 4-6, the beam scans the first line from left to right and retraces to the left for the beginning of the third line in the frame. Then the beam scans the third and succeeding odd lines down to the bottom of the frame. After scanning 9.5 lines, the beam is at point B at the bottom when vertical flyback begins. Notice that this vertical re trace starts in the middle of a horizontal line.
One line is scanned during vertical retrace, consisting of two half lines in this illustration, sloping upward in the direction of scanning. During this vertical retrace the scanning beam is brought up to point C, separated from point A by exactly a half line, to start scanning the second field.
Because of this half-line separation between points A and C, the lines scanned in the even field fall exactly between the odd lines in the previous field. The beam then scans 9 1/2 even lines from point C to D where the vertical retrace begins for the even field. This vertical retrace starts at the beginning of a horizontal line. Vertical retrace time is the same for both fields. Therefore, the one vertical retrace line in the second field returns the beam from D at the bottom to A at the top left corner of the frame where another odd field begins.
It should be noted that the points at which vertical retrace and the downward scan begin need not be exactly as shown in Fig. 4-6. These points could all be shifted by any fraction of a horizontal line without loss of interlace if the half-line difference were maintained.
The half-line spacing between the starting points in alternate fields is automatically produced in the sawtooth deflecting signals and the scanning motion because there is an odd number of lines for an even number of fields.
Proper interlacing is assured, therefore, when the required frequencies of the horizontal and vertical sawtooth scanning signals are maintained precisely and the flyback time on the vertical sawtooth wave is constant for all fields.
4-4 Flicker
Interlaced scanning is used because the flicker effect is negligible with 60 views of the picture presented each second. Although the frame repetition rate is still 30 per second, the picture is blanked out during each vertical retrace 60 times per second. Then the change from black between pictures to the white picture is too rapid to be noticeable. If progressive scanning were used instead of interlacing, with all the lines in the frame simply scanned in progressive order from top to bottom, there would be only 30 blank-outs per second and objectionable flicker would result. Scanning 60 complete frames per second in a progressive pattern would also eliminate flicker in the picture, but the horizontal scanning speed would be doubled, which would double the video frequencies corresponding to the picture elements in a line.
Although the increased blanking rate with interlaced scanning largely eliminates the effect of flicker in the image as a whole, the fact that individual lines are interlaced can cause flicker in small areas of the picture. Any one line in the image is illuminated 30 times per second, reducing the flicker rate of a single line to one-half the flicker rate for the interlaced image as a whole.
The lower flicker rate for individual lines may cause two effects in the picture called interline flicker and line crawl. The interline flicker is sometimes evident as a blinking of thin horizontal objects in the picture, such as the roof line of a house. Line crawl is an apparent movement of the scanning lines upward or downward through the picture, due to the successive illumination of adjacent lines. These effects may be noticed sometimes in bright parts of the picture because the eye perceives flicker more easily at high brightness levels.
4-5 Raster Distortions
Since the picture information is reproduced on the scanning lines, distortions of the raster are in the picture. A rectangular shape for the raster, the correct proportions of width to height, and, finally, uniform deflection are required in order for the edges not to be distorted with respect to the center.
Incorrect aspect ratio. Two cases are illustrated in Fig. 4-7. In a the raster on the picture tube screen is not wide enough for its height, compared with the 4:3 aspect ratio used in the camera tube. Then people in the picture look too tall and thin, with the same geometrical distortion as the raster. This raster needs more width. In b. the raster is not high enough for its width, and people in the picture will look too short. This raster needs more height. For both a and b, these troubles are generally caused by insufficient output from the horizontal and vertical deflection circuits.
Pincushion and barrel distortion. If deflection is not uniform at the edges of the raster, compared with the center, the raster will not have straight edges. For scanning lines bowed inward as in Fig. 4-8a, this effect is pincushion distortion. Barrel distortion is shown in b.
Pincushion distortion is a problem with large-screen picture tubes. Since the faceplate is almost flat, the distance is longer from the point of deflection to the corners of the screen.
The electron beam is deflected more than at the center, resulting in a raster with the corners stretched out. The pincushion distortion can be corrected, however, by a compensating magnetic field. Small permanent magnets for pincushion correction are mounted on the deflection yoke for monochrome picture tubes. With color picture tubes, the deflection current in the yoke is modified by pincushion correction circuits.
Trapezoidal distortion. In Fig. 4-9a, the scanning lines are wider at the top than at the bottom. This raster has the shape of a keystone or a trapezoid. The geometrical form of a trapezoid has straight edges that are not parallel. This effect in the raster is called keystoning, which is a form of trapezoidal distortion. The cause is unsymmetrical deflection, either left to right as in Fig. 4-9a or top to bottom as in b. For picture tubes, the symmetry in scanning is provided by the balanced coils in the deflection yoke.
----------------
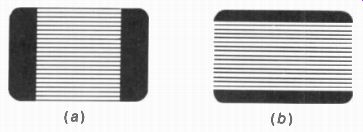
FIGURE 4-7 INCORRECT ASPECT RATIO IN RASTER BLACK SHOWS AREAS OF SCREEN NOT
COVERED BY SCANNING. (a) INSUFFICIENT WIDTH (b) INSUFFICIENT HEIGHT (a) (b)
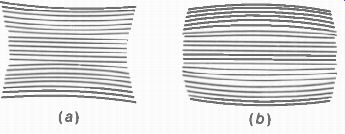
FIGURE 4-8 PIN-CUSHION DISTORTION OF RASTER IN (a) AND BARREL DISTORTION IN
(b). (a) (b)
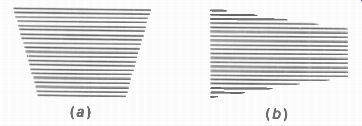
FIGURE 4-9 TRAPEZOIDAL RASTER (a) KEYSTONED SIDES CAUSED BY UNSYMMETRICAL
HORIZONTAL SCANNING. (b) KEYSTONED AT TOP AND BOTTOM BECAUSE OF UNSYMMETRICAL
VERTICAL SCANNING.
-----------------
Nonlinear scanning. The sawtooth waveform with a linear rise for trace time produces linear scanning, as the beam is made to move with constant speed. With nonlinear scanning, however, the motion of the beam is too slow or too fast. If the scanning spot at the receiver moves too slowly, compared with scanning in the cam era tube at the transmitter, picture information will be crowded together. Or, if scanning, is too fast, the reproduced picture information is spread out. Usually the nonlinear scanning causes both effects at opposite ends of the raster. This is illustrated in Fig. 4-10a for a horizontal line with picture elements spread out at the left and crowded at the right. When the same effect occurs for all the horizontal lines in the raster, the entire picture is spread out at the left side and crowded at the right side. With people in the picture, a person at the left appears too wide while someone at the right looks too thin.
The vertical scanning motion must also be uniform; otherwise the horizontal lines will be bunched at the top or bottom of the raster and spread out at the opposite end. This effect is illustrated in Fig. 4-10b for spreading at the top and crowding at the bottom. Then a person in the picture will appear distorted with a long head and short legs. For both a and b, scanning nonlinearity generally is caused by amplitude distortion in the deflection amplifier circuits.
Poor interlacing. In each field the vertical trace from the top must start exactly a half line from the start of the previous field for odd-line interlacing. If the downward motion is slightly displaced from this correct position, the spot starts scanning too close to one of the lines in the previous field, instead of scanning exactly between lines. This incorrect start produces a vertical displacement between odd and even lines that is carried through the entire frame. As a result, pairs of lines are too close, with extra space between pairs. Then you can see too much black between the white scanning lines.
This defect in the interlaced scanning is called line pairing. For the extreme case, lines in each successive field may be scanned exactly on the previous field lines. Then the raster contains only one-half the usual number of horizontal lines.
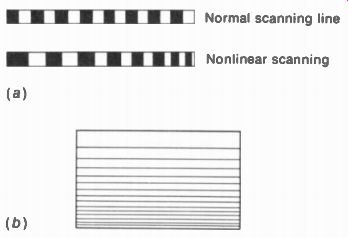
FIGURE 4-10 EFFECTS OF NONLINEAR SCANNING. (a) PICTURE ELEMENTS SPREAD OUT
AT LEFT AND CROWDED AT RIGHT. CAUSED BY NONLINEAR HORIZONTAL SCANNING. (b)
SCANNING LINES SPREAD OUT AT TOP AND CROWDED AT BOTTOM, CAUSED BY NONLINEAR
VERTICAL SCANNING
When the picture has diagonal lines as part of the image, poor interlacing makes them appear to be interwoven in the moire effect shown in Fig. 4-11. This effect, also called fish tailing, is more evident in diagonal picture in formation, when the interlacing varies in successive frames.
Poor interlacing is caused by inaccurate vertical synchronization. Although the period of a field is 1/60 s, which is a relatively long time, vertical scanning in every field must be timed much more accurately for good interlace. If the vertical timing is off by 1/4 u-s in one field compared with the next, the interlaced fields are shifted the distance of one picture element.
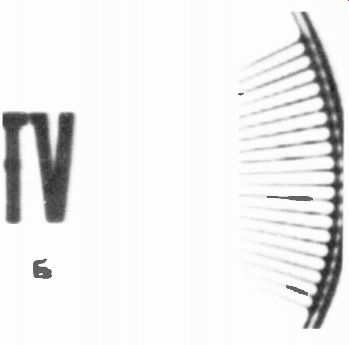
FIGURE 4-11 FAULTY INTERLACING. LINE DIVISIONS IN HORIZONTAL WEDGES ARE INTERWOVEN
IN A MOIRE EFFECT.
4-6 The Synchronizing Pulses
At the receiver the picture tube scanning beam must reassemble picture elements on each horizontal line with the same left-right position as the image at the camera tube. Also, as the beam scans vertically the successive scanning lines on the picture tube screen must present the same picture elements as corresponding lines at the camera tube. Therefore, a horizontal synchronizing pulse is transmitted for each horizontal line to keep the horizontal scanning synchronized, and a vertical synchronizing pulse is transmitted for each field to synchronize the vertical scanning motion. The horizontal synchronizing pulses then have a frequency of 15,750 Hz, and the frequency of the vertical synchronizing pulses is 60 Hz.
The synchronizing pulses are transmitted as part of the picture signal but are sent during the blanking period when no picture information is transmitted. This is possible because the synchronizing pulse begins the retrace, either horizontal or vertical, and therefore occurs during retrace time. The synchronizing signals are combined with the picture signal in such a way that part of the modulated picture signal amplitude is used for the synchronizing pulses and the remainder for the camera signal. The term sync is often used for brevity to indicate the synchronizing pulses.
The form of the synchronizing pulses is illustrated in Fig. 4-12. Note that all pulses have the same amplitude but differ in pulse width or waveform. The synchronizing pulses shown include from left to right three horizontal pulses, a group of six equalizing pulses, a serrated vertical pulse, and six additional equalizing pulses which are followed by three more horizontal pulses. There are many additional horizontal pulses after the last one shown, following each other at the horizontal line frequency until the equalizing pulses occur again for the beginning of the next field. For every field there must be one wide vertical pulse, which is actually composed of six individual pulses separated by the five serrations.
Each vertical synchronizing pulse extends over a period equal to six half lines or three complete horizontal lines, making it much wider than a horizontal pulse. This is done to give the vertical pulses an entirely different form from the horizontal pulses. Then they can be completely separated from each other at the receiver, one furnishing horizontal synchronizing signals alone while the other provides only vertical synchronization.
The five serrations are inserted in the vertical pulse at half-line intervals. The equalizing pulses are also spaced at half-line intervals.
These half-line pulses can serve for horizontal synchronization, alternate pulses being used for even and odd fields. The reason for using equalizing pulses, however, is related to vertical synchronization. Their effect is to provide identical waveshapes in the separated vertical synchronizing signal for even and odd fields so that constant timing can be obtained for good interlace. Since the equalizing pulses are repeated at half-line intervals, their repetition rate is twice 15,750, or 31,500 Hz.
The synchronizing signals do not produce scanning. Sawtooth generator circuits are needed to provide the deflection of the electron beam that produces the scanning raster. however, the sync enables the picture information reproduced on the raster to hold still in the correct position. Without vertical sync, the picture which is reproduced appears to roll up or down the raster; without horizontal sync the picture drifts to the left or right, and then the line structure breaks into diagonal segments. These effects are shown in Fig. 4-13.
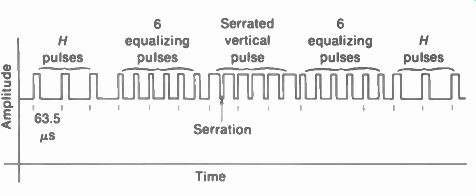
FIGURE 4-12 THE SYNCHRONIZING PULSES
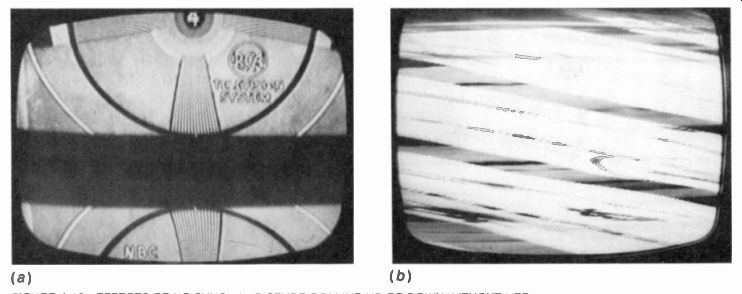
FIGURE 4-13 EFFECTS OF NO SYNC (a) PICTURE ROLLING UP OR DOWN WITHOUT VER
TICAL SYNC. (b) PICTURE TORN INTO DIAGONAL SEGMENTS WITHOUT HORIZONTAL SYNC
4-7 Scanning, Synchronizing, and Blanking Frequencies
The sync and blanking pulses always have the same rate as the scanning frequency. These values are summarized in Table 4-1. For vertical deflection, the sawtooth scanning waveform has the frequency of 60 Hz because this is deter mined by the V sync pulses repeated every 1/60 S. The vertical retrace is blanked out because the flyback is triggered by the V sync pulse during the time of the V blanking pulse. The relation of V sync within V blanking can be seen in Fig. 5-5 in Section 5 on the Composite Video Signal.
Similarly, for horizontal deflection, the sawtooth scanning waveform has the frequency of 15,750 Hz because this is the repetition rate of the H sync pulses. H flyback is blanked out because H retrace is within the time of H blanking.
The groups of equalizing pulses are repeated every 1/60 s but each of the pulses is spaced at half-line intervals with the frequency of 31,500 Hz. The function of the equalizing pulses is to equalize the vertical synchronization in even and odd fields for good interlacing.
However, there is no scanning or blanking at the equalizing-pulse rate of 31,500 Hz.
It may be of interest to note that for color television broadcasting the V field frequency is exactly 59.94 Hz and the H line frequency is 15,734.26 Hz. These values are derived as sub multiples of the exact color subcarrier frequency of 3.579545 MHz. However, these frequencies are so close to 60 and 15,750 Hz that the deflection circuits can easily lock in for synchronized V and H scanning. The main factor is that when the V and H scanning frequencies are shifted slightly for color television, both the sync and blanking pulses are also changed to the new frequencies. A synchronized scanning circuit automatically locks into the sync frequency.
TABLE 4-1 SCANNING. SYNCHRONIZING. AND BLANKING FREQUENCIES*
FREQUENCY, Hz APPLICATION 60 V sync to time V field scanning 60 V scanning to make lines fill raster 60 V blanking to blank out V retraces 15,750 H sync to time H scanning 15,750 H scanning to produce lines 15,750 H blanking to blank out H retraces 31,500
Equalizing pulses
*These are values for monochrome and only nominal values for color television broadcasting, where V is exactly 59.94 Hz and H is exactly 15,734.26 Hz.
SUMMARY
1. The sawtooth waveform for deflection provides linear scanning. The linear rise on the sawtooth is the trace part; the sharp drop in amplitude is for the retrace or flyback. Both trace and retrace are included in one cycle.
2. The frequency of the sawtooth waveform for horizontal deflection is the horizontal line rate of 15,750 Hz.
3. The frequency of the sawtooth waveform for vertical deflection is the field rate of 60 Hz. Vertical flyback time 5 percent or less of 1 /„., s is long enough to include several complete lines. These horizontal lines scanned during vertical retrace are vertical flyback lines.
4. In odd-line interlacing, an odd number of lines (525) is used with an even number of fields (60), so that each field has a whole number of lines plus one-half. Then successive fields start scanning a half line away from the previous field, interlacing odd and even lines in the frame.
5. Interlaced scanning eliminates flicker because of the 60-cycle vertical blanking rate, while maintaining the 30-cycle rate for complete picture frames.
6. Distortions of the scanning raster include keystone, trapezoid, pincushion, and barrel effects.
7. Incorrect aspect ratio can make people in the picture look too tall or too short, because of incorrect height or width of the raster.
8. Nonlinear scanning spreads or crowds picture information at one end of the raster compared with the opposite end. This effect also distorts the shape of people in the picture.
9. The synchronizing pulses time the scanning with respect to the position of picture information on the raster. Horizontal sync pulses time every line at 15,750 Hz; vertical sync pulses time every field at 60 Hz. All the sync pulses have the same amplitude, but a much wider pulse is used for vertical sync. The equalizing pulses and the serrations in the vertical pulse occur at half-line intervals with the frequency of 31,500 Hz.
Self-Examination (Answers at back of guide)
Choose (a), (b), (c), or (d).
1. In the sawtooth waveform for linear scanning the (a) linear rise is for flyback; (b) complete cycle includes trace and retrace; (c) sharp reversal in amplitude produces trace; (d) beam moves faster during trace than retrace.
2. With a vertical retrace time of 635 u-s, the number of complete horizontal lines scanned during vertical flyback is (a) 10; (b) 20; (c) 30; (d) 63.
3. One-half line spacing between the start positions for scanning even and odd fields produces (a) linear scanning; (b) line pairing; (c) fishtailing; (d) exact interlacing.
4. The number of lines scanned per frame in the raster on the picture tube screen is (a) 525; (b) 26272; (c) 20; (d) 10.
5. In the interlaced frame, alternate lines are skipped during vertical scanning because the (a) trace is slower than retrace; (b) vertical scanning frequency is doubled from the 30-Hz frame rate to the 60-Hz field rate; (c) horizontal scanning is slower than vertical scanning; (d) frame has the aspect ratio of 4:3.
6. With 10 percent for horizontal flyback, this time equals (a) 10 As; (b) 56 As; (c) 6.4 us; (d) 83 A. sec.
7. Which of the following is not true? (a) Line pairing indicates poor interlacing. (b) People will look too tall and thin on a square raster on the picture tube screen. (c) A person can appear to have one shoulder wider than the other because of nonlinear horizontal scanning. (d) The keystone effect produces a square raster.
8. The width of a vertical sync pulse with its serrations includes the time of (a) six half lines or three lines; (b) five lines; (c) three half lines; (d) five half lines.
9. Sawtooth generator circuits produce the scanning raster, but the sync pulses are needed for (a) linearity; (b) timing; (c) keystoning; (d) line pairing.
10. Which of the following frequencies is wrong? (a) 15,750 Hz for horizontal sync and scanning; (b) 60 Hz for vertical sync and scanning; (c) 31,500 Hz for equalizing pulses and serrations in the vertical sync pulse; (d) 31,500 Hz for the vertical scanning frequency.
Essay Questions
1. Draw the interlaced scanning pattern for a total of 25 lines per frame, interlaced in two fields. Also show the corresponding sawtooth waveforms for horizontal and vertical scanning, as in Fig. 4-6. Assume one line scanned during each vertical flyback.
2. Define the following terms: (a) scanning raster; (b) pincushion effect; (c) line pairing; (d) interline flicker; (e) moire effect.
3. Why are the lines scanned during vertical trace much closer together than lines scanned during vertical flyback?
4. Suppose the sawtooth waveform for vertical scanning has a trace that rises too fast at the start and flattens at the top. Will the scanning lines be crowded at the top or bottom of the picture tube raster? How will people look in the picture?
5. Draw two cycles of the 15,750-Hz sawtooth waveform, showing retrace equal to 0.08H to exact scale. Label trace, retrace, and time of one cycle in microseconds.
6. Draw two cycles of the 60-Hz sawtooth waveform, showing retrace equal to 0.04V to exact scale. Label trace, retrace, and time of one cycle in microseconds.
7. Where is the electron scanning beam at the time of: (a) start of linear rise in H saw tooth; (b) start of H flyback; (c) start of linear rise n V sawtooth; (d) start of V flyback? Problems (Answers to selected problems at back of guide)
1. How many flyback lines are produced during vertical retrace for each field and each frame for retrace time equal to (a) 0.02V; (b) 0.08V?
2. Compare the time in microseconds for horizontal flyback equal to 0.08H and vertical flyback of 0.04V.
3. (a) How much time elapses between the start of one horizontal sync pulse and the next? (b) Between one vertical pulse in an odd field and the next in an even field?
4. What frequencies correspond to the following periods of time for one cycle: (a) II,„, s; (b) 63.5 /is; (c) 53.3 /2s.
5. Refer to the sawtooth waveforms in Fig. 4-14 below. For the opposite polarities in a and b, indicate trace and retrace on each H sawtooth, also, the corresponding left and right edges in the raster. For the opposite polarities in c and d indicate trace and retrace on each V sawtooth, also, the corresponding top and bottom edges in the raster.
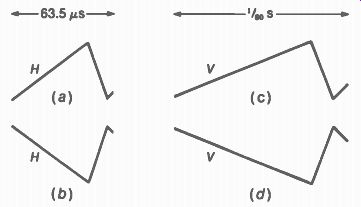
FIGURE 4-14 FOR PROBLEM 5