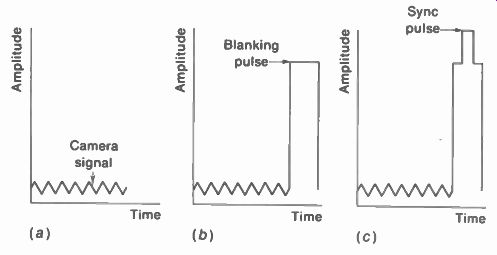
"Composite" means that the video signal includes separate parts.
These parts are (1) camera signal corresponding to the desired picture information,
(2) synchronizing pulses to synchronize the transmitter and receiver scanning,
and (3) blanking pulses to make the retraces invisible. How these three components
are added to produce the composite video signal is illustrated in Fig. 5-1.
The camera signal in a is combined with the blanking pulse in b, and then
the sync pulse to produce the composite video signal in c. The result shown
here is composite video signal for one horizontal scanning line. In addition,
for color the 3.58-MHz chrominance signal and color sync burst are included.
With signal for all the lines, the composite video contains the information
needed to reproduce the complete picture. More details are explained in the
following topics:
5-1 Construction of the composite video signal
5-2 Horizontal blanking time
5-3 Vertical blanking time
5-4 Picture information and video signal amplitudes
5-5 Oscilloscope waveforms of video signal
5-6 Picture information and video signal frequencies
5-7 Maximum number of picture elements
5-8 Test patterns
5-9 Dc component of the video signal
5-10 Gamma and contrast in the picture
5-11 Color information in the video signal
5-12 Vertical interval test signals (VITS)
FIGURE 5-1 THE THREE COMPONENTS OF COMPOSITE VIDEO SIGNAL. (a) CAMERA SIGNAL
FOR ONE HORIZONTAL LINE. (b) HORIZONTAL BLANKING PULSE ADDED TO CAMERA SIGNAL.
(c) SYNC PULSE ADDED TO BLANKING PULSE.
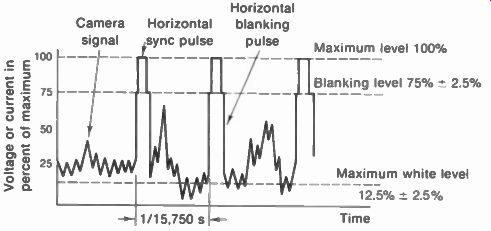
FIGURE 5-2 COMPOSITE VIDEO SIGNAL FOR THREE CONSECUTIVE HORIZONTAL LINES.
5-1 Construction of the Composite Video Signal
In Fig. 5-2, successive values of voltage or current amplitude are shown for the scanning of three horizontal lines in the image. Note that the amplitude of the video signal is divided into two sections. The lower 75 percent is used for cam era signal, with the upper 25 percent for synchronizing pulses. In the camera signal, the lowest amplitudes correspond to the whitest parts of the picture while the darker parts of the picture have higher amplitudes. This is the way the signal is transmitted, using a standard negative polarity of transmission. "Negative transmission" means that white parts of the picture are represented by low amplitudes in the transmitted picture carrier signal. Higher amplitudes correspond to progressively darker picture in formation until the black level is reached.
The composite video signal and scanning.
Referring again to Fig. 5-2, consider the amplitude variations shown as the desired video signal obtained in scanning three horizontal lines at the top of the image. Starting at the extreme left in the figure at zero time, the signal is at a white level and the scanning beam is at the left side of the image. As the first line is scanned from left to right, camera signal variations are obtained with various amplitudes that correspond to the required picture information. After horizontal trace produces the desired camera signal for one line, the scanning beam is at the right side of the image. The blanking pulse is then inserted to bring the video signal amplitude up to black level so that retrace can be blanked out.
After a blanking time long enough to include retrace, the blanking voltage is removed.
The scanning beam is then at the left side ready to scan the next line. Each horizontal line is scanned successively in this way. Notice that the second line shows dark picture information near the black level. The third line has gray values with medium amplitudes of 40 to 50 percent.
With respect to time, the signal amplitudes just after blanking in Fig. 5-2 indicate in formation corresponding to the left side at the start of a scanning line. Just before blanking, the signal variations correspond to the right side.
Information exactly in the center of a scanning line occurs at a time halfway between blanking pulses.
The blanking pulses. The composite video signal contains blanking pulses to make the re trace lines invisible by raising the signal amplitude to black level during the time the scanning circuits produce retraces. All picture information is cut off during blanking time because of the black level. The retraces are normally produced within the time of blanking.
As illustrated in Fig. 5-3, there are horizontal and vertical blanking pulses in the composite video signal. The horizontal blanking pulses are included to blank out the retrace from right to left in each horizontal scanning line.
The repetition rate of horizontal blanking pulses, therefore, is the line-scanning frequency of 15,750 Hz. The vertical blanking pulses have the function of blanking out the scanning lines produced when the electron beam , retraces vertically from bottom to top in each field. Therefore, the frequency of vertical blanking pulses is 60 Hz for every field.
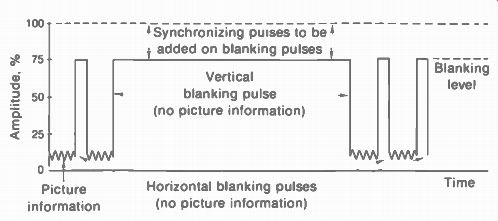
FIGURE 5-3 HORIZONTAL AND VERTICAL BLANKING PULSES IN VIDEO SIGNAL SYNC PULSES
ARE NOT SHOWN
5-2 Horizontal Blanking Time
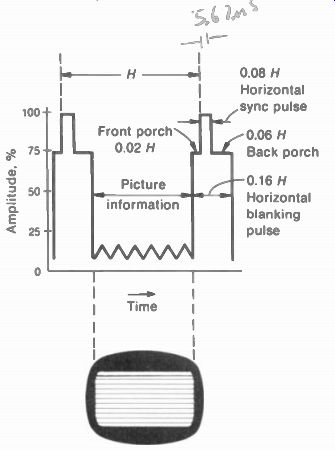
FIGURE 5-4 DETAILS OF HORIZONTAL BLANKING AND SYNC PULSES. H EQUALS 63.5
us.
Details in the horizontal blanking period are illustrated in Fig. 5-4. The interval between horizontal scanning lines is indicated by H. This time for scanning one complete line, including trace and retrace, equals 1 /15,750 s, or 63.5 us.
However, the horizontal blanking pulse has a width only 0.14H to 0.18H. We can consider the average of 16 percent of the line period as a typical value. Then horizontal blanking time is 0.16 x 63.5 us for H, which equals 10 us, approximately. Subtracting from 63.5 us, we have a remainder of 53.5 ps as the time for visible scanning, without blanking, in each line. The 10 us for blanking allows time for retrace.
Superimposed on the blanking pulses are the narrower sync pulses. As noted in Fig. 5-4, each horizontal sync pulse is 0.08H, or one-half the average width for the blanking pulse. This sync time equals 10/ 2 or 5 us. For the remaining half of blanking time, which is also 5 us, the signal is at the blanking level. The part just before the sync pulse is called the front porch, and the back porch follows the sync pulse. The front porch is 0.02H and the back porch 0.06H. Note that the back porch is 3 times longer than the front porch.
These values are summarized in Table 5-1, with the required tolerances. The minimum time of 3.81 us is specified for the back porch in order to provide time for a burst of 3.58-MHz color synchronizing signal. This is shown in Fig. 5-16b.
TABLE 5-1 DETAILS OF HORIZONTAL BLANKING
PERIOD TIME, tts
Total line (H) H blanking H sync pulse Front porch Back porch
Visible line time
63.5 9.5-11.5 4.75 0.5 1.27 (minimum)
3.81 (minimum)
52-54
Blanking time is slightly longer than typical values of retrace time, which depend on the horizontal deflection circuits in the receiver. As a result, a small part of the trace usually is blanked out at the start and end of every scanning line. This effect of horizontal blanking is illustrated by the black bars at the left and right sides of the raster in Fig. 5-4. The black at the right edge corresponds to the front porch of horizontal blanking, before retrace starts. Generally, horizontal retrace starts at the leading edge of the sync pulse. Just before retrace, when the scanning beam is completing its trace to the right, therefore, the blanking level of the front porch makes the right edge black. With a small part of every line blanked this way, a black bar is formed at the right edge. This black bar at the right can be considered as a reproduction of the front-porch part of horizontal blanking.
After the front porch of blanking, horizontal retrace is produced when the sync pulse starts. The flyback is definitely blanked out because the sync level is blacker than black. Although retrace starts with the sync pulse, how much time is needed to complete the flyback depends on the scanning circuits. A typical horizontal flyback time is 7 u.s. Blanking time after the front porch is longer, however, and approximately equal to 9 u.s. Therefore, 2 us of blanking remains after retrace is completed to the left edge. Although the blanking is still on, the saw tooth deflection waveform makes the scanning beam start its trace after flyback. As a result, the first part of trace at the left is blanked. After 2 us of blanked trace time at the left edge, the blanking pulse is removed. Then video signal reproduces picture information as the scanning beam continues its trace for 53.5 u.s of visible trace time. However, the small part of every line blanked at the start of trace forms the black bar at the left edge of the raster. This black edge at the left represents part of every back porch after horizontal sync.
The blanking bars at the sides have no effect on the picture other than decreasing its width slightly, compared with unblanked raster. However, the amplitude of horizontal scanning can be increased to provide the desired width.
5-3 Vertical Blanking Time
The vertical blanking pulses raise the video signal amplitude to black level so that the scanning beam is blanked out during vertical retraces.
The width of the vertical blanking pulse is 0.05V to 0.08V, where V equals 1/60 s. If we take 8 percent for the maximum, vertical blanking time is 0.08 x 1 / 60 s, which equals 1,333 u.s. Note that this time is long enough to include many complete horizontal scanning lines. If we divide 1,333-µs vertical blanking time by the total line period of 63.5 us, the answer is 21. Therefore, 21 lines are blanked out in each field, or 42 lines in the frame. The total number of blanked lines in the frame can also be calculated as 0.08 x 525 = 42. This relatively long time blanks not only vertical retrace lines but also a small part of vertical trace at the bottom and top. The maximum blanking time of 0.08V is generally used to allow time for the vertical interval test signals described in Sec. 5-12.
The sync pulses inserted in the composite video signal during the wide vertical blanking pulse are shown in Fig. 5-5. These include equalizing pulses, vertical sync pulses, and some horizontal sync pulses. The signals are shown for the time intervals between the end of one field and the next, to illustrate what happens during vertical blanking time. The two signals shown one above the other are the same except for the half-line displacement between successive fields necessary for odd-line interlacing.
Starting at the left in Fig. 5-5, the last four horizontal scanning lines at the bottom of the raster are shown with the required horizontal blanking and sync pulses. Immediately following the last visible line, the video signal is brought up to black level by the vertical blanking pulse in preparation for vertical retrace. The vertical blanking period begins with a group of six equalizing pulses, which are spaced at half line intervals. Next is the serrated vertical sync pulse that actually produces vertical flyback in the scanning circuits. The serrations also occur at half-line intervals. Therefore, the complete vertical sync pulse is three lines wide. Following the vertical sync is another group of six equalizing pulses and a train of horizontal pulses During this entire vertical blanking period no picture information is produced, as the signal level is black or blacker than black so that vertical re trace can be blanked out. The details of all the pulses in the vertical blanking interval are summarized in Table 5-2.
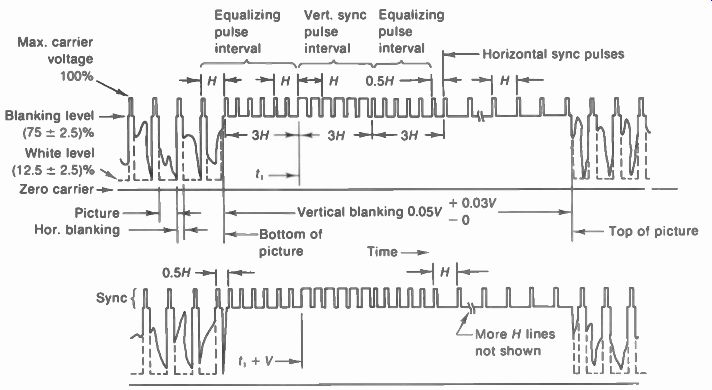
FIGURE 5-5 SYNC AND BLANKING PULSES FOR SUCCESSIVE FIELDS V EQUALS V., s.
Notice the position of the first equalizing pulse at the start of vertical blanking in Fig. 5-5.
In the signal at the top, the first pulse is a full line away from the previous horizontal sync pulse; in the signal below for the next field, the first pulse is one-half line away. This half-line difference in time between even and odd fields continues through all the following pulses, so that the vertical sync pulses for successive fields have the timing required for odd-line interlacing.
The serrated vertical sync pulse forces the vertical deflection circuits to start the flyback.
However, the flyback generally does not begin with the start of vertical sync because the sync pulse must build up charge in a capacitor to trigger the scanning circuits. If we assume vertical flyback starts with the leading edge of the third serration, the time of one line passes during vertical sync before vertical flyback starts. Also, six equalizing pulses equal to three lines occur before vertical sync. Then 3 + 1, or 4, lines are blanked at the bottom of the picture, just before vertical retrace starts.
---------------
TABLE 5-2 DETAILS OF VERTICAL BLANKING
PERIOD TIME
Total field (V) V blanking
Each V sync pulse
Total of 6 V sync pulses
Each E pulse
Each serration
Visible field time = 0.0167 s
0.05-0.08 V. o
0.0008-0.0013 s H/2 -31.75 t 3H = 190.5 p
0.04H = 2.54 /Ls
0.07H - 4.4 ms
0.92-0.95 V. o
0.015-0.016 s
------------------
How long the flyback is depends on the scanning circuits, but a typical vertical retrace time is five lines. As the scanning beam retraces from bottom to top of the raster, then, five complete horizontal lines are produced. This vertical retrace is easily fast enough to be completed within vertical blanking time.
With four lines blanked at the bottom before flyback and five lines during flyback, 12 lines remain of the total 21 during vertical blanking. These 12 blanked lines are at the top of the raster at the start of the vertical trace downward.
In summary, 4 lines are blanked at the bottom and 12 lines at the top in each field. In the total frame of two fields, these numbers are doubled. The scanning lines that are produced during vertical trace, but made black by vertical blanking, form the black bars at top and bottom of the raster in Fig. 5-4. The result is a slight reduction in height of the picture with blanking, compared with the unblanked raster. However, the height is easily corrected by increasing the amplitude of the sawtooth waveform for vertical scanning.
5-4 Picture Information and Video Signal Amplitudes

Fig. 5-6
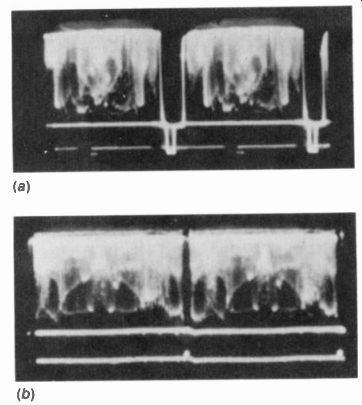
FIGURE 5-7 OSCILLOSCOPE PHOTOGRAPHS OFcom POSITE VIDEO SIGNAL. SHOWN WITH
SYNC POLARITY DOWNWARD. (a) TWO LINES OF HORIZONTAL PICTURE IN FORMATION BETWEEN
HORIZONTAL BLANKING AND SYNC PULSES. OSCILLOSCOPE SWEEP AT 7,875 HZ. (b) TWO
FIELDS OF VERTICAL PICTURE INFORMATION BETWEEN VERTICAL BLANKING AND SYNC
PULSES. OSCILLOSCOPE SWEEP AT 30 HZ.
Two examples are shown in Fig. 5-6 to illustrate how the composite video signal corresponds to visual information. In a, the video signal corresponds to one horizontal line in scanning an image with a black vertical bar down the center of a white frame. In b, the black and white values in the picture are reversed from a.
Starting at the left in Fig. 5-6a, the camera signal obtained in active scanning of the image is initially at the white level corresponding to the white background. The scanning beam continues its forward motion across the white background of the frame, and the signal continues at the same white level until the middle of the picture is reached. When the black bar is scanned, the video signal rises to the black level and remains there while the entire width of the black bar is scanned. Then the signal amplitude drops to white level corresponding to the white background and continues at that level while the forward scanning motion is completed to the right side of the image.
At the end of the visible trace the horizontal blanking pulse raises the video signal amplitude to black level in preparation for horizontal retrace. After retrace, the forward scanning motion begins again to scan the next horizontal line. Each successive horizontal line in the even and odd fields is scanned in this way. As a result, the corresponding composite video signal for the entire picture contains a succession of signals with a waveform identical with that shown in Fig. 5-6a for each active horizontal scanning line. For the image in b the idea is the same, but the camera signal corresponds to a White vertical bar down the center of a black frame.
These are simple types of images, but the correlation can be carried over to an image with any distribution of light and shade. If the pattern contains five vertical black bars against a white background, the composite video signal for each horizontal line will include five rapid variations in amplitude from white to the black level.
As another example, suppose the pattern consists of a horizontal black bar across the center of a white frame. Then most of the horizontal lines will contain white picture information for the entire trace period, with the camera signal amplitude remaining at white level except for the blanking intervals. However, those horizontal lines that scan across the black bar will produce camera signal at black level for the complete active scanning time.
Black setup. In Fig. 5-6, notice that the 75 percent blanking level is offset from black peaks of camera signal. This difference in black amplitudes is called black setup. Standard practice in broadcasting is to use 5 to 10 percent black setup to make sure that black picture information cannot extend into the sync amplitudes.
Typical video signal voltages. An actual picture consists of elements having different amounts of light and shade with a nonuniform distribution in the horizontal lines and through the vertical fields. Especially with motion in the scene, the video signal contains a succession of continuously changing voltages. Within each line there are variations in camera signal amplitude for different picture elements. Further more, the waveforms of camera signal for the lines change within the field. The resulting waveforms are shown by the oscilloscope photos of typical video signal in Fig. 5-7. This signal is at the control grid of the picture tube, with an amplitude of 100 V peak to peak.
5-5 Oscilloscope Waveforms of Video Signal
When you look at oscilloscope patterns, the camera signal variations are usually hazy as they change with motion in the scene. However, the oscilloscope trace locks in for the horizontal blanking and sync pulses at the steady repetition rate of 15,750 Hz or for the vertical pulses at 60 Hz. The internal horizontal sweep frequency of the oscilloscope is preferably set at one-half these frequencies to show video signal either for two lines as in Fig. 5-7a or for two fields as in b.
Then each cycle is shown as wide as possible and with continuity through blanking time.
Line rate. With the oscilloscope sweep at 15,750/2 or 7,875 Hz, you see two lines of video signal (Fig. 5-7a). Any horizontal motion in the scene shows as horizontal motion in the signal variations between the sync pulses.
Field rate. With the oscilloscope sweep at 60/2 or 30 Hz, you see two fields of video signal (Fig. 5-7b). Any vertical motion in the scene shows as motion in the camera signal variations across the trace between the sync pulses. The lines extending across the top and bottom of the vertical sync are caused by the horizontal sync.
You do not see the equalizing pulses in this pattern because the scope is locked at the vertical scanning frequency. In order to see the equalizing pulses and the serrations in the vertical pulses, you must set the scope internal sweep to 31,500 Hz or a sub-multiple. Also, the scope's horizontal sweep usually must be expanded.
Sync polarity. You can observe the oscilloscope patterns of video signal either with positive sync amplitudes upward or with negative sync down as in Fig. 5-7. In terms of the picture tube, negative sync is the correct polarity at the control grid to cut off beam current for black level. At the cathode, positive sync polarity is required, since positive voltage at the cathode corresponds to negative voltage at the control grid. With the blanking voltage driving the picture tube to cutoff for black, then white in the video signal produces maximum beam current for the highlights in the picture. In any case, remember that the white amplitudes are always opposite the sync pulses, away from the blanking level.
IRE amplitude scale. On oscilloscope monitors at the studio, the video signal is checked with negative sync polarity down, to fit the IRE scale shown in Fig. 5-8. The IRE stands for Institute of Radio Engineers, now called the Institute of Electrical and Electronic Engineers (IEEE). Of the 140 IRE units, 40 are for sync amplitudes and 10 for black setup. The 140 units correspond to 1-V peak-to-peak video signal to feed 75-f coaxial cable between amplifier units.
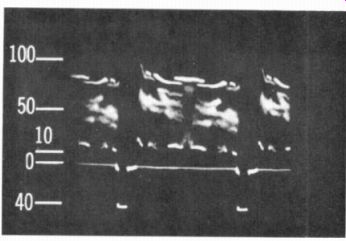
FIGURE 5-8 VIDEO SIGNAL ON STANDARD IRE SCALE OF 140 WITH 10 UNITS FOR BLACK
SETUP
5-6 Picture Information and Video Signal Frequencies
In general, signal variations within any line have high frequencies because the horizontal scanning is fast. In the vertical direction, the signal amplitude variations are much lower in frequency because of the slower speed of vertical scanning. As a result, the video signal for a complete picture has high-frequency variations for the horizontal details and low-frequency variations for the vertical information.
Video frequencies associated with horizontal scanning. Referring to the checkerboard pat tern in Fig. 5-9, the square-wave signal shown at the top represents the camera signal variations of the composite video signal obtained in scanning one horizontal line. It is desired to find the frequency of this square wave. The frequency of the camera signal variations is very important in determining whether or not the television system can transmit and reproduce the corresponding picture information.
In determining the frequency of any signal variation, the time for one complete cycle must be known. A cycle includes the time from one point on the signal waveform to the next succeeding point which has the same magnitude and direction. Frequency can then be found as the reciprocal of the period for a cycle. As an example, the period of one horizontal scanning line is 1/15,750 s and the line-scanning frequency is 15,750 Hz. The camera signal variations within one horizontal line, however, necessarily have a shorter period and a higher frequency.
Note that one complete cycle of camera signal in Fig. 5-9 includes the information in two adjacent picture elements, one white and the other black. Only after scanning the second square does the camera signal have the same magnitude and direction as at the start of the first square. Therefore, to find the frequency of the camera signal variations it is necessary to determine how long it takes to scan across two adjacent squares. This time is the period for one cycle of the resultant camera signal.
Now the period of one complete cycle of the square-wave camera signal variations in Fig. 5-9 can be calculated. The horizontal line period is 1/15,750 s, or 63.5 us, including trace and re trace. With a horizontal blanking time of 10.2 us, the time remaining for visible trace equals 53.3 us. This is the time to scan across all the picture elements in a line. For 12 squares across one line in 53.3 us, the beam scans two squares in 2/12 or 1 /6 of 53.3 u.s. Then 53.3/6, or 8.9 u.s., is the time to scan two squares.
This time of 8.9 uS is the period of one complete cycle of the square-wave signal. The reciprocal equal to 1/8.9 uS is the frequency, therefore, which is 0.11 x 10" Hz, or 0.11 MHz.
This is the frequency of the square-wave camera signal variations in Fig. 5-9.
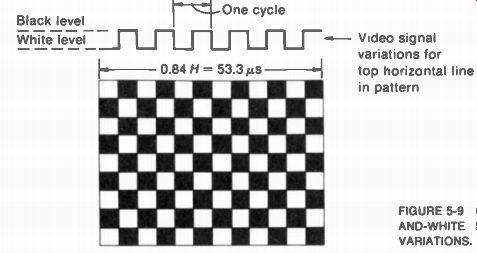
FIGURE 5-9 CHECKERBOARD PATTERN OF 12 BLACK AND-WHITE SQUARES WITH CORRESPONDING
SIGNAL VARIATIONS. Video signal variations for top horizontal line in pattern
When a typical picture is scanned, the scattered areas of light and shade do not produce symmetrical square-wave signal. however, the differences of light and shade correspond to changes of camera signal amplitude in the same way. The frequency of the resultant camera signal variations always depends on the time to scan adjacent areas with different light values. When large objects with a constant white, gray, or black level are scanned, the corresponding camera signal variations have low frequencies because of the comparatively long time between changes in level. Smaller areas of light and shade in the image produce higher video frequencies. The highest signal frequencies correspond to variations between very small picture elements in a horizontal line, especially the vertical edge between a white area and black area.
Video frequencies associated with vertical scanning. At the opposite extreme, signal variations which correspond to picture elements adjacent in the vertical direction have low frequencies because the vertical scanning is comparatively slow. Variations between one line and the next correspond to a frequency of approximately 10 kHz. Slower changes over larger distances in vertical scanning produce lower frequencies. The very low frequency of 30 Hz corresponds to a variation in light level between two successive fields.
Video frequencies and picture information.
Figure 5-10 shows how the size of the picture information can be considered in terms of video frequencies. The main body of the image in a is shown separately in b with only the large areas of white and black. These video frequencies extend up to 100 kHz. However, the detail with sharp edges and outlines is filled in by the high video frequencies from 0.1 to 4 MHz shown in c.
Notice that the canopy of the building is reproduced in b, but its stripes and the small lettering need the high-frequency reproduction in c.
5-7 Maximum Number of Picture Elements
If we consider a checkerboard pattern such as Fig. 5-9 with many more squares, the maximum possible number of picture elements can be calculated where each square is one element.
The total elements in the area equal the maximum details in a line horizontally, multiplied by the details in a vertical row. However, horizontal detail and vertical detail must be considered separately in a television picture because of the scanning process. For horizontal detail, the problem is to determine how many elements correspond to the high-frequency limit of 4-MHz video signal. The vertical detail is a question of how many elements can be resolved by the scanning lines.
Maximum horizontal detail. Proceeding in the same manner as in the previous section, the number of elements corresponding to 4 MHz can be determined to show the maximum number of picture elements in a horizontal line and the size of the smallest possible horizontal detail. The period of one complete cycle for a 4-MHz signal variation is 1/(4 x 10^6) s, or 0.25 u-S. This is the time required to scan two adjacent picture elements. With two elements scanned in 0.25 or 1/4 us, then eight elements are scanned in 1 u-s. Finally, 8 x 53.3, or 426, picture elements can be scanned during the entire active line period of 53.3 u-S. If there were 426 squares in the horizontal direction in the checkerboard pattern in Fig. 5-9, therefore, the resultant camera signal variations would produce a 4-MHz signal.
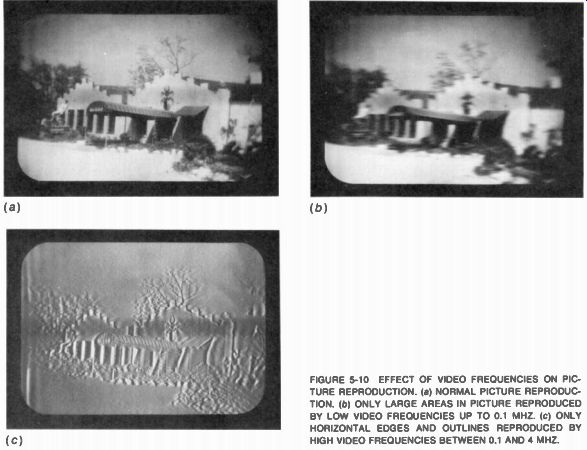
FIGURE 5-10 EFFECT OF VIDEO FREQUENCIES ON PICTURE REPRODUCTION. (a) NORMAL
PICTURE REPRODUCtion . (b) ONLY LARGE AREAS IN PICTURE REPRODUCED BY LOW VIDEO
FREQUENCIES UP TO 0.1 MHZ. (c) ONLY HORIZONTAL EDGES AND OUTLINES REPRODUCED
BY HIGH VIDEO FREQUENCIES BETWEEN 0.1 AND 4 MHZ.
Utilization ratio and vertical detail. Each scanning line can represent at best only one detail in the vertical direction. However, a scanning line may represent no vertical detail at all, by missing a vertical detail completely. Also, two lines may straddle one picture element. The problem in establishing the useful vertical detail, then, is determining how many picture elements can be reproduced along a vertical line by a given number of scanning lines. The ratio of the number of scanning lines useful in representing the vertical detail to the total number of visible scanning lines is called the utilization ratio. Theoretical calculations and experimental tests show that the utilization ratio ranges from 0.6 to 0.8 for different images with typical picture content. We can use 0.7 as an average.
Now the maximum possible number of vertical elements can be determined. The number of visible lines equals 525 minus those scanned during vertical blanking. With a vertical blanking time of 8 percent, the number of lines blanked out for the entire frame is 0.06 x 525, or approximately 42 lines. Some of these lines occur during vertical retrace, and others are scanned at the top or bottom of the frame, but all are blanked out. When we subtract 42 from 525, then 483 visible lines remain. The number of lines useful in showing vertical detail is 483 x 0.7, since this is the utilization ratio. Then there are 338 effective lines. Therefore, the maximum number of vertical details that can be reproduced with 525 total and 483 visible scanning lines is about 338, the exact value depending upon the utilization ratio.
Total number of picture elements. On the basis of the previous calculations, the maximum number of picture elements possible for the en tire image is 426 x 338, or about 144,000. This number is independent of picture size.
Since the total number of picture elements can be regarded as the figure of merit, it may be compared with motion-picture reproduction. A single frame of 35-mm motion-picture film has about 500,000 picture elements.
The smaller 16-mm frame contains one-fourth as many, or about 125,000. The televised reproduction, therefore, can have about the same amount of detail as 16-mm motion pictures.
5-8 Test Patterns
In order to adjust a television system and compare performances, a standard picture is desirable. This picture is usually in the form of a test pattern. For the EIA pattern in Fig. 5-11, the horizontal and vertical bars form a large square within the white circle. Each bar is numbered from 1 to 10 as a gray scale with ten logarithmic steps between black and maximum white. The contrast range is approximately 30 to 1. With the correct aspect ratio, these four bars form a perfect square. The wedges at the center should be of equal length for good linearity of the horizontal and vertical scanning. The bottom wedge is also marked in the corresponding video frequency response for horizontal resolution.
For instance, 300-line resolution in the horizontal direction corresponds to a little under 4-MHz video. In addition to the wedges, vertical and horizontal groups of parallel lines are placed around the edges of the picture to check scanning linearity. The lines should be equally spaced. The black bars at the top and bottom of the white circle are used to check streaking, which indicates phase distortion for low video frequencies.
Resolution. The picture detail or resolution is measured on the test pattern in number of lines.
If the vertical resolution is 300 lines in the reproduced picture, this means that it is possible to see 300 individual horizontal lines consisting of 150 black lines separated by 150 white lines.
For equal resolution in the horizontal direction and an aspect ratio of 4:3, 300 x 1/3, or 400, vertical lines can be resolved in the picture. These include 200 black lines separated by 200 white lines. However, this is still considered 300-line resolution because the resolution is measured in terms of the picture height when indicating either horizontal or vertical detail. The purpose is to provide a common basis for comparison.
The line divisions in the side wedges measure vertical resolution. They also indicate good interlacing when there is little moire effect in the diagonal lines. The line divisions in the top and bottom wedges measure horizontal resolution.
More specific test signals are illustrated in Fig. 5-12. The window signal in a provides maximum white and black in large areas with a sharp transition to check edge distortion, streaking, and smearing. In b the uniformly spaced black and-white bars can be used to check scanning linearity. The bars may be vertical, or horizontal, or both may be used in a crosshatch pattern.
The staircase signal in c illustrates uniform changes in signal amplitude from white, progressing through gray values in equal steps to black. This is called a gray scale.
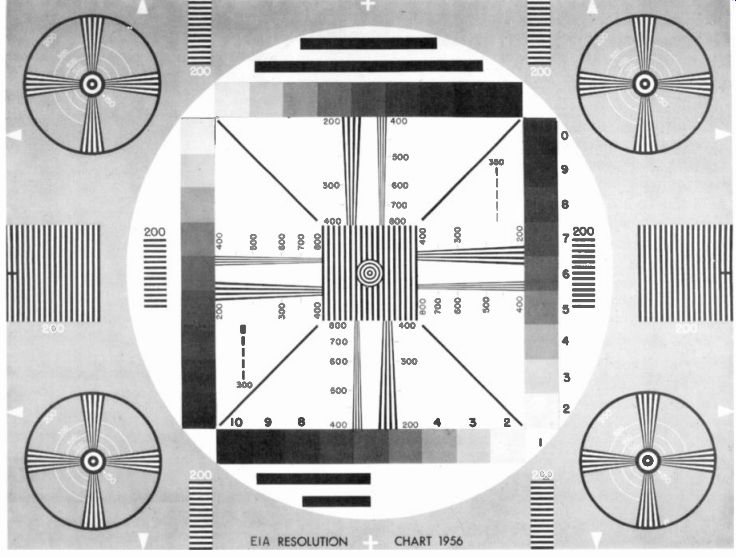
FIGURE 5-11
EIA TEST PATTERN. (ELECTRONIC INDUSTRIES ASSOCIATION)
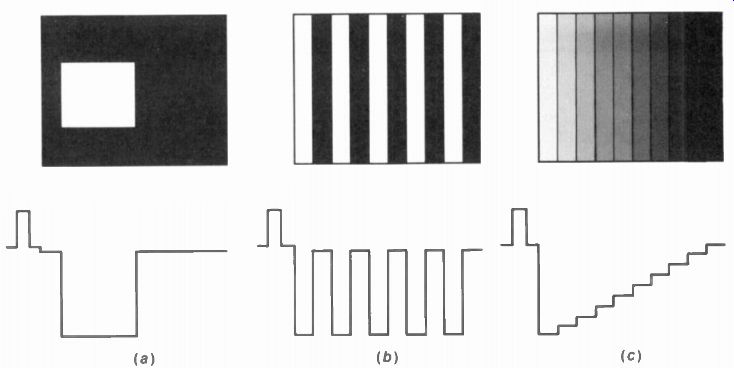
FIGURE 5-12
PATTERNS FOR TEST PURPOSES. WITH CORRESPONDING VIDEO SIGNAL FOR ONE HORIZONTAL LINE. (a) WINDOW SIGNAL. (b) BAR PATTERN. (c) STAIRCASE SIGNAL.
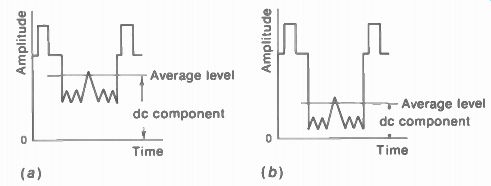
FIGURE 5-13
VIDEO SIGNALS WITH SAME AC VARIATIONS BUT DIFFERENT AVERAGE-BRIGHTNESS VAL UES. ONLY ONE LINE OF FRAME ILLUSTRATED. (a) DARK SCENE WITH AVERAGE VALUE CLOSE TO BLACK LEVEL. (b) LIGHT SCENE WITH AVERAGE VALUE FARTHER FROM BLACK LEVEL.
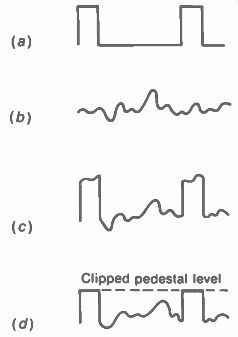
FIGURE 5-14
FORMATION OF PEDESTALS BY CLIPPING TOP OF BLANKING PULSES. (a) BLANKING PULSES ALONE. (b) CAMERA SIGNAL WITHOUT BLANKING. (c) BLANKING PULSES ADDED TO CAMERA SIGNAL. (d) PULSES CLIPPED TO PROVIDE PEDESTAL LEVEL FOR SYNC PULSES.
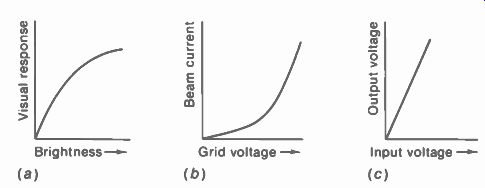
FIGURE 5-15 GAMMA CHARACTERISTICS. (a) VISUAL RESPONSE OF THE EYE, GAMMA
LESS THAN 1. (b) CONTROL-GRID CHARACTERISTIC OF PICTURE TUBE, GAMMA EQUALS
2.5. (c) LINEAR CHARACTERISTIC OF AN AMPLIFIER, GAMMA EQUALS 1
5-9 DC Component of the Video Signal
In addition to continuous amplitude variations for individual picture elements, the video signal must have an average value corresponding to the average brightness in the scene. Otherwise the receiver cannot follow changes in brightness. As an example of the importance of brightness level, the ac camera signal for a gray picture element on a black background will be the same as signal for white on a gray back ground, if there is no average-brightness information to indicate the change in background.
The average level of a signal is the arithmetic mean of all the instantaneous values measured from the zero axis. In Fig. 5-13a the average level is higher than in b because the camera signal variations have higher amplitudes. Now it is important to remember that for any signal variation, its average value for a complete cycle is its dc component. Therefore, the dc component in a is closer to the black level than in b. Although illustrated here for one scanning line, for convenience, the required dc component of the video signal is its average value for complete frames, since the back ground information of the frame indicates the brightness of the scene.
When the average value or dc component of the video signal is close to the black level, as in Fig. 5-13a, the average brightness is dark.
The same ac signal variations in b have a lighter background because the dc axis is farther from the black level.
The method of using the black level for reference voltage can be followed by starting with the camera signal. The camera output voltage is amplified in several stages before being coupled to a control amplifier, where sync and blanking are added. At this point the camera signal has no dc component, since the dc level is blocked by capacitive coupling in either the camera tube or the amplifier stages.
To produce composite video signal, the sync pulses are superimposed on the blanking pulses. Before sync is added, though, the tops of blanking pulses are cut off by a clipper stage in the control amplifier (see Fig. 5-14). The level at which the pulses are clipped becomes the blanking level. Note that clipping lower on the blanking pulses makes the brightness darker. For the opposite case, a higher clipping level means the signal will have a lighter background.
5-10 Gamma and Contrast in the Picture
Gamma is a numerical factor used in television and film reproduction for indicating how light values are expanded or compressed. Referring to Fig. 5-15, the exponent of the equations for the curves shown is called gamma (y). The numerical value of gamma is equal to the slope of the straight-line part of the curve where it rises most sharply. A curve with a gamma of less than 1 is bowed downward as in a, with the greatest slope at the start and the relatively flat part at the end. When the gamma is more than 1, the curve is bowed upward as in b, making the start comparatively flat while the sharp slope is at the end. With a gamma of 1 the result is a straight line as in c, where the slope is constant.
A gamma value of 1 means a linear characteristic that does not exaggerate any light values. When gamma is greater than 1 for the white parts of the image, the reproduced picture looks "contrasty" because the increases in white level are expanded by the sharp slope, to emphasize the white parts of the picture. Commercial motion pictures shown in a darkened theater have this high-contrast appearance. Gamma values of less than 1 for the white parts of the image compress the changes in white levels to make the picture appear softer, with the gradations in gray level more evident.
Any component in the television system can be assigned a value of gamma to describe the shape of its response curve and contrast characteristics. As a typical example, picture tubes have the control-characteristic curve illustrated in b of Fig. 5-15. The video signal voltage is always impressed on the control grid of the picture tube with the polarity required to make the signal variations for the white parts of the picture fall on that part of the response curve with the steep slope. As a result, a variation in video signal amplitude at the white level produces a greater change in beam current and screen brightness than it would at a darker level.
Therefore, picture tubes emphasize the white parts of the picture, with typical gamma values of 2.5 to 3.5. Commercial film also has a gamma greater than 1, an average value being 1.5. In general, monochrome pictures are reproduced with high gamma to make up for the loss of color contrasts.
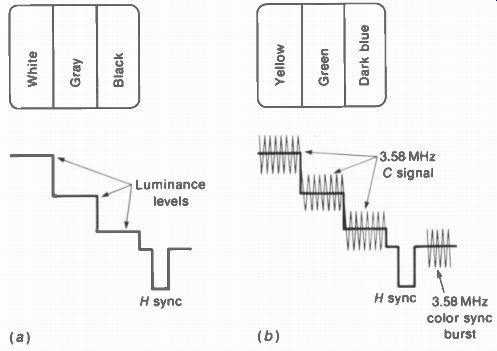
FIGURE 5-16 VIDEO SIGNAL WITH AND WITHOUT COLOR INFORMATION (a) MONOCHROME
SIGNAL ALONE. (b) COMBINED WITH 3.58-MHZ CHROMI NANCE SIGNAL.
Amplifiers have a gamma characteristic that is very nearly unity, using linear operation (see Fig. 5-15c). The straight-line response shows that output signal voltage is proportional to input voltage without emphasizing any signal level. If desired, however, an amplifier can be made to operate over the curved portion of its transfer-characteristic curve by shifting the operating bias. The nonlinear amplifier can be used as a gamma-control stage, to compensate for the camera tube and picture tube.
5-11 Color Information in the Video Signal
For color television, the composite video includes the 3.58-MHz chrominance signal. As a comparison, Fig. 5-16 shows video signal with and without color. The polarity is shown with sync and black down while white is upward. The relative amplitudes in a drop from white for the first bar at the left, to gray level, and then close to black level. These levels correspond to the relative brightness or luminance values for the monochrome information. In b, the video signal has the 3.58-MHz chrominance signal added for the color information in the yellow, green, and blue bars. The specific colors in the C signal are not evident because the relative phase angles and amplitudes are not shown. The main point here is that the difference between monochrome and color television is the 3.58-MHz chrominance signal for color. More details of the 3.58-MHz C signal are explained in Section 8 on Color Television.
It is important to note that the luminance levels in Fig. 5-16a are shown the same as the average levels for the signal variations in b. This factor means that without the C signal the color bars in b would be reproduced in monochrome as the white and gray bars in a.
Note also that the color signal in Fig. 5-16b has on the back porch of horizontal sync a color sync burst. This burst consists of 8 to 11 cycles of the 3.58-MHz color subcarrier. Its purpose is to synchronize the 3.58-MHz color oscillator in the receiver. The burst and C signal are both 3.58 MHz, but the burst has no picture information, as it is present only during blanking time.
5-12 Vertical Interval Test Signals (VITS)
The vertical blanking interval represents a valuable period of time, of relatively long duration, that can be used for test signals. The purpose of the test signals is to provide reference values of color and luminance for broadcast stations, or different programs from the same station. In addition, video test frequencies are transmitted to check bandwidth. The test signals include:
1. Multiburst at the frequencies of 0.5, 1.25, 2.0, 3.0, 3.58, and 4.2 MHz (see Fig. 5-17).
2. Vertical interval reference signal (VIRS) for checking chrominance and luminance (Fig. 5-18). The phase of the test chrominance signal is the same as burst phase.
The multiburst test signal of Fig. 5-17 is inserted on line 18 of odd fields. Line 18 of even fields has a color-bar test signal. The VIR signal of Fig. 5-18 is inserted on line 20 of every field.
Line 1 in odd fields is counted from the first to the third equalizing pulse. Remember these pulses occur at one-half the horizontal line rate.
In even fields, line 1 starts from the second equalizing pulse.
FIGURE 5-17 MULTIBURST TEST SIGNAL TRANSMITTED DURING LINE 18 OF VERTICAL BLANKING IN ODD FIELDS. (TEKTRONIX INC.)
FIGURE 5-18 VERTICAL INTERVAL REFERENCE (VIR) SIGNAL TRANSMITTED DURING LINE 20 OF VERTICAL BLANKing IN BOTH FIELDS. (TEKTRONIX INC)
FIGURE 5-19 VERTICAL INTERVAL TEST SIGNALS AND HAMMERHEAD PATTERN IN VER TICAL BLANKING BAR. YOU CAN ROLL PICTURE OUT OF V SYNC TO SEE THIS.
FIGURE 5-20 CHANNEL NUMBER 16, WITH EXACT TIME, REPRODUCED ON SCREEN OF PICTURE TUBE FROM ENCODED INFORMATION IN LINE 21 OF THE VERTICAL BLANKING INTERVAL. (HEATH COMPANY)
On the screen of the picture tube, the vertical sync and VITS appear as in Fig. 5-19. You can see this vertical blanking bar by rolling the picture out of synchronization with the hold control and turning up the brightness. The black hammerhead pattern is formed by the equalizing pulses just before and after vertical sync.
Time and channel-number encoding. A system has been proposed to use line 21 of the vertical blanking interval for encoding additional information. The code would include the exact time from the National Bureau of Standards, a precise 1-MHz reference signal, 64 characters of text, and a signal identifying the channel number. The text is intended for deaf viewers, emergency codes, and network communications. The channel identification can be used to reproduce the channel number for a short time on the screen of the picture tube, as shown in Fig. 5-20.
SUMMARY
1. The composite video signal includes camera signal with picture information, synchronizing pulses to time scanning, and blanking pulses.
2. The signal is transmitted with 25 percent amplitude for sync, and the remaining 75 percent for camera signal. Specifically, the peak amplitude is tip of sync; 75 percent level is blanking level; maximum white is 12.5 -± 2.5 percent amplitude.
Black setup is usually 7 percent from the blanking level.
3. Horizontal blanking pulses at 15,750 Hz blank out retrace for every line by raising the signal to the 75 percent blanking level. Average pulse width for horizontal blanking is 0.16H, or 10 us. The width for the horizontal sync pulses is approximately 5 us.
4. Vertical blanking pulses at 60 Hz blank vertical retrace for every field by raising the signal to the 75 percent blanking level. Much longer than horizontal blanking time, a typical value is 0.08V for vertical blanking. This equals the time for 21 lines blanked in every field.
5. The camera signal variations in the video signal correspond to the picture information in the image. Amplitude changes between the 12.5 and 68 percent levels indicate variations in light level between white and black, with 7 percent black setup.
6. The high video frequencies in the camera signal correspond to horizontal detail.
Approximately 4.2 MHz is the highest video frequency that can be broadcast in the 6-MHz transmission channel.
7. The average utilization ratio of 0.7 means 70 percent of the visible scanning lines are useful in showing details in the vertical direction.
8. A test pattern usually includes black, white, and gray lines and areas to check picture reproduction. Vertical wedges indicate horizontal resolution as the beam scans across individual line divisions. The ability to resolve divisions in the side wedges indicates vertical resolution. The side wedges also show poor interlacing by moire effect in the diagonal lines. In addition, equal lengths for the horizontal wedges show linear horizontal scanning equal lengths for the vertical wedges show linear vertical scanning.
9. The dc component of any signal is its average-value axis.
10. Gamma is a numerical factor indicating how contrast is expanded or compressed. Picture tubes have a characteristic curve with gamma more than 1, which emphasizes white signal voltages.
11. For color television, the composite video includes the 3.58-MHz chrominance signal, as shown in Fig. 5-16.
12. VITS indicates the vertical interval test signals transmitted during vertical blanking time. VIRS indicates the vertical interval reference signal. (See Figs. 5-17 and 5-18.)
Self-Examination (Answers at back of guide)
Answer true or false.
1. The three components of composite video signal are camera signal, blanking pulses, and sync pulses.
2. Sync pulses transmitted during vertical blanking time include equalizing pulses, the serrated vertical sync pulse, and horizontal sync pulses.
3. During the front-porch time before a horizontal sync pulse the scanning beam is at the left edge of the raster.
4. The 10 percent amplitude in composite video signal corresponds to maximum white picture information.
5. The video signal is at the 75 percent black level di ring horizontal blanking but not during vertical blanking.
6. The visible trace time for one horizontal line is approximately 10
7. When the vertical blanking pulse starts, the scanning beam position is at the top of the raster.
8. The equalizing pulses and serrations in the vertical sync pulse are spaced at half line intervals.
9. The horizontal blanking pulses can produce vertical black bars at the sides of the raster.
10. The vertical sync pulse for one field starts a half line away from its timing in the previous field.
11. Camera signal variations between successive horizontal blanking pulses correspond to information from left to right in the picture.
12. The picture has the left half white and the right half black. The corresponding signal frequency in scanning across one line is approximately 19 kHz.
13. The picture has the top half white and the bottom half black. The corresponding signal frequency in scanning vertically through one frame then must be slightly more than 200 Hz.
14. The high video frequencies correspond to horizontal detail in the picture.
15. Ability to resolve individual lines in the top and bottom wedges of the test pattern indicates horizontal resolution.
16. Ability to resolve individual lines in the side wedges of the test pattern indicates vertical resolution.
17. Picture tubes have a gamma value greater than 1, emphasizing white to increase contrast in the reproduced picture.
18. Average brightness of the reproduced picture depends on the dc bias of the picture tube.
19. The chrominance signal and sync burst shown in Fig. 5-16b have the same frequency of 3.58 MHz.
20. The VIR test signal in Fig. 5-18 is transmitted during horizontal blanking time.
Essay Questions
1. Show the picture and draw the composite video signal of two consecutive lines in scanning across the following patterns: (a) all-white frame; (b) two vertical white bars and two black bars equally spaced; (c) 10 pairs of vertical bars. Why does this signal have a higher frequency than in b?
2. Why are the synchronizing pulses inserted during blanking time?
3. What is the function of the horizontal blanking pulses? The vertical blanking pulses?
4. Why are the horizontal blanking pulses wider than the horizontal sync pulses?
5. Trace the motion of the scanning beam from the beginning to end of vertical blanking.
6. Define: white level, black setup, gamma, utilization ratio, resolution, crosshatch pat tern, and staircase signal.
7. Why do thin vertical lines produce higher video signal frequencies than wide vertical bars? Problems (Answers to selected problems at back of guide)
1. In the checkerboard pattern of Fig. 5-9, if there are 300 squares in a line, what is the frequency of the corresponding signal variations? Use 53.3 its for visible trace time.
2. With a utilization ratio of 0.7, what would be the max mum vertical detail for a vertical blanking time of 0.08V?
3. Assume a facsimile reproduction with specifications of 200 lines per frame, progressive scanning, and 5 frames per second. Calculate the following: (a) time to scan one line, including trace and retrace; (b) visible trace time for one line with 4 percent blanking; (c) video frequency corresponding to 100 total black-and white elements in a line.
4. Calculate the frequency of video signal produced in horizontal scanning of the window signal in Fig. 5-12. Assume 53.3 uS visible trace time.
5. Referring to the Table of Television Standards for foreign countries in Appendix C, calculate the time to scan one line, including trace and retrace for the systems in: (a) United States; (b) England; (c) Western Europe; (d) France.
6. Show the pictures corresponding to the video signals in Fig. 5-21. Assume that all the lines of video signal are the same as the one shown.
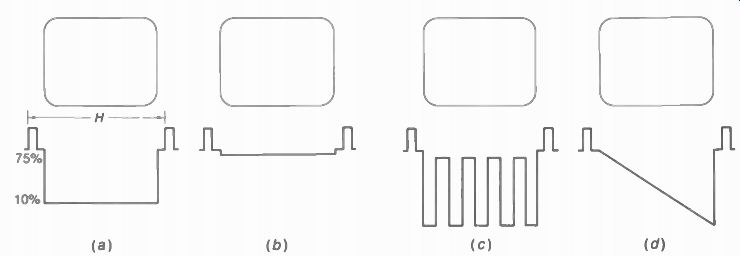
FIGURE 5-21 FOR PROBLEM 6.