A color picture is actually a monochrome picture on a white raster but with colors added for the main parts of the scene. The required color information is in the 3.58-MHz chrominance (C) signal broadcast with the monochrome signal in the standard 6-MHz television broadcast channel. To illustrate this idea of the color in a separate signal, you can turn down the color control at the receiver to eliminate the color signal, and the result is a black-and-white picture. With the C signal, however, the picture is reproduced in natural colors. Practically all colors can be produced as combinations of red, green, and blue. A typical picture reproduced on the screen of a tricolor picture tube is shown in color plate I. More details are explained in the following topics:
8-1 Red, green, and blue video signals
8-2 Color addition
8-3 Definitions of color television terms
8-4 Encoding the 3.58-MHz C signal at the transmitter
8-5 Decoding the 3.58-MHz C signal at the receiver
8-6 The Y signal for luminance
8-7 Types of color video signals
8-8 The color sync burst
8-9 Hue phase angles
8-10 The colorplexed composite video signal
8-11 De-saturated colors with white
8-12 Color resolution and bandwidth
8-13 Color subcarrier frequency
8-14 Color television systems
8-15 Red, Green, and Blue Video Signals
The color television system begins and ends with red, green, and blue color video signals corresponding to the color information in the scene. It is interesting to consider that, in television, voltages correspond to colors. At the transmitter, light of different colors is converted to different video signal voltages. The picture tube in the receiver converts the color video voltages to their respective colors.
A color camera has different camera tubes for red, green, and blue. The screen of the color picture tube has red, green, and blue phosphors to reproduce these colors from the corresponding video signals. Furthermore, video signal voltages can be combined to provide the same effect as mixing colors. As a result, red, green, and blue with all their color combinations, including white, are shown on the screen of the color picture tube.
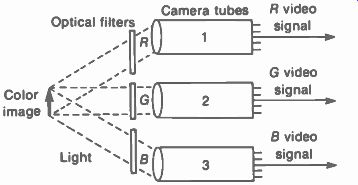
Color voltages. When the image is scanned in the color camera, separate camera tubes are used for each color, as illustrated in Fig. 8-1.
The red, green, and blue in the scene are separated for the camera tubes by optical color filters. As a result, the output from camera tube 1 is red (R) video signal with information for only the red parts of the scene. Similarly, tubes 2 and 3 produce green (G) video signal and blue (B) video signal.
In Fig. 8-2, the picture tube has three electron guns for the red, green, and blue phosphor dots on the screen. Each gun has the usual function of producing a beam of electrons, but the beam excites only one color. The reason is that the shadow mask has tiny holes aligned with the dot trios. When the beams converge at the proper angles, the electrons pass through the mask and excite the color dots. The red gun produces a red raster and picture on the screen; the green gun and blue gun do the same for their colors. If only one gun is working, you see just one color. With all three guns operating, the screen reproduces red, green, and blue and their color mixtures. In fact, the white raster is actually a combination of red, green, and blue.
Color dots are shown here, but the screen can have vertical stripes of red, green, and blue phosphors.
Encoding and decoding. If we had closed-circuit television, the red, green, and blue video signals would be the only information needed to reproduce the picture. For broadcasting, however, these color signals are not compatible with the monochrome television system for black and-white receivers. Therefore, the color video signals are encoded by combining them in specific proportions, to provide the same video in formation in a different form. The end result of the encoding is the formation of two separate signals: the C chrominance or chroma signal for color and the Y luminance or brightness signal for black-and-white information.
FIGURE 8-1 TELEVISING A SCENE TO OBTAIN R. G. AND B VIDEO SIGNALS FOR RED.
BLUE, AND GREEN COLORS IN THE SCENE.
At the receiver, the color picture tube still needs R, G, and B video signals, corresponding to the color phosphors on the screen. However, the C signal is decoded by demodulation. This detected output is then combined with the luminance signal to recover the original red, green, and blue video signals for the color picture tube. More details of the R, G, and B video signals are illustrated in Figs. 8-3 to 8-5.
-------------
------
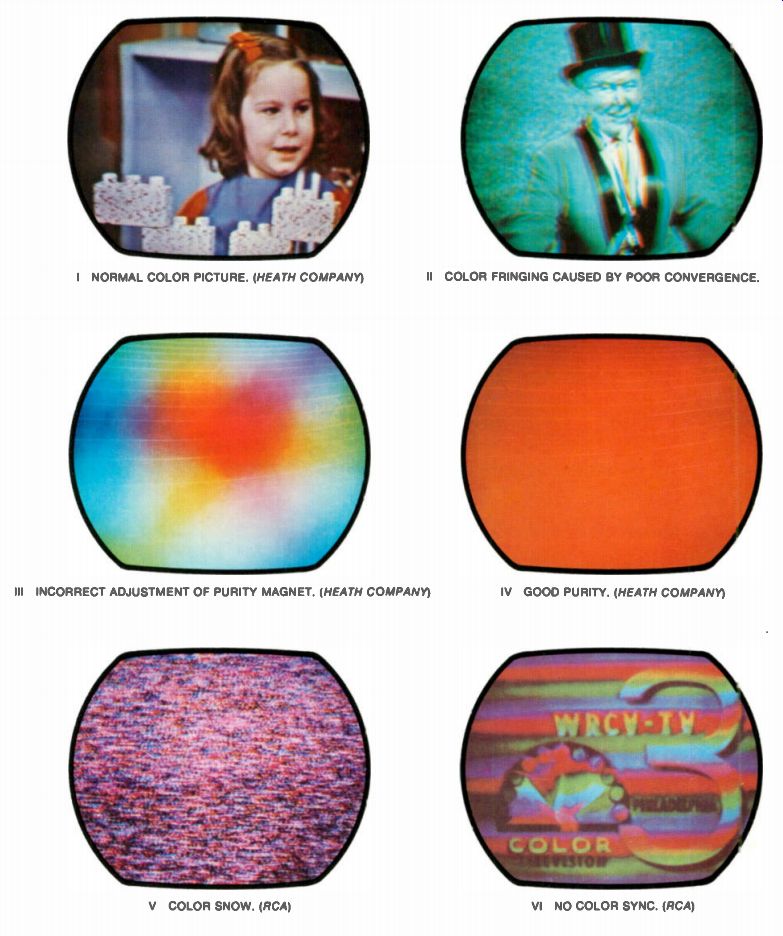
NORMAL COLOR PICTURE. (HEATH COMPANY) II COLOR FRINGING CAUSED BY POOR CONVERGENCE. CD/1 III INCORRECT ADJUSTMENT OF PURITY MAGNET. (HEATH COMPANY) V COLOR SNOW. (RCA) IV GOOD PURITY. (HEATH COMPANY) VI NO COLOR SYNC. (RCA)
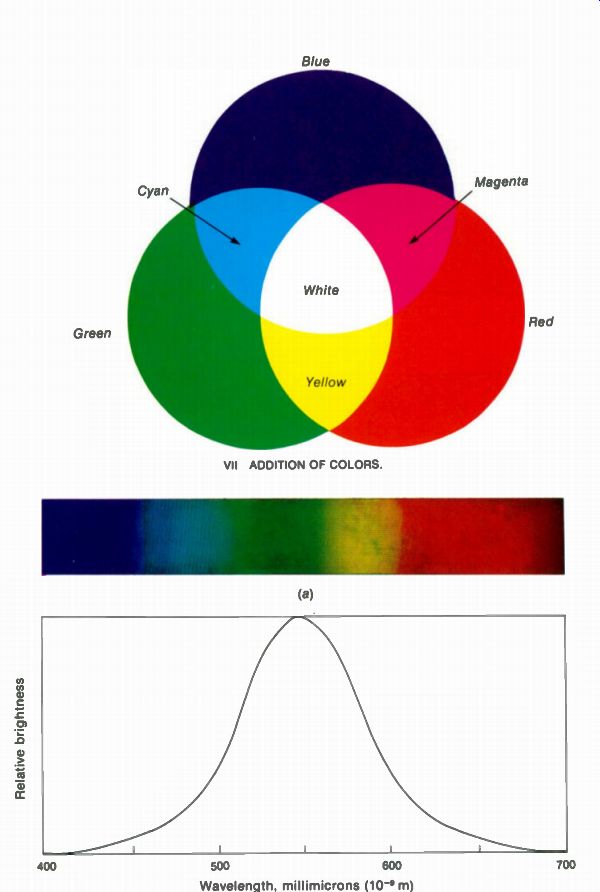
------ VIII RELATIVE BRIGHTNESS RESPONSE OF THE EYE. (a) HUES OF DIFFERENT WAVELENGTHS. (b) LUMINANCE OF SIGNAL VOLTAGE RESPONSE.
--------
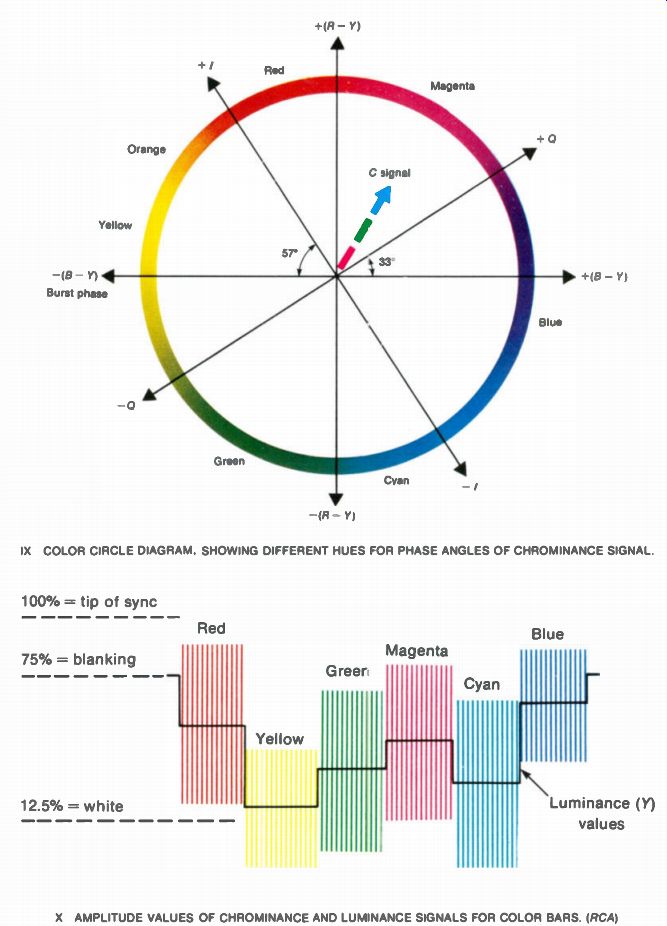
IX COLOR CIRCLE DIAGRAM. SHOWING DIFFERENT HUES FOR PHASE ANGLES OF CHROMINANCE SIGNAL.
X AMPLITUDE VALUES OF CHROMINANCE AND LUMINANCE SIGNALS FOR COLOR BARS (RCA)
----------
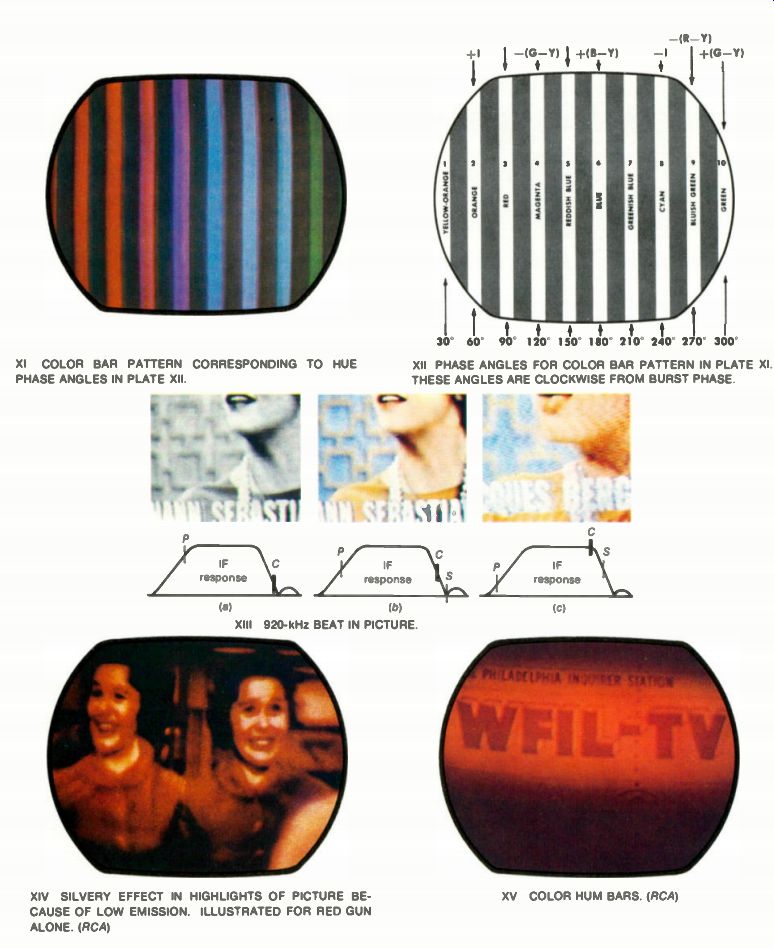
XI COLOR BAR PATTERN CORRESPONDING TO HUE PHASE ANGLES IN PLATE
XII. XII PHASE ANGLES FOR COLOR BAR PATTERN IN PLATE
XI. THESE ANGLES ARE CLOCKWISE FROM BURST PHASE
XIII 920-kHz BEAT IN PICTURE.
XIV SILVERY EFFECT IN HIGHLIGHTS OF PICTURE BE CAUSE OF LOW EMISSION. ILLUSTRATED FOR RED GUN ALONE. (RCA)
XV COLOR HUM BARS. (RCA)
------------------
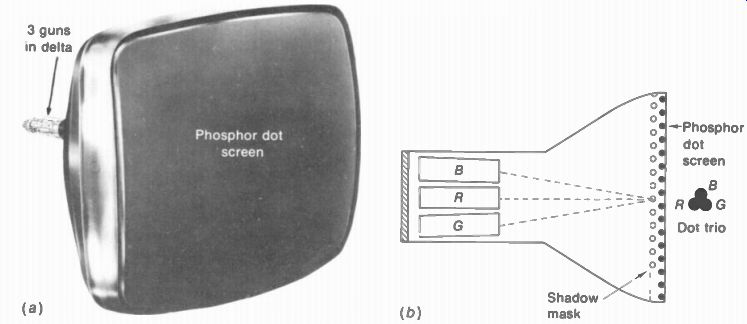
FIGURE 8-2 (a) PHOTO OF THREE-GUN TRICOLOR PICTURE TUBE, TYPE NUMBER 25AB22.
SCREEN DIAGONAL IS 25 IN.; COLOR PHOSPHOR NUMBER IS P22. (b) INTERNAL CON STRUCTION WITH THREE ELECTRON GUNS, SHADOW MASK. AND DOT TRIOS OF RED, GREEN, AND BLUE PHOSPORS.
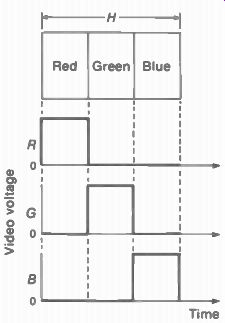
FIGURE 8-3 R, G. AND 13 VIDEO SIGNALS FOR RED, GREEN. AND BLUE COLOR BARS
H INDICATES ONE HORIZONTAL SCANNING LINE FOR WIDTH OF PICTURE
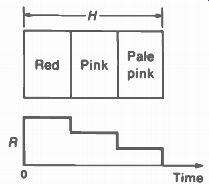
FIGURE 8-4 DECREASING AMPLITUDES OF R VIDEO SIGNAL FOR RED. PINK, AND PALE
PINK BARS. INDICATING WEAKER COLORS.
FIGURE 8-5 INCREASING FREQUENCIES OF R VIDEO SIGNAL FOR NARROWER RED BARS,
INDICATING SMALLER DETAILS OF COLOR INFORMATION.
Color video amplitudes. In Fig. 8-3, the separate R, G, and B video signals are shown for a horizontal line scanned across the image with vertical red, green, and blue bars. The bars just represent picture information of their particular color. The R signal voltage has its full amplitude while the red bar is scanned. However, there is no R video signal for the green or blue information. Similarly, the G video voltage is produced only when green picture information is scanned, and the B video voltage indicates blue information.
FIGURE 8-3 R, G. AND 13 VIDEO SIGNALS FOR RED, GREEN. AND BLUE COLOR BARS
H INDICATES ONE HORIZONTAL SCANNING LINE FOR WIDTH OF PICTURE
Different values of color voltage are illustrated in Fig. 8-4. Here the red, pink, and pale pink bars have decreasing values of color intensity. Therefore, the corresponding video voltages have decreasing amplitudes. We can say, then, that R, G, or B video voltage indicates in formation of that color, while the relative amplitude depends on the color intensity.
Color video frequencies. In Fig. 8-5, all the color bars are red, but the bars just became narrower. This case is just a question of less scanning time across smaller details of picture information. The result is higher video frequencies.
For either chrominance or luminance information, the high-frequency components of the video signal determine the amount of horizontal detail that can be reproduced in the picture.
8-2 Color Addition
Almost any color can be produced by adding red, green, and blue in different proportions.
The additive effect is obtained by superimposing the individual colors. In a tricolor picture tube, the color addition results as the red, green, and blue information on the screen is integrated by the eye to provide the color mixtures in the actual scene.
Additive color mixtures. The idea of adding colors is shown in color plate VII. There are three circles in red, green, and blue, which partially overlap. Where the circles are superimposed, the color shown is the mixture produced by adding the primary colors. At the center, all three color circles overlap, resulting in white.
Where only green and blue add, the result ant color is a greenish-blue mixture called cyan.
The red-purple color shown by the addition of red and blue is called magenta or violet. More blue with less red produces purple. Yellow is an additive color mixture of approximately the same amount of red and green. More red with less green produces orange. Similarly, practically all natural colors can be produced as additive mixtures of red, green, and blue.
Primary colors. These are combined to form different color mixtures. The only requirement is that no primary can be matched by any mix ture of the other primaries. Red, green, and blue are the primary colors used in television because they produce a wide range of color mixtures when added. Therefore, red, green, and blue are additive primaries.
Complementary colors. The color that produces white light when added to a primary is its complement. For instance, yellow added to blue produces white light. Therefore, yellow is the complement of the blue primary. The fact that yellow plus blue equals white follows from the fact that yellow is a mixture of red and green.
Therefore, the combination of yellow and blue actually includes all three additive primaries.
Similarly, magenta is the complement of green, while cyan is the complement of red. Some times the complementary colors cyan, magenta, and yellow are indicated as minus-red, minus green, and minus-blue, respectively. The reason is that each can be produced as white light minus the corresponding primary.
The complementary colors are also known as the subtractive primaries. In a reproduction process such as color photography, color mixtures are obtained by subtracting individual colors from white light with color filters.
Then cyan, magenta, and yellow are the subtractive primary colors used to filter out red, green, and blue.
A primary and its complement can be considered opposite colors. The reason is that for any primary its complement contains the other two primaries. This idea is illustrated by the color circle in Fig. 8-6, with the dashed lines between each primary and its opposite complementary color.
The hue of the complementary colors can be seen in color plate IX. Cyan is a greenish blue and magenta is a purplish red. When considered as primary colors in a subtractive system, these colors are often labeled simply blue, red, and yellow. However, this blue is really cyan with green and blue; the red is magenta combining blue with red; the yellow combines green and blue.
Adding for colors. It can be useful to consider how mixtures of red, green, and blue video signal voltages are the same as combinations of the primary colors and their complements. The reason for the similarity of the voltages and colors is the fact that a tricolor picture tube really operates as a color mixer. What you see on the screen is the superimposed combination of red, green, and blue. This effect is most obvious when looking at a raster alone, without any picture. If the blue gun is cut off by reducing either the bias or screen-grid voltage, the electron beams of the red and green guns can produce a yellow raster. If there is more red and less green, you will see the raster color become orange.
Similarly, the blue and green guns operating without the red gun produce cyan; or the red and blue guns produce magenta. With all three guns operating to reproduce red, green, and blue in the correct proportions, the raster is white. For the opposite case, all three guns are cut off to reproduce black, which is just the absence of light.
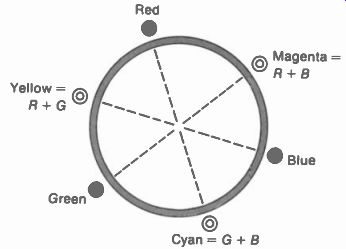
FIGURE 8-6 COLOR WHEEL SHOWING PRIMARY COLORS RED, GREEN, AND BLUE WITH THEIR
OPPOSITE COMPLE MENTARY COLORS CYAN. MAGENTA. AND YELLOW.
Complementary voltage polarities. Another important feature of color video voltages is the fact that opposite polarities correspond to complementary colors. To illustrate this idea, assume the blue video voltage has the polarity that increases beam current of the blue gun. More blue video voltage produces more beam current from the blue gun to reproduce more blue in the raster and picture. Although all three guns are operating, we are looking only at the effect of blue for this example. It should be noted now that the opposite polarity of blue video voltage decreases the beam current. Then less beam current from the blue gun reduces the amount of blue on the screen. The effect is the same as in creasing the red and green, which is a yellow combination. Furthermore, yellow is the complement of blue. The result, then, is that reversing the polarity of a color video voltage is a change to its complementary color.
8-3 Definitions of Color Television
Terms Any color has three characteristics needed to specify the visual information. First is its hue or tint, which is what we generally call the color; second is its saturation; and third is the luminance. Saturation indicates how concentrated, vivid, or intense the color is. Luminance indicates the brightness, or what shade of gray the color would be in black-and-white. These qualities of colors and other important terms are defined now in order to analyze the special features of color television broadcasting.
White. Actually, white light can be considered as a mixture of the red, green, and blue primary colors in the proper proportions. A glass prism can produce the colors of the rainbow from white light. For the opposite effect, red, green, and blue can be added to produce white. The reference white for color television is a mixture of 30 percent red, 59 percent green, and 11 percent blue.
These percentages for the luminance signal are based on the sensitivity of the eye to different colors. As shown in color plate VIII, green has the greatest relative brightness.
The degree of white is generally specified as a color temperature of 6,500 K. This is a bluish white, like daylight. The symbol "K" indicates degrees Kelvin on the absolute tempera ture scale, which is 273° below °C. Hue. The color itself is its hue or tint. Green leaves have a green hue; a red apple has a red hue; the color of any object is distinguished primarily by its hue. Different hues result from different wavelengths of the light producing the visual sensation in the eye.
Saturation. Saturated colors are vivid, intense, deep, or strong. Pale or weak colors have little saturation. The saturation indicates how little the color is diluted by white. As an example, vivid red is fully saturated. When the red is diluted by white, the result is pink, which is really a de-saturated red. It is important to note that a fully saturated color has no white. Then the color has only its own hue, without any other components that could be added by the red, green, and blue of white.
Chrominance. This term is used to indicate both hue and saturation of a color. In color television, the 3.58-MHz color signal more specifically is the chrominance signal. In short, the chrominance includes all the color information, without the brightness. The chrominance and brightness together specify the picture information completely. Chrominance is also called chroma.
In color television, we can reserve the term "chrominance" or "chroma" for the 3.58-MHz modulated subcarrier. This C signal contains the hue and saturation for all the colors. Its frequency is 3.58 MHz. However, before modulation and after demodulation, the color information is in the red, green, and blue color video signals. The range of these modulation frequencies, or the baseband for color, can be considered practically as 0 to 0.5 MHz.
Luminance. Luminance indicates the amount of light intensity, which is perceived by the eye as brightness. In a black-and-white picture, the lighter parts have more luminance than the dark areas. Different colors also have shades of luminance, however, as some colors appear brighter than others. This idea is illustrated by the relative luminosity curve in color plate VIII. The curve shows that the green hues between cyan and orange have maximum brightness.
The luminance really indicates how the color will look in a black-and-white reproduction. Consider a scene being either photographed on black-and-white film or televised in monochrome. The picture includes a colorful costume with a dark red skirt, yellow blouse, and a light blue hat. For the same illumination, these different hues will have different brightness values and will therefore be reproduced in different shades of monochrome. As shown by the graph in color plate VIII for relative brightness values of different hues, dark red has low brightness, yellow has high brightness, and blue is medium in relative brightness. Therefore, the mono chrome picture reproduction will show a white blouse (for yellow) with a black shirt (for dark red) and a gray hat (for light blue). It is the relative brightness variations for different hues that make it possible to reproduce scenes that are naturally in color as similar pictures in black and white.
In color television, the luminance information is in the luminance or Y signal. This abbreviation should not be confused with yellow, as the luminance signal contains the brightness variations for all the information in the picture.
Compatibility. Color television is compatible with black-and-white television because essentially the same scanning standards are used and the luminance signal enables a monochrome receiver to reproduce in black and white a picture televised in color. In addition, color television receivers can use a monochrome signal to reproduce the picture in black and white. Color television broadcasting uses the same 6-MHz broadcast channels as in monochrome trans mission. Also, the same picture carrier frequency is used.
Subcarrier. This is a carrier with modulation that modulates another carrier wave of higher frequency. In color television, the color information modulates the 3.58-MHz color subcarrier, which modulates the main picture carrier in the standard broadcast channel.
Multiplexing. This is the name for the technique of using one carrier for two separate signals. In color television, the 3.58-MHz C signal is multiplexed with the Y signal as both modulate the main picture carrier wave. Another example of multiplexing is stereo broadcasting in the commercial FM broadcast band, to transmit left and right audio signals on one rf carrier.
8-4 Encoding the 3.58- MHz C Signal at the Transmitter
Now we can consider more details of how the chrominance signal is produced for transmission to the receiver. First, the R, G. and B video voltages provide the color information. Then these primary signals are encoded to form separate chrominance and luminance signals. The luminance signal is formed directly from the R, G, and B video signals. However, the chrominance signal is formed from two color-mixture video signals, instead of from the three primary signals. The purpose is to have two quadrature signals 90 deg out of phase with each other. Furthermore, these two quadrature signals have all the chrominance information because the color mixtures include red, green, and blue.
The primary color video signals. The camera receives red, green, and blue light corresponding to the color information in the scene, to produce the primary color video signals in Fig. 8-7. These waveforms illustrate the voltages obtained in scanning one horizontal line across the color bars indicated. The red camera tube produces full output for red, but no output for green and blue. Similarly, the green or blue camera tube has output only for that color.
Notice the values shown for yellow, as an example of a complementary color. Since yellow includes red and green, video voltage is produced for both these primary colors, as the red and green camera tubes have light input through their color filters. However, there is no blue in yellow. This is why the blue video voltage is at zero for the yellow bar.
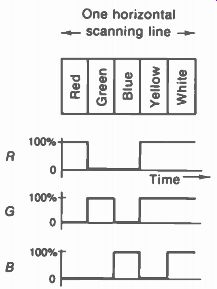
FIGURE 8-7 R, G, AND B VIDEO SIGNAL VOLTAGES FOR COLOR-BAR PATTERN.
The last bar at the right is white, as an ex- ample that includes all three primaries. Then all three camera tubes have light input, and there are color video signals for red, green, and blue.
The red, green, and blue video voltages are then combined in order to encode the primary color voltages as brightness and chrominance signals for transmission to the receiver.
This process is illustrated by the block diagram in Fig. 8-8.
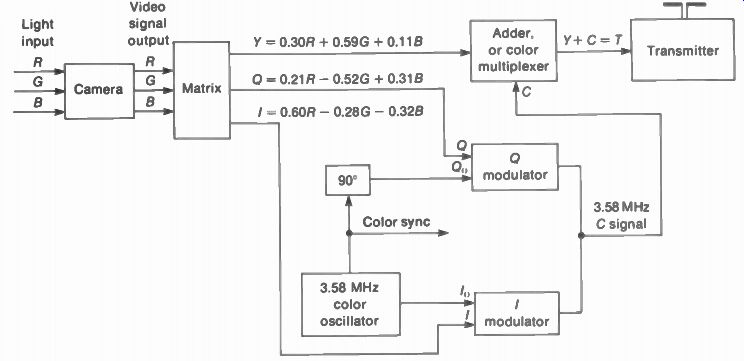
FIGURE 8-8 FUNCTIONS OF THE TRANSMITTER IN ENCODING THE PICTURE
Information FOR COLOR TELEVISION BROADCASTING. SEE TEXT FOR DETAILS.
Matrix section. A matrix circuit forms new output voltages from the signal input. The matrix at the transmitter combines the R, G, and B voltages in specific proportions to form three video signals that are better for broadcasting. One signal has the brightness information. The other two signals have the chrominance information.
Specifically, these three signals from the matrix are as follows:
1. Luminance signal, designated the Y signal.
This combination of R, G, and B contains the brightness variations, corresponding to a monochrome video signal. The Y signal is formed by taking 30 percent of R video, 59 percent of G video, and 11 percent of B video.
2. A color mixture, designated the I signal.
Positive polarity of I signal is orange; negative polarity is cyan. These colors result from the fact that I = 0.60R - 0.2 t - 328.
3. A color mixture, designated the signal.
Positive Q signal is purple; negative polarity is yellow-green. These colors result from the fact that Q = 0.21R - 0.52G + 0.31B.
The letter "Q" here is for quadrature, as the Q signal modulates the color subcarrier 90 deg. out of phase with the I signal. The letter "I" indicates in phase. Note that the negative signs for subtracting R, G, or B signals mean adding the video voltages in negative polarity. The orange and cyan of the I signal are chosen as the best colors for very small details. Automatically, then, the Q signal colors are magenta and yellow-green because this color axis is 90 deg. off the I color axis.
The I and Q signals are specified by the FCC for modulation at the transmitter. The I signal has more bandwidth, equal to 1.5 MHz, compared with 0.5 MHz for the Q signal. The purpose of extra bandwidth in the I signal is to allow more color detail at the receiver. However, receivers practically never use the added band width of the I signal, because the circuits are much simpler when all the color video signals have the same bandwidth of 0.5 MHz.
Specifically, the receivers generally use R-Y and B-Y demodulators. These two color video signals are also in quadrature with each other, but with a different phase angle than the! and Q signals. Actually, the receiver can detect the hue information of the C signal in different ways, as explained later with the hue-phase diagram in Fig. 8-16. Eventually, though, 'or any method of detection, the color information at the receiver must be converted to red, green, and blue video for the color picture tube.
Color subcarrier. The I and Q signals are transmitted to the receiver as the modulation side bands of a 3.58-MHz subcarrier, which in turn, modulates the main carrier wave. As an example, the picture carrier wave at 67.25 MHz for channel 4 can be modulated by the 3.58-MHz video-frequency color subcarrier. Note that the color subcarrier has the same video frequency of 3.58 MHz for all stations, although the as signed picture frequency is different for each channel. The value of 3.58 MHz is chosen as a high video frequency to separate the chrominance signal from low video frequencies in the luminance signal.
Chrominance modulation. Referring to Fig. 8-8, the output from the 3.58-MHz color subcarrier oscillator is coupled to the I and Q modulators. They also have I and Q video signal input from the matrix. Each circuit produces amplitude modulation of the 3.58-MHz subcarrier.
Notice the separate inputs for I and Q but the common output combines the I and Q modulation. This combined output is the 3.58-MHz modulated chrominance (C) signal.
The 3.58-MHz oscillator input to the Q modulator, labeled Q., is shifted by 90 deg, with respect to I. Modulating the subcarrier in two different phases keeps the I and Q signals separate from each other. The 90 deg angle provides maximum separation in phase between two signals.
Suppressing the subcarrier. Using only the modulation side bands, without the carrier itself, is called suppressed-carrier transmission. The purpose of suppressing the subcarrier is to reduce interference at 3.58 MHz, which can produce a fine dot pattern on the screen.
Color sync burst. With suppressed-carrier transmission, the receiver must have a 3.58-MHz oscillator circuit that generates the subcarrier, in order to detect the chrominance signal. Furthermore, a sample of the 3.58-MHz subcarrier is transmitted with the C signal as a phase reference for the color oscillator at the receiver. In color television, phase angle is hue.
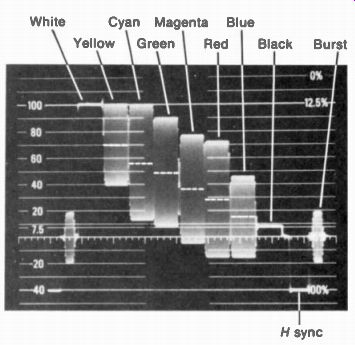
FIGURE 8-9 OSCILLOGRAM OF COLORPLEXED COMPOSITE VIDEO WITH C SIGNAL, COLOR
SYNC BURST. Y SIGNAL, AND H DEFLECTION SYNC. THE WHITE DOTTED LINES SHOW LEVELS
OF Y SIGNAL. (TEKTRONIX INC.)
The color synchronization for correct hues in the picture is accomplished by a burst of 8 to 11 cycles of the 3.58-MHz subcarrier on the back porch of each horizontal blanking pulse.
This color sync burst controls the frequency and phase of the 3.58-MHz oscillator at the receiver. Total color-plexed video signal. The C signal with the color information and the Y luminance signal are both coupled to the adder section or colorplexer. This stage combines the Y signal with the 3.58-MHz C signal to form the total colorplexed video signal marked T in Fig. 8-8.
This signal is transmitted to the receiver by amplitude modulation of the picture carrier wave in the station's assigned 6-MHz channel.
The T modulation is a composite video signal, including deflection sync and blanking pulses.
Negative polarity of transmission, 4.5-MHz separation from the sound carrier, and vestigial side bands are standard for the modulated picture carrier wave, as in monochrome broadcasting.
The oscilloscope waveshape for colorplexed video signal is shown in Fig. 8-9. This waveform illustrates how the signal includes all the information needed for the picture. The shaded areas are 3.58-MHz C signal, corresponding to color bars. Peak-to-peak amplitude of the C signal depends on the saturation or color intensity. The phase angles of the C signal for different hues cannot be seen because individual cycles are not shown.
In addition to the peak-to-peak amplitudes for the color bars, note that the average level is different for each bar. Specifically, the distance from the blanking level to the average level of the C signal is a measure of how dark or light the information is. These changing luminance levels are the variations in the Y luminance signal. If the 3.58-MHz C signal would be filtered out, the luminance levels would still re main to indicate the relative brightness values.
In Fig. 8-9, the average luminance levels form a staircase of voltages from white at the left to black at the right.
Hue and saturation in the C signal. The two phase modulation of the 3.58-MHz color subcarrier has the effect of concentrating all the color information into one chrominance signal. Consider the example of a strong I signal, with little Q signal. Then the resultant C signal has a phase angle close to the orange hue of I signal.
For the opposite case, with a strong Q signal and little I signal, the modulated C signal has a phase angle close to the purple hue of Q signal.
With equal amplitudes of I and Q modulating voltages, the phase of the C signal is between the I and Q phase angles, corresponding to a hue between orange and purple. The result, then, is that the instantaneous phase angle of the 3.58-MHz modulated C signal indicates the hue of the color information.
Furthermore, the amplitude variations of the modulated C signal indicate the strength or intensity of the color information. This variation corresponds to how saturated the color is. As a result, the hue is in the phase angle of the C signal, while its amplitude determines the saturation.
8-5 Decoding the 3.58- MHz C Signal at the Receiver
Most receivers decode the C signal into B - Y and R - Y color video signals. The B - Y video is a color mixture that is close to blue, as it consists of blue video and – Y video. B - Y hue has the phase angle in the C signal exactly 180 opposite from the phase of the color sync burst.
The phase in quadrature is R - Y video. This hue is close to red. Furthermore, B - Y video and R - Y video can be combined to supply G - Y video, as the Y signal has green in it. The bandwidth of all three of these color video signals is 0 to 0.5 MHz.
Separating the C signal. Starting with the receiving antenna, the modulated picture carrier of the selected channel is amplified in the rf and IF stages to be rectified in the video detector.
The detector output is the total colorplexed video signal, including the Y and C components.
After the video detector, the video circuits divide into two paths, as shown in Fig. 8-10. One path is for the Y luminance signal, while the other is for the 3.58-MHz C signal.
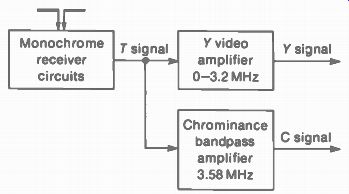
FIGURE 8-10 SEPARATING THE Y LUMINANCE SIGNAL AND THE 3.58-MHz MODULATED
CHROMA SIGNAL AT THE RECEIVER.
The output of the Y video amplifier is Y signal without the 3.58-MHz C signal. The reason is that the amplifier response is limited to frequencies below 3.2 MHz, approximately. The output of the chrominance bandpass amplifier is C signal. The reason is that this stage is tuned to 3.58 MHz, with a bandpass of - ±0.5 MHz, usually.
In all color receivers, the chrominance or color amplifier is resonant at 3.58 MHz, for any channel.
We can consider 3.58 MHz as the color intermediate frequency for the receiver.
The amplified 3.58-MHz C signal includes the chrominance modulation and color sync for the color section of the receiver. The original color information is in the modulated C signal, but it must be demodulated. The color sync controls the 3.58-MHz color oscillator used for the demodulator circuits.
Synchronous demodulation. When a modulated signal is transmitted without the carrier, or subcarrier, the original carrier wave must be reinserted at the receiver to detect the modulation. As shown in Fig. 8-11, the 3.58-MHz color oscillator supplies the subcarrier which is coupled to the demodulators with the C signal. Furthermore, it is important to note that this type of demodulator or detector has maximum output for the phase of the modulated signal that is the same as the oscillator input.
This circuit is a synchronous demodulator because it detects the modulation information that is synchronous with the reinserted carrier.
There is practically no output for signal in quadrature with the oscillator voltage. For this reason, two demodulators are needed to detect two color signals. Also, the two demodulators are generally 90 deg out of phase, for minimum interference between the two detected signals.
In Fig. 8-11 the demodulators produce B - Y and R - Y video. Then these two color mixtures are combined to provide G - Y. This addition is possible because green is in the Y component.
The picture tube as a matrix. When the receiver uses B - V. R - Y, and G - Y video signals, the picture tube can serve as the matrix to produce the primary colors. As shown in Fig. 8-12, the Y signal is coupled to the cathode for all three guns. Actually -Y signal is used because this polarity at the cathode cancels the
-Y component of the color voltages at each control grid. The results are the same as adding the components algebraically. For red (R), as an example, (R -Y) -(-Y) = R -Y-i-Y- R
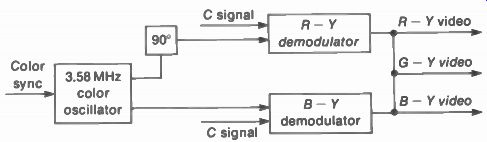
FIGURE 8-11 DETECTING THE MOD ULATED 3.58-MHz C SIGNAL WITH SYNCHRONOUS DEMODULATORS
90° OUT OF PHASE TO OBTAIN R - Y AND B - Y VIDEO SIGNALS. THESE TWO VOLTAGES
ARE COMBINED TO OB TAIN THE G - Y SIGNAL.
The same results for the three primary colors mean that the screen reproduces the color information as the required mixtures of red, green, and blue. As a summary of the different signals, Table 8-1 lists their sequence from camera tube to antenna at the transmitter, and from antenna to picture tube at the receiver.
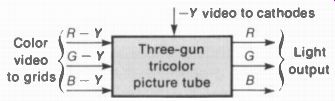
FIGURE 8-12
8-12 PICTURE TUBE AS A MATRIX THAT combineS Y SIGNAL WITH COLOR-DIFFERENCE VOLTAGES TO PRODUCE RED, GREEN, AND BLUE 8-6 The Y Signal for Luminance Now we can consider more details of the luminance signal, which contains the brightness variations of the picture information. The Y signal is formed by adding the primary red, green, and blue video signals in the proportions:
Y = 0.30R +0.59G +0.11B (8-1)
These percentages correspond to the relative brightness of the three primary colors. Therefore, a scene reproduced in black and white by the Y signal looks the same as when it is televised in monochrome.
-----------

TABLE 8-1 SEQUENCE OF COLOR SIGNALS
TRANSMITTER
1. R, G, and B video from camera.
2. Y, /, and 0 video from matrix.
3. I and Q modulate 3.58-MHz chrominance signal.
4 Colorplexed T signal with Y and 3.58-MHz C signals.
5 Antenna signal is rf picture carrier modulated by colorplexed T signal.
RECEIVER*
1. Antenna signal is rf picture carrier modulated by colorplexed T signal.
2. Modulated picture carrier is rectified in video detector.
3. Synchronous demodulators for 3.58-MHz C signal provide B - Y and R - Y video, which are combined for G - Y.
4. B - Y, R Y, and G - Y video to picture tube, with - Y video to cathodes.
5. Red, green, and blue, with their color mixtures, on screen of picture tube.
•For receivers using B - Y and R - Y demodulators and picture tube as matrix.
--------------
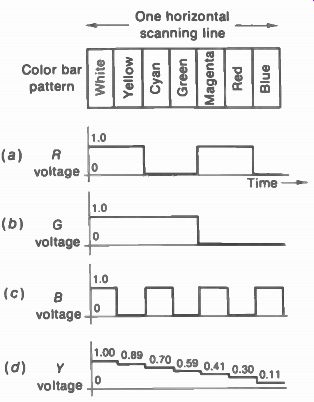
FIGURE 8-13 WAVEFORMS OF R, G. AND B VIDEO TO FORM THE Y SIGNAL. FOR COLOR-BAR
PATTERN.
Voltage values for Y signal. Figure 8-13 illustrates how the Y signal voltage in d is formed from the specified proportions of R, G, and B voltages for the color-bar pattern. Notice that the bars include the primary colors R, G, and B, their complementary mixtures of two primaries, and white for all three primaries.
The Y signal has its maximum relative amplitude of unity, 1.0 or 100 percent for white, because it includes R, G, and B. This value for white is calculated as Y = 0.30 + 0.59 + 0.11 = 1.00 As another example, the cyan color bar includes G and B but no R. Then the Y value for cyan is calculated as Y=0 +0.59 +0.11 =0.70 All the voltage values of the Y signal can be calculated in this way. The resulting voltages are the relative luminance values for each of the color bars. If the Y signal alone were used to reproduce this pattern, it would appear as monochrome bars shading off from white at the left to gray in the center and black at the right.
These light values correspond to the staircase of Y video voltages in Fig. 8-13d, for the decreasing relative brightness of these color bars.
Bandwidth of Y signal. This signal is transmit ted with the full video-frequency bandwidth of 0 to 4 MHz, the same as in monochrome broad casting. However, most receivers cut off the response for video frequencies at 3.2 MHz, approximately. The purpose is to minimize interference with the 3.58-MHz C signal. In monochrome receivers, the IF bandwidth is generally limited to 3 MHz.
Matrix for Y signal. A matrix has the function of adding several input voltages in the desired pro portions to form new combinations of output voltage. An example is illustrated in Fig. 8-14 for forming the Y signal. This circuit consists of three voltage dividers with a common resistor R,. Each divider proportions the R, G, or B input signals in accordance with the resistance of R _p R2, or R3, compared with R,. The result is Y signal across R4 as the common load resistor for the R, G, and B video voltages. Similarly, different resistance values can be used for separate voltage dividers to proportion the R, G, or B voltages in the percentages necessary to form I and Q signals at the transmitter.
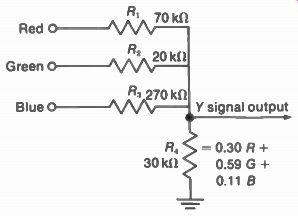
FIGURE 8-14 RESISTIVE VOLTAGE DIVIDER USED AS MA TRIX TO FORM Y SIGNAL AT
TRANSMITTER.
8-7 Types of Color Video Signals
The main types are for the primary colors, as the system starts with R, G, and B voltages for the camera tube and finishes with R, G, and B at the picture tube. However, color mixtures are used for encoding and decoding. The reason is that two color-mixture signals can have all the color information of the three primary colors, allowing the third signal to be Y signal for luminance.
signal. This color video voltage is produced in the transmitter matrix as the following combination of the red, green, and blue primary colors:
I = 0.60R - 0.28G - 0.32B (8-2)
The minus indicates the addition of video voltage of negative polarity. For instance, -0.32B means 32 percent of the total blue video signal but inverted from the polarity that reproduces blue. With +/ polarity, the signal includes red and minus blue, or yellow, which add to produce orange. For -/ signal, the polarity is reversed for all the primary components. Then the combination includes green and blue for cyan, with minus-red, which is cyan. As a result, opposite polarities of the I video signal represent the complementary colors orange and cyan, approximately. These hues are in color plate IX, which shows the main color video voltages.
Note that the negative components of -0.28G and -0.32B total -0.60 to equal the positive value of 0.60R. These values are chosen to make the amplitude of the I video signal become zero for white.
Q signal. The primary color voltages are combined in the transmitter matrix in the following proportions for the Q signal:
= 0.21R - 0.52G + 0.31B (8-3)
With +Q polarity, this signal includes minus-green, or magenta, with red and blue, which combine to form purple hues. For -Q signal, this polarity includes mainly green with minus-blue, or yellow, for a combination of yellow-green. As a result, opposite polarities of signal represent the complementary colors purple and yellow-green.
Note that the positive components of 0.21R and 0.31B total 0.52 to equal the negative component of -0.52G.
These values are chosen to make the amplitude of Q signal zero for white.
Both the I and Q signals are zero for white, as there is no chrominance information in white.
The luminance information for shades of white is in the Y signal.
B - Y signal. The hue of this signal is mainly blue, but it is a color mixture because of the -Y component. When we combine 100 percent blue with the primary components of the Y signal, the result is B - Y = 1.00B - (0.30R + 0.59G + 0.11B) or B - Y = -0.30R -0.59G + 0.89B (8-4)
Note that -R and -G combined equal the complement of yellow, which is blue. However, a little more minus-green shifts the hue toward magenta, resulting in a purplish blue. When the B – Y signal is combined with Y signal in the picture tube, it reproduces the blue information.
R - Y signal. The hue of R - Y is a purplish red. Combining red with the primary components of the Y signal results in R - Y= 1.00R - (0.30R + 0.59G + 0.11B)
Or R Y = 0.70R - 0.59G - 0.11B (8-5)
The minus-green is magenta, which is combined with red to produce a purple-red for positive polarity of R - Y signal. The opposite polarity of R - Y signal has the hue of cyan-blue.
When R - Y signal is combined with Y signal in the picture tube, it reproduces the red information.
G - Y signal. Combining -Y signal and 100 percent G results in G - Y = 1.00G - (0.30R + 0.59G + 0.11B) Or G - Y = - 0.30R + 0.41G - 0.11B (8-6)
The hue of G - Y signal is a bluish green.
The opposite polarity is a purplish red.
Then, with G - Y signal added to the Y signal in the color picture tube, the green information is reproduced.
In the receiver, G - Y video is obtained by combining R - Y and B – Y in the following pro portions: G - Y = -0.51 (R - Y) - 0.19 (B - Y) (8-7)
Summary of color video signals. All the color mixture voltages are related since each is a combination of R, G, and B. As additional examples, the I and Q signals can be specified in terms of the color difference signals as follows:
/ = - 0.27 (B - Y) + 0.74(R - Y) (8-8)
Q = 0.41(B - Y) + 0.48(R - Y) (8-9)
All these video signals are color mixtures, combining R, G, and B so that two signals contain all the color information of the three primaries.
It is important to note the difference between these color video voltages, without modulation, and the 3.58-MHz modulated C signal.
There is only one C signal, always at 3.58 MHz.
This signal is encoded with the chrominance in formation as hue and saturation, corresponding to the phase and amplitude of the modulation on the 3.58-MHz color subcarrier.
However, the different color video signals exist before modulation of the 3.58-MHz color subcarrier at the transmitter and after demodulation at the receiver. The color video signals and their main features are summarized in Table 8-2. The colors listed are for positive signal voltage. The opposite polarity for each signal has the opposite hue. You can see these hues in the color circle diagram in color plate IX. The bandwidth is 0.5 MHz for all except the I signal.
Relative gain values. The amplitudes of the color video signals are modified in transmission to prevent modulation past the maximum white and black levels. For instance, yellow with high luminance can over-modulate white; blue with low luminance can over-modulate black. As a result, the receiver must compensate with the following proportions of gain: B - Y gain is 2.03 = 49%
1 R - Y gain is 1.14 = 87.7% 1 G - Y gain is 0.70 - 142.3% As an example, the receiver gain for B - Y signal is made almost double the gain for R - Y signal.
The reason is that, in modulation at the transmitter, the B - Y component is reduced to 49 percent of its normal level.
8-8 The Color Sync Burst
Figure 8-15 shows the details of the 3.58-MHz color sync burst transmitted as part of the total composite video signal. The color burst synchronizes the phase of the 3.58-MHz color oscillator. This stage reinserts the 3.58-MHz color subcarrier in the synchronous demodulators to detect the chrominance signal. The phase of the reinserted oscillator voltage determines the hues in the detector output. Therefore, the color sync is necessary to establish the correct hues for the demodulators. Then the color AFC, which provides automatic frequency control of the color oscillator, can hold the hue values steady. Without color synchronization, the picture has drifting color bars.
The color sync burst is transmitted only for a color broadcast. The presence or absence of the burst determines how a color receiver recognizes whether a program is in color or monochrome.
The burst is 8 to 11 cycles of the 3.58-MHz subcarrier transmitted on the back porch of each horizontal blanking pulse. Peak value of the burst is one-half the sync pulse amplitude.
However, the average value of the burst coincides with the blanking level. This value corresponds to zero for deflection sync. As a result, the color burst does not interfere with synchronization of the deflection oscillators.
The burst and C signal are both 3.58 MHz.
However, the burst is on during blanking time only, when there is no picture information. The C signal is on during visible trace time for the color information in the picture. This comparison is illustrated in Fig. 8-15b.
-----------------
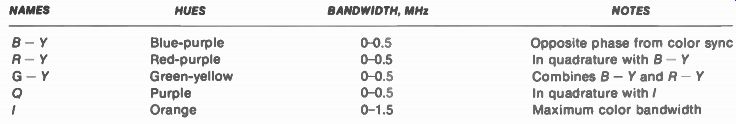
TABLE 8-2 TYPES OF COLOR VIDEO SIGNALS
NAMES HUES BANDWIDTH, MHz NOTES
--------------------
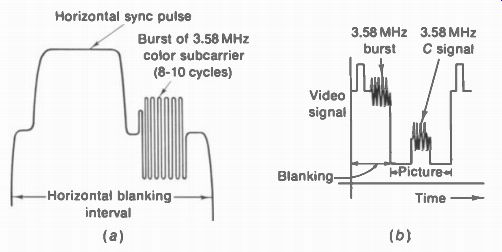
FIGURE 8-15 (a) COLOR SYNC BURST ON BACK PORCH OF EACH H SYNC PULSE (b) COMPARISON
OF BURST AND C SIGNAL
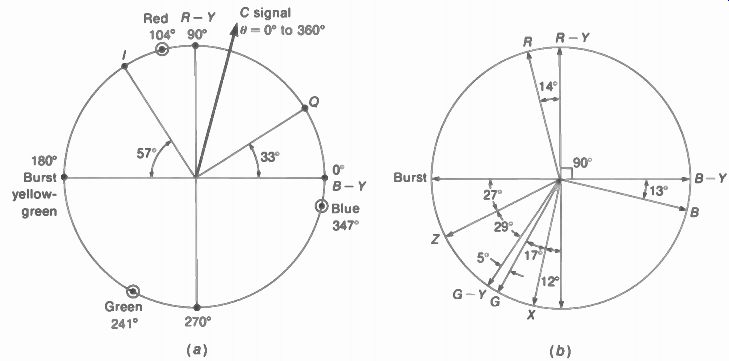
FIGURE 8-16 PHASE ANGLES OF DIFFERENT HUES. RELATIVE AMPLITUDES NOT TO SCALE.
(a) C SIGNAL WITH EQUAL I AND Q MODULATION. (b) COLOR AXES OFTEN USED FOR
DETECTION IN RECEIVER,
8-9 Hue Phase Angles
Figure 8-16 illustrates how the hues of the modulated C signal are determined by its varying phase angle with respect to the constant phase angle of the color sync burst. Note that the hue of the color sync burst corresponds to yellow-green. When picture information of this hue is being scanned at the transmitter, the phase angle of the chrominance signal is made the same as the phase of the color sync burst.
For other hues, the C signal has different phase angles. How much the phase angle differs from the sync burst phase determines how the hue differs from yellow-green. In Fig. 8-16a, the phase angle of the C signal indicates the hue of purple-red between the angles for blue and red.
This phase angle results from equal amounts of I and Q modulation. You can see all the hues and their phase angles in color plate IX. Opposite hues 180° apart are on a straight line called a color axis.
It should be noted that hue phase angles are indicated two different ways. Standard measure for angles counts counterclockwise as the positive direction from zero, as in Fig. 8-16a.
Then B - Y is at 0°, and the color sync burst is at 180°. However, since burst phase is the reference, the hue phase angles are often counted clockwise from burst. Then B - Y phase is at 180°. For the receiver demodulation axes in Fig. 18-16b, the angles are indicated by how much they are off the horizontal and vertical axes.
land Q axes. These are the color video signals used to modulate the 3.58-MHz subcarrier for broadcasting. As shown in Fig. 8-16a, the I axis is 57° off the phase of color sync burst. The Q axis is in quadrature. These angles put the phase of B - Y exactly opposite burst phase.
B - Y and R - Y axes. The receiver can recover these hues in demodulating the C signal by reinserting the 3.58-MHz color subcarrier at these phase angles. As shown in Fig. 8-16b, B - Y phase is 180° from burst phase, and R - Y phase is in quadrature. Two synchronous demodulators are needed to detect hues on the R - Y and B – Y axes. Then the R – Y and B - Y color video signals are added to form G - Y. Counting clockwise from burst, the phase angles are 90° for R - Y, 180° for B - Y, and 304° for G - Y. X and Z axes. As shown in Fig. 8-16b, the X axis is close to -(R - Y); the Z axis is close to -(B - Y) or burst phase. Counting clockwise from burst, the X axis is at 282° and the Z axis at 333°. Approximately 51° apart, the X and Z axes can be used in the receiver demodulators even though they are not in quadrature. The advantage is that R - Y, G - Y, and B - Y can be formed in three amplifier stages that are balanced, to reduce the possibility of color drift.
R, G, and B axes. Three demodulators can be used to recover red, green, and blue directly.
These three angles are almost equally spaced around the color circle, close to the phases of R - Y, G - Y, and B - Y.
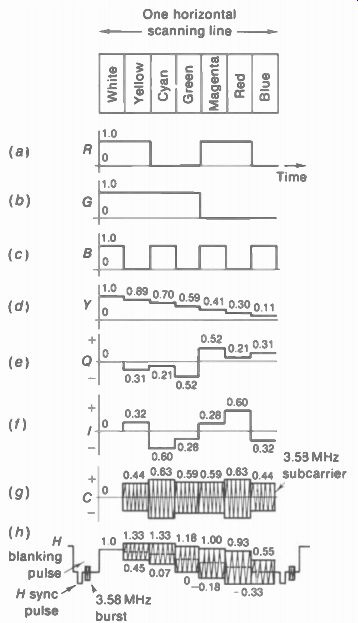
FIGURE 8-17 CONSTRUCTION OF COLORPLEXEDcom POSITE VIDEO SIGNAL FROM Y. I.
AND Q VOLTAGES WAVEFORM IN HAT BOTTOM SHOWS MULTIPLEXED Y AND C SIGNALS
8-10 The Colorplexed Composite Video Signal
Formation of the total video signal combining luminance and chrominance is illustrated in Fig. 8-17 in successive steps. Starting with the primary colors, the R, G, and B video voltages in Fig. 8-17a, b, and c are shown for the time of scanning one horizontal line across the color bars. The colors are fully saturated, without any white. This means the relative voltage value for R, G, and B is at 100 percent, or 1.0. Also, the saturated complementary colors yellow, cyan, and magenta have only two primary colors, since there is no white to add the third primary. Amplitudes of Y signal. The luminance signal in Fig. 8-17d shows the brightness component for each bar. The relative values for Y are calculated with Eq. (8-1). As an example, for magenta, combining red and blue without green; Y = 0.30R +0 +0.11 8 Y = 0.41
Amplitudes of I and Q signals. The I and Q waveforms in e and f have the relative voltages indicated according to their proportions of primary colors. These values are calculated with Eqs. (8-2) and (8-3). As examples, for yellow with red and green but no blue; I = 0.60R - 0.28G - 0.00B = 0.32 Q = 0.21R - 0.52G + 0.00B = -0.31
Note that the I and Q voltages can have positive or negative polarity because their components include positive and negative primary colors.
Phasor addition for C signal. The next wave form in g shows the 3.58-MHz color subcarrier modulated by the I and Q signals in quadrature.
The two-phase amplitude modulation results in varying amplitudes and phase angles for the C signal. The phase angles cannot be shown, but the varying amplitudes can be calculated. The method of phasor* addition for the I and Q signals in quadrature is the same as combining two ac voltages 90° out of phase in series ac circuits, written as
C = \,//, +
As an example, for yellow with values of 0.32 for
/ and -0.31 for 0, C = V(0.32)2 + (_0.31)2 = V 0.102 + 0.616 C = V0.1980 = 0.44
*Components with different angles in time are phasors; vectors have different angles in space.
This method can be used to calculate all the C values for the color bars in Fig. 8-17, by phasor addition of the I and Q amplitudes.
There is no polarity for the C signal because it is a carrier wave with both positive and negative half-cycles. Note that the peak amplitude of 0.44 for blue or yellow C signal means that it varies 0.44 units above and below the zero axis of this modulated ac waveform.
Yellow and blue have the same amplitudes but opposite phase angles because they are complementary colors.
Phase angle of C signal. If we want to know the phase angle 8 for the hue, this angle has the tangent equal to 0/I. As an example, for red with the Q of 0.21 and I of 0.60, then 0.21/0.60 =- 0.35 for tan O. This value of 0.35 for tan ii defines the angle 6 of 19°. This angle is 19° from I. toward O. Adding the Y and C signals. For the total video signal waveform in h, the Y amplitudes for luminance are combined with the C signal. The result is to shift the C signal variations to the axis of the Y luminance level, instead of its zero axis.
As an example, blue has the level of 0.11 in the Y signal and the peak amplitude of 0.44 in the C signal. When we combine these Y and C signals, the result in the colorplexed video signal for blue is that the positive peak goes up to 0.44 + 0.11 = 0.55. The negative peak goes down to -0.44 + 0.11 = -0.33. These maximum and minimum values are still ± - 0.44, but around the average axis of 0.11 for the Y signal. The same idea applies to all the color bars shown.
You can see how the color bars match the combined Y and C signals in color plate X. It is important to realize that the Y signal for luminance information is inserted as the average level of the C signal variations for color information. If the C signal is removed from the colorplexed S signal in h, the result will be the same staircase of Y signal variations shown in d.
In monochrome receivers, 3.58 MHz is filtered out to remove the color information, but the Y signal remains to provide the luminance variations.
8-11 De-saturated Colors with White
The relative voltage values shown in Fig. 8-17 are for vivid colors that are 100 percent saturated. In this case, there is no primary color video for hues not included in the color. As examples, saturated R has zero B and G video voltage; saturated yellow (red-green) has zero B video voltage. This follows from the fact that with zero light input to a given color camera there is no signal output.
In natural scenes, however, most colors are not 100 percent saturated. Then any color diluted by white light has all three primaries.
The following example illustrates how to take into account the amount of de-saturation for weaker colors. Assume 80 percent saturation for yellow. Now this color has two components: 80 percent saturated yellow and 20 percent white. First consider the primary color video signals produced by each camera tube:
80 percent yellow (red-green) produces 20 percent white (red-green-blue) produces
Total camera output is 0.80R 0.80G 0.008 0.20R 0.20G 0.20E3 1.00R 1.00G 0.20E3
These percentages of primary color video voltages can then be used for calculating relative amplitudes of the Y signal and color video signals for 80 percent saturated yellow. As examples, this de-saturated color has the Y value of 0.912, 0 value of -0.248, and I value of 0.256.
Compare these with the values of 0.89, -0.31, and 0.32 shown in Fig. 8-17 for 100 percent saturated yellow. Note that the addition of white to de-saturate a color increases the luminance value and decreases the chrominance value, compared with 100 percent saturation.
8-12 Color Resolution and Bandwidth
The Y signal is transmitted with the full video frequency bandwidth of 4 MHz for maximum horizontal detail in monochrome. However, this bandwidth is not necessary for the color video signals. The reason is that for very small details the eye can perceive only the brightness, rather than the color. Therefore, the color information can be transmitted with a restricted bandwidth much less than 4 MHz. This feature allows the narrowband chrominance signal to be multiplexed with the wideband luminance signal in the standard 6-MHz broadcast channel. All the color video signals have the bandwidth of 0 to 0.5 MHz, except the I signal with a bandwidth of 0 to 1.5 MHz. These values are in the third column of Table 8-2 on page 154.
The I signal for orange and cyan has more bandwidth because smaller details can be resolved for these colors. However, the I bandwidth of 0 to 1.5 MHz must be considered in two parts, in terms of its modulation side bands above and below the 3.58-MHz color subcarrier.
Frequencies of 0 to 0.5 MHz in the I signal are transmitted with double side bands, using both the upper and lower side frequencies produced by modulation. However, for frequencies between 0.5 and 1.5 MHz, only the lower side bands are transmitted. This method of vestigial sideband transmission on the 3.58-MHz color subcarrier is used to provide maximum band width for the I signal without extending into the frequencies of the sound carrier signal 4.5 MHz from the picture carrier signal. The bandwidths for the Y, I, and Q signals are illustrated by the graphs in Fig. 8-18.
The extra bandwidth of the I signal is seldom used in color receivers. The reason is that the color circuits are much simpler when all the color video signals have the same bandwidth of 0.5 MHz, the practical baseband for color.
As a result, we can consider the video frequencies of 0 to 0.5 MHz as the practical bandwidth for color. How this information is reproduced is illustrated by the pattern in Fig. 8-19. The squares and bars are drawn to scale for a screen width of 20 in. Keep in mind the fact that the video frequency of 0.5 MHz corresponds to horizontal details 1/50 of the width of this picture. This value of 50 details is calculated as 1/8 of 400 approximately, just as 0.5 MHz is 'Is of 4 MHz. All the squares are in color because their width is more than 1/50 of 20 in., equal to 0.4 in.
The vertical bar at the left is in color, as its width is 0.4 in. The vertical bar at the left is in color, as its width is 0.4 in. The entire background is in color as these large areas represent low video frequencies. Also, any horizontal bars are in color because vertical scanning represents low video frequencies.
The vertical bar at the right is not in color because it is less than 0.4 in. wide. The vertical edges between the pattern and the background also are in monochrome because these narrow details correspond to video frequencies higher than 0.5 MHz. The only parts of the picture not in color are vertical edges and bars less than 0.4 in. wide, corresponding to video frequencies higher than 0.5 MHz.
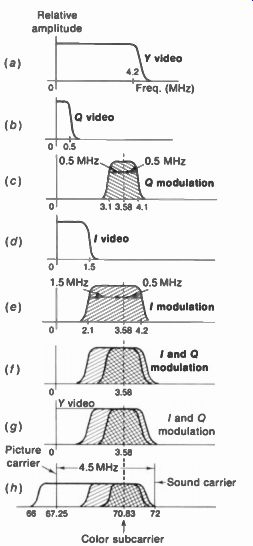
FIGURE 8-18 BANDWIDTH FOR Y AND C SIGNAL FRE QUENCIES. GRAPH IN h AT BOTTOM
IS FOR COLOR PLEXED COMPOSITE VIDEO SIGNAL MODULATING CHANNEL 4 PICTURE CARRIER
AT 67.25 MHz.
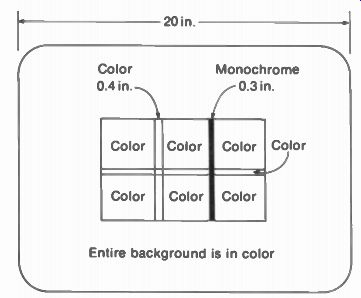
FIGURE 8-19 AREAS OF COLOR IN PICTURE WITH VIDEO BANDWIDTH OF 0 TO 0.5 MHz.
8-13 Color Subcarrier Frequency
This must be a high video frequency, in the range between 2 and 4 MHz approximately. If the color subcarrier frequency is too low, it can produce excessive interference with the luminance signal. At the opposite extreme, the chrominance signal can interfere with the sound signal. The choice of approximately 3.58 MHz for the color subcarrier is a compromise that allows 0.5-MHz side bands for chrominance in formation below and above the subcarrier frequency. Also, there is room for the extra 1 MHz of lower side frequencies of the I signal.
Most important for compatibility, 3.58 MHz is a video frequency high enough to have little response in monochrome receivers. These sets use the luminance signal alone, with practically no effect from the 3.58-MHz chrominance signal.
The exact frequency of the color subcarrier is based on the following additional factors:
1. The transmitted picture carrier and sound carrier frequencies cannot be changed, in order to preserve the 4.5-MHz beat for inter carrier sound receivers.
2. There will be an interfering beat frequency of approximately 0.92 MHz or 920 kHz between the color subcarrier frequencies near 3.58 MHz and the intercarrier sound at 4.5 MHz.
3. There will be interfering beat frequencies between the chrominance signal and higher video frequencies of the luminance signal.
In order to minimize these interference effects, the color subcarrier frequency is made exactly 3.579545 MHz. This frequency is deter mined by harmonic relations for the color sub carrier, the horizontal line-scanning frequency, and the 4.5-MHz intercarrier beat.
Horizontal frequency. Specifically, the sound frequency of 4.5 MHz is made to be the 286th harmonic of the horizontal line frequency.
Therefore, 4.5 MHz 286 = 15,734.26 Hz where 1 H is the horizontal line-scanning frequency for color television broadcasting. Notice that 286 is the even number that will make f n closest to the value of 15,750 Hz used for horizontal scanning in monochrome television. The slight difference has practically no effect from horizontal scanning and sync in the receiver be cause of the horizontal AFC circuit.
Vertical frequency. The vertical scanning frequency is also changed slightly since there must be 262.5 lines per field. Then the vertical field-scanning frequency is 15,734.26 I, = 262.5 Hz = 59.94 Hz The slight difference of 0.06 Hz below 60 Hz has practically no effect on vertical scanning and sync in the receiver, because an oscillator that can be triggered by 60-cycle pulses can also be synchronized by 59.94-Hz pulses. It should be noted that when the scanning frequencies are shifted slightly for color television, the transmitted sync is also changed to the new frequencies for f_V and f_H.
Color frequency. With the horizontal line scanning frequency chosen, now the color sub carrier can be determined. This value is made to be the 455th harmonic of f_H/2:
2 C = 455 x - 3.579545 MHz
15,734.26 Hz /
To obtain this exact frequency, the color oscillator is crystal-controlled. A typical quartz crystal unit is shown in Fig. 8-20. The multiple of 455 is chosen as an odd number that makes C close to 3.58 MHz.
Frequency interlace. Because of the odd-line interlaced scanning pattern, picture information for video frequencies that are odd multiples of f_H/2 tends to cancel in the effect on the screen of the picture tube. The cancellation results because these frequencies have opposite voltage polarities for the picture information on even and odd scanning lines. You can see this canceling effect by coupling from a signal generator output voltage at 2 to 4 MHz into the video amplifier to produce a diagonal-bar interference pattern on the picture tube screen. By adjusting the generator frequency carefully and watching the screen pattern closely, at certain frequencies the interference pattern will disappear. These frequencies are odd multiples of one-half the horizontal line-scanning frequency.
This technique of interlacing odd and even harmonic components of two different signals in order to minimize interference between them is frequency interlace. As a result, the chrominance signal can be transmitted in the same 6-MHz channel as the luminance and sound signals with practically no interference.
8-14 Color Television Systems
The standards described here are for the NTSC system, an abbreviation of National Television System Committee. This group formed by the Electronic Industries Association also prepared the standards for monochrome television in the United States. The Federal Communications Commission (FCC) approved the monochrome standards in 1941. The NTSC color television system was adopted in 1953.
Historically, color television broadcasting began experimentally about 1949 with two competing systems by RCA and CBS. The CBS system used a mechanical color wheel with red, green, and blue in sequential fields. This method used scanning frequencies that were not compatible with monochrome broadcasting.
The RCA system used compatible scanning standards. The CBS system was adopted for a short time in 1951 but used very little. Then the NTSC prepared new standards based on the RCA system. After field trials, the NTSC system was adopted by the FCC. The NTSC color television system is standard in the United States, Canada, Japan, and most countries in the Western Hemisphere.
For more details on PAL and SECAM, see C. R. G. Reed, "Principles of Colour Television Systems," Isaac Pitman and Sons Ltd., London, 1969
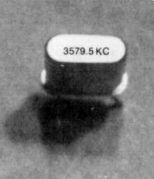
FIGURE 8-20 CRYSTAL FOR COLOR OSCILLATOR IN RECEIVER. HEIGHT IS 1 IN. FREQUENCY
IS EXACTLY 3.579.545 kHz OR 3.579545 MHz.
In Europe, the main color television systems are PAL and SECAM.* The PAL (for Phase Alternation by Line) system is similar to the NTSC system, but for each successive line one component of the chrominance signal is re versed in polarity. The purpose is to average out any errors in hue phase. This system is used in Germany and most European countries except France. SECAM is a French system with a sequential technique and memory storage. In this method, two chrominance signals are transmitted, one at a time, for successive lines.
It should be noted that other countries may have scanning standards and a channel width different from the United States. Also, the color subcarrier frequency of 3.58 MHz is essentially for a 6-MHz broadcast channel. Standards for principal television systems of the world are listed in Appendix C at the back of the guide.
SUMMARY
The following definitions, in alphabetical order, summarize the main features of color television.
B - Y signal. Color mixture close to blue. Phase is 180 deg. opposite from color sync burst. Bandwidth is 0 to 0.5 MHz.
Burst. Color sync. Is 8 to 11 cycles of 3.58-MHz color subcarrier transmitted on back porch of every horizontal pulse. Needed to synchronize phase of 3.58-MHz oscillator in receiver for correct hues in C signal. The hue of color sync phase is yellow-green.
Chrominance signal. Also called chroma signal or C signal. Is 3.58-MHz color sub carrier with quadrature modulation by I and Q color video signals. Amplitude of C signal is saturation; phase angle is hue.
Colorplexer. Also called multiplexer. Combines C signal and Y luminance signal.
Result is total colorplexed composite video signal transmitted to receiver as amplitude modulation of picture carrier.
Compatibility. Ability of monochrome receiver to use Y signal for picture in black and white. Also allows color receiver to reproduce monochrome picture. Compatibility results from transmission of Y signal for luminance and use of practically the same scanning standards for color and monochrome.
Complementary color. Opposite hue and phase angle of primary color. Cyan, magenta, and yellow are complements of red, green. and blue, respectively.
Decoding. Converting hue and saturation in the C signal to R, G, and B primary color video signals for the tricolor picture tube.
Encoding. Converting the R, G, and B primary color video signals to hue and saturation in the C signal.
Frequency interlace. Placing harmonic frequencies of C signal midway between harmonics of horizontal scanning frequency 1,. Accomplished by making color subcarrier frequency exactly 3.579545 MHz.
G - Y signal. Color mixture close to green. Bandwidth is 0 to 0.5 MHz. Usually formed by combining B - Y and R - Y video signals.
Hue. Also called tint. Wavelength of light for the color. The varying phase angles in the 3.58-MHz C signal indicate the different hues in the picture information.
I signal. Color video signal transmitted as amplitude modulation of the 3.58-MHz C signal. Hue axis is orange and cyan. This is the only color video signal with bandwidth of 0 to 1.5 MHz.
Luminance. Also brightness, for either color or monochrome information. Luminance information is in the Y signal.
Matrix. Combines signals in specific proportions. Transmitter matrix forms Y, I, and ()video signals in the output for R, G, and B input. At the receiver, the three-gun picture tube is often the matrix for input of R - Y, B - Y, G - Y, and Y signals to produce red, green, and blue light from the screen.
Monochrome. In black and white. Just luminance or brightness without color. Also called achromatic. The Y signal is a monochrome signal.
Multiplexing. Combining two signals on one carrier.
NTSC. National Television System Committee. The name for the standard color television system adopted by the FCC for use in the United States.
Primary colors. Red, green, and blue. Opposite voltage polarities are the complementary colors cyan, magenta, and yellow.
Q signal. Color video signal that modulates 3.58-MHz C signal in quadrature with I signal. Hues are green and magenta. Bandwidth is 0 to 0.5 MHz.
R - Y signal. Color mixture close to red. Phase is in quadrature with B - Y. Bandwidth is 0 to 0.5 MHz.
Saturation. Intensity of color. Full saturation means no dilution by white. Different saturation values are varying peak-to-peak amplitudes in the 3.58-MHz modulated C signal.
Subcarrier. A carrier that modulates another carrier wave of higher frequency. In color television the 3.58-MHz color subcarrier modulates the rf picture carrier wave in the standard broadcast channel.
Suppressed subcarrier. Transmission of the modulation side bands without the sub carrier itself. Requires reinsertion of the subcarrier at the receiver for detecting the modulation.
Synchronous demodulator. Detector circuit for a specific phase of the modulated signal.
White. Contains red, green, and blue in the proportions Y = 0.30R + 0.59G + 0.11B.
Self-Examination (Answers at back of guide)
Choose (a), (b), (c), or (d).
1. Brightness variations of the picture information are in which signal? (a) I; (b) 0; (c) Y; (d) R - Y.
2. The hue 180° out of phase with red is (a) cyan; (b) yellow; (c) green; (d) blue.
3. Greater peak-to-peak amplitude of the 3.58-MHz chrominance signal indicates more (a) white; (b) yellow; (c) hue; (d) saturation.
4. The interfering beat frequency of 920 kHz is between the 3.58-MHz color subcarrier and (a) 4.5-MHz intercarrier sound; (b) picture carrier; (c) lower adjacent sound; (d) upper adjacent picture.
5. The hue of color sync phase is (a) red; (b) cyan; (c) blue; (d) yellow-green.
6. Which signal has color information for 1.5-MHz bandwidth? (a) I; (b) Y; (c) R - Y ; (d) B
7. Which of the following is false? (a) I video hues are orange or cyan; (b) the transmitter matrix output includes Y, I, and Q video; (c) a three-gun picture tube can serve as a matrix; (d) a fully saturated color is mostly white.
8. The color with the most luminance is (a) red; (b) yellow; (c) green; (d) blue.
9. What is the hue of a color 90° leading sync burst phase? (a) yellow; (b) cyan; (c) blue; (d) orange.
10. The average voltage value of the 3.58-MHz modulated chrominance signal is (a) zero for most colors; (b) close to black for yellow; (c) the brightness of the color; (d) the saturation of the color.
11. The IF value for color in receivers, for any station, is (a) 0.5 MHz; (b) 1.5 MHz; (c) 3.58 MHz; (d) 4.5 MHz.
12. If the 3.58-MHz C amplifier in the receiver does not operate, the result will be (a) no color; (b) no red; (c) too much blue; (d) too much yellow.
Essay Questions
1. What is meant by color addition? Name the three additive primary colors.
2. What color corresponds to white light minus red? White minus blue? White minus green?
3. Why are the primary color video voltages converted to Y and C signals for broad casting?
4. Define hue, saturation, luminance, and chrominance.
5. What is the video-frequency bandwidth of the Y signal?
6. What parts of the picture are reproduced in black and white by the Y signal? What parts are reproduced in full color as mixtures of red, green, and blue?
7. What hues correspond to the following: +/, -/, +Q, -Q, R - Y, - (R - Y), (B - Y), and color sync burst?
8. How is the 3.58-MHz modulated chrominance signal transmitted to the receiver? Why is the 3.58-MHz signal called a subcarrier?
9. Describe the color sync burst signal and give its purpose.
10. How does the colorplexed video signal indicate hue, saturation, and luminance of the picture information?
11. Why is the chrominance signal transmitted with the subcarrier suppressed?
12. Why is the color subcarrier frequency made exactly 3.579545 MHz?
13. A scene displays a wide yellow vertical bar against a black background. How will this picture appear in a monochrome reproduction?
14. What is the effect of the chrominance signal in a monochrome receiver with video-frequency response up to 3.2 MHz?
Problems
(Answers to selected problems at back of guide)
1. Show the calculations for Y luminance values of blue, red, green, yellow, and white.
2. Prove that if G - Y is [-0.51(R - Y) - 0.19(B - Y)], then this equals -0.30R + 0.41G - 0.11B, by substituting the R, G, and B values for Y.
3. (a) Calculate the value of C voltage when I = 0.4 and 0 = 0.3. (b) What is the approximate hue of this color?
4. A signal voltage varies between the peak of 0.79 V and minimum of 0.11 V. Calculate (a) peak-to-peak value and (b) average level.