The first five sections described how to select the exact oscilloscope functions you need to make the measurements you want. Now you can put what you’ve learned into practice with this section of the primer.
AMAZON multi-meters discounts AMAZON oscilloscope discounts
It begins with a review of waveform shapes and characteristics in Section 6 (below). Then the discussions in Section 7 start with safety because you should always observe safety precautions when working on electrical equipment.
The first step in ensuring accurate measurements is making sure your scope is set up properly, and this subject is discussed in Section 8. Section 9 discusses measurement techniques, beginning with fundamental time and amplitude measurements and ending with delayed sweep measurements.
The last section in the primer describes oscilloscope performance and how it affects your measurements.
Section 6. WAVEFORMS
The definition of a wave is “a disturbance traveling through a medium” while the definition of a waveform is “a graphic representation of a wave.”
Like a wave, a waveform is dependent on two things: movement and time. The ripple on the surface of a pond exists as a movement of water in time. The waveform on your scope’s screen is the movement of an electron beam during time.
The changes in the waveform with time form the waveshape, the most readily identifiable characteristic of a waveform. Figure 16 illustrates some common waveshapes.
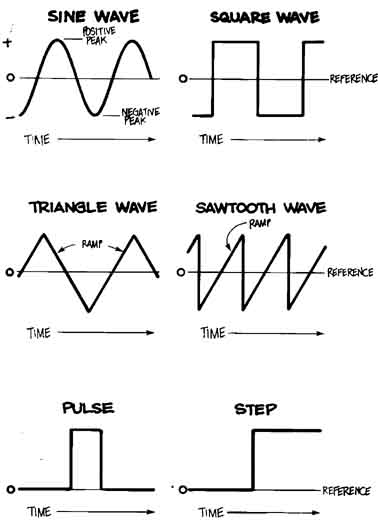
Figure 16. BASIC WAVESHAPES include sine waves, and various non-sinusoidal
waves such as triangle waves, square waves, and sawtooth waves. A square
wave has equal amounts of time for its two states. Triangle and sawtooth
waves are usually the result of circuits de signed to control voltage
with respect to time, like the sweep of an oscilloscope and some television
Circuits. In these waveforms, one (or both) transitions from state to state
are made with a steady variation at a constant rate, a ramp. (Changes from
one state to another on all waveforms except sine waves are called transitions.)
The last two drawings represent aperiodic, single-shot waveforms. The first
is a pulse; all pulses are marked by a rise, a finite duration, and a
decay. The second one is a step, which is actually a single transition.
Waveshapes tell you a great deal about the signal. Anytime you see a change in the vertical dimension of a signal, you know that this amplitude change rep resents a change in voltage. Anytime there’s a flat horizontal line, there was no change for that length of time. Straight diagonal lines mean a linear change, equal rise (or fall) of voltage for equal amounts of time. Sharp angles on a waveform mean a sudden change. But waveshapes alone are not the whole story. When you want to completely describe a waveform, you’ll want to find the parameters of that particular waveform. Depending on the signal, these parameters might be amplitude, period, frequency, width, rise time, or phase. You can review these signal parameters with Figures 17 through 22.
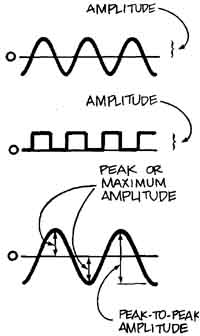
Figure 17. AMPLITUDE IS A CHARACTERISTIC OF ALL WAVEFORMS. It is the amount
of displacement from equilibrium at a particular point in time Note that
without a modifier, the word means the maximum change from a reference without
regard to the direction of the change. In the first two drawings above (sine
wave and square wave), the amplitude is the same even though the sine wave
is larger from peak to peak. In the third drawing, an alternating current
waveform is shown with peak (or maximum) amplitude and peak-to-peak amplitude
parameters annotated. In oscilloscope measurements, amplitude usually means
peak- to-peak amplitude.
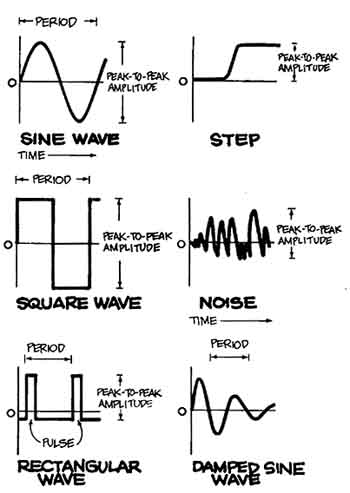
Figure 18. PERIOD IS THE TIME REQUIRED FOR ONE CYCLE OF A SIGNAL if the
signal repeats itself. Period is a parameter whether the signal is symmetrically
shaped like the sine and square waves above or whether it has a more complex and asymmetrical shape like the rectangular wave and damped sine wave. Period
is always expressed in units of time. Naturally, one-time signals like
the step or uncorrelated signals (without a time relation) like noise have
no period.
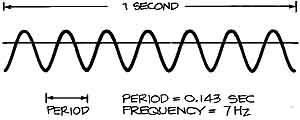
Figure 19. IF A SIGNAL IS PERIODIC, IT HAS A FREQUENCY. Frequency is the
number of times a signal repeats itself in a second; frequency is measured
in Hertz: 1 Hz = 1 cycle per second; 1 kHz (kilohertz) = 1000 cycles/second; and 1 MHz (megahertz) = 1,000,000 cycles/second Period and frequency are
reciprocal: 1/period = frequency, and 1/frequency = period. For example,
a 7 Hz signal has a period of 0.143 seconds: 1/7 Hz = 0.143 a, and 1/0.143
s 7 Hz.
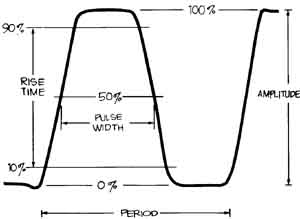
Figure 20. THE PARAMETERS OF A PULSE can be important in a number of different
applications. Digital circuitry, X-ray equipment, and data communications
are examples. Pulse specifications include transition times measured
on the leading edge of a positive-going transition; this is the rise time.
Fall time is the transition time on a negative-going trailing edge. Pulse
width is measured at the 50% points and amplitude from 0 to 100%. Any
displacement from 0 volts for the base of the pulse is the baseline offset.
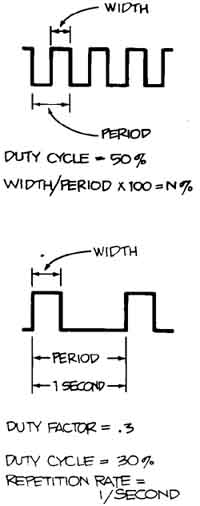
Figure 21. DUTY CYCLE, DUTY FACTOR, AND REPETITION RATE are parameters of
all rectangular waves. They are particularly important in digital circuitry.
Duty cycle is the ratio of pulse width to signal period expressed as a percentage.
For square waves, it’s always 50% as you can see; for the pulse wave in the
second drawing, it’s 30%. Duty factor is the same thing as duty cycle except it's ex pressed as a decimal, not a percentage. A repetition rate describes
how often a pulse train occurs and is used instead of frequency to describe
waveforms like that in the second drawing.
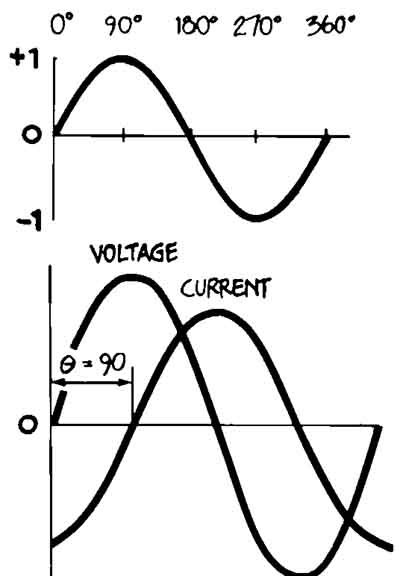
Figure 22. PHASE is best explained with a sine wave. Remember that this
waveform is based on the sine of all the angles from 0 through 360. The result
is a plot that changes from 0 to 0°, 1 at 90°, 0 again at 180°, -1 at 270°, and finally 0 again at 360°. Consequently, it's useful to refer to the
phase angle (or simply phase, when there is no ambiguity) of a sine wave when
you want to describe how much of the period has elapsed. Another use of
phase is found when you want to describe a relationship between two signals.
Picture two clocks with their second hands sweeping the dial every 60 seconds.
If the second hands touch the twelve at the same time, the clocks are in
phase; if they don’t, then they’re out of phase. To express how far out of
phase they are, you use phase shift in degrees. To illustrate, the waveform
labeled CURRENT in the drawing above is said to be 90° out of phase with the
voltage waveform. Other ways of reporting the same information are “the current
waveform has a 90 degree phase angle with respect to the voltage waveform”
or “the current waveform lags the voltage waveform by 90°.” Note that there
is al ways a reference to another waveform; in this case, between the voltage and current waveforms of an inductor.