AMAZON multi-meters discounts AMAZON oscilloscope discounts
Auditing of Process Control Systems
Part of the auditor's function is to look at the existing control system-how it's installed, operated, and maintained and how new devices are implemented. This is done to ensure compliance with good engineering practice, corporate requirements, and local bylaws in effect at the plant. Many sections in this guide provide a good source of information to the different items to be checked by the auditor.
AMAZON multi-meters discounts AMAZON oscilloscope discounts
Evaluation of Plant Needs
The purpose of evaluating plant needs is similar to an audit (i.e., to ensure optimum plant operation and to maintain a path of continuous improvement).
This evaluation goes typically through three steps. They are
• to conduct a brainstorming session to bring out the ideas and plant needs,
• to evaluate the ideas developed in the brainstorming session and decide which are acceptable and which are not, and
• to issue a report confirming those needs and the cost to the plant.
The Brainstorming Session
The purpose of this session is to have a team of key personnel bring out the ideas, the problems, and the needs of the plant without hindrance or preconceived notions. The session team should have a coordinator.
In most cases, the team consists of representatives from different plant groups, such as management, engineering, production, marketing, maintenance, and operations. In general, a total of five to seven attendees is a good size. If the number reaches 10, communication problems start developing and a few attendees tend to take over the session while the rest of the group remain silent. Less than four may mean that some plant groups are not represented and their views are not being heard. The team at all times is guided by the coordinator, who, once the evaluation is completed, will probably be performing the justification analysis as well. The team as a whole should have an excellent understanding of the overall facility and its business needs.
It is recommended that the team include the manager (or his or her representative), who will eventually approve the funding. The manager's commitment is essential. Without it, the entire process could eventually fail due to lack of support and understanding.
In general, the coordinator may come from one of three sources:
1. From within the plant. This approach is the least recommended because it is difficult for such an individual to maintain impartiality.
2. From another plant (or office) belonging to the same organization. This is a better approach because it satisfies the impartiality requirement and if the team already knows the coordinator, the personal introductory part can be skipped.
3. From an outside firm specializing in control system evaluation. This approach allows the coordinator function to be performed with a minimum of interference to plant personnel and at the same time ensures impartiality and experienced performance. In addition, in many cases, an outsider can keep the brainstorming session under better control without having to worry about internal politics and egos.
The coordinator needs to be self-disciplined and must keep the brainstorming under control at all times. Yet, he or she must be tactful, keep the enthusiasm going, keep everybody involved, keep the session on track, and prevent any single individual or small group from taking over the meeting.
The coordinator has a key role in the success of the brainstorming session and must have the confidence of the team. He or she should get to know each of the team members, preferably on a one-to-one basis, and should listen to their individual needs before the meeting starts. In addition, the coordinator should never take sides and must remain impartial at all times.
The coordinator must always remember that he or she is only a facilitator and that the responsibility for the ideas and the needs rests with the team involved in the session. The responsibility of the coordinator is to help the plant solve its problems. The coordinator may table ideas and plant seeds for discussion, but the team has the final say.
The brainstorming session begins with the coordinator's explanation of the purpose and benefits of the meeting. From the meeting, a list of needs will emerge, and they will form the basis for system selection and justification.
Once the overview of the different steps is explained to and understood by the team, the coordinator must clearly define the concept and rules for the upcoming brainstorming session. The rules are generally
1. During a brainstorming session, criticism and the evaluation of ideas are not allowed and all ideas are recorded.
2. Following the brainstorming session, all ideas are looked at individually, and evaluated.
During the evaluation, each idea will be given GO or NO-GO status (some may require further investigation; however, they should be kept to a minimum).
In some cases, depending on the experience and knowledge of the team involved, the brain storming session can be broken into two parts: a preliminary segment to start everyone thinking, and a second segment in which the attendees come prepared with ideas and financial values for their problems (e.g., solving the emission problem we now have will save us $x).
As a starting point and to get the juices flowing, the coordinator may table some of the concerns, problems, and needs he or she heard about from previous discussions with key personnel. The coordinator must use a flip chart so that everybody can see the ideas that are being tabled. The group must learn, through the efforts of the coordinator, to quickly operate as a team.
In the brainstorming session, the team should avoid finding a solution (e.g., we need to buy equipment ABC); this will come later. The team should identify the problems and the cost of the problems at present. The coordinator must always watch for this finding-solution trap; it is a temptation that must be resisted.
If talks about the high cost of implementing this or that idea come up, the coordinator should restate the purpose of the meeting and remind the team "Ideas and needs only, please." The justification is the next stage.
A few hints for the coordinator:
• avoid Monday a.m. and Friday p.m. meetings,
• do not impose views- resist the temptation,
• keep the meeting rolling; keep the ideas flowing; watch for and steer away from inter departmental finger-pointing and blaming,
• avoid team fatigue; take breaks when needed; do not extend the session beyond its limit (when it's finished, it's finished),
• avoid the following in the brainstorming session (the coordinator can actually write these rules on the first flip chart paper and then pin it on the wall):
1 Do not ignore ideas.
2 Do not criticize ideas.
3 Do not change an idea into a totally different one.
4 Do not evaluate ideas.
At the end of the brainstorming session, the coordinator will thank the team for their efforts.
By now, the walls of the meeting room are probably covered with sheets from the flip chart, with all the ideas listed as they were being generated by the team and recorded by the coordinator.
The Evaluation of Ideas
Now is the time to evaluate the ideas and decide as a team which of the ideas should be considered GO and which are NO-GO. The coordinator must remain diplomatic and tactful. He or she should give no personal ideas and opinions. The coordinator can ask clarifying questions that help the team look at ideas from a different perspective.
The evaluation of ideas starts with the team reviewing each one and rejecting the ones that are not feasible for technical or financial reasons. Those are the NO-GOs. The marking of GO or NO-GO is done right on the charts (by now all over the walls). If action needs to be taken after the meeting, the coordinator must follow up and make sure that target dates are met (otherwise they may die of neglect). Such actions could be, for example, to obtain the present values for a malfunction (and confirm the values obtained from the brain storming session), or to obtain the total of environmental fines the plant has received. Such actions, in most cases, must be completed before the issuance of the report, hence the need for immediate action.
It is a good idea to have the allocation of dollars done by all the members of the team at the meeting. This is really a continuation of the evaluation of ideas. The allocated values must be factual; guessing should be kept to a minimum (and preferably should be avoided). In some cases, the coordinator may need to list the source next to each value. This action by the coordinator depends on the seniority of the team and the reliability of the data being presented.
Issuance of the Report
Once the evaluation of ideas is completed, a report should be issued to confirm the work done so far and list the findings of the team.
The report goes through three stages (see FIG. 3). The first is the preliminary report, which is circulated to the members of the team for their comments. In most cases, comments received tend to clarify the needs that have been listed in the brainstorming session. The last stage is the final report, which should be prepared within a month of the preliminary report.
The final report is distributed to the members of the team and to the plant manager. It is recommended that the distribution list be agreed upon at the beginning of this exercise.
=======
FIG. 3 Issuing the report.
Prepare Preliminary Report
Issue Report for Comments
Issue Final Report
=======
A typical report consists of two main sections: (1) the purpose and scope of the evaluation, and (2) the findings. The first part describes the reasons for the evaluation and the different parts of the plant that were reviewed. This first part should include a note of recognition from the coordinator to the team for their efforts. The second part describes the findings of the team and the value of these findings. There are different opinions regarding the inclusion of the NO-GO points, but in some cases, these are needed to avoid discussing them in the future. Some companies require only the GO results to act on. The choice depends on the requirements of the plant as described to the coordinator at the start of these activities. An example of a report is shown as FIG. 4 with only the GOs present.
With the completion of the report, the person responsible now has a list of key features that will be required of the potential new control system. In FIG. 4, they are the effluent problem, the data collection needs, and the limited capabilities of the existing control system.
Justification
Justification and payback problems arise because of the difficulties in measuring and quantifying the real economic benefits-and, therefore, in calculating payback. Management wonders:
Is it worth it? What is the payback on the investment? Is the risk worth taking? They know that without risk nothing is achieved and that a calculated risk is better than a leap of faith.
Many managers are willing to lead their organizations into market and technology leadership but are reluctant to pay the required price. They need justification. A leap of faith could be suicidal, and, therefore, it is easy to understand their hesitation. A systematic, methodical technique of justification is needed.
Without sound justification, real progress is difficult to measure. Accountants are poor engineers (what cannot be justified has a value of 0), and engineers are poor accountants (they find it almost impossible to generate those badly needed numbers for justification). Justification attempts to bring management, accountants, and engineers' points of view closer to each other.
Quiet often, when it comes to control systems, decision makers are split into two groups:
believers and non-believers (see FIG. 5). On the believers' side, justifying is generally not needed. Modern control systems are a way of existence (the only way). Some are convinced of unrealistic savings that generally cannot be achieved, which adds fuel to the fire of the non believers. See Section 9 for more information on computer-based control systems.
======
FIG. 4 Simplified sample report.
EVALUATION of PLANT NEEDS ABC Inc.
Meeting held on: September 10, 2006, in the plant's main conference room.
Attendees: J. Smith, J. Doe, S. Green, P. White, and A. Black
1) Purpose and Scope of Evaluation The purpose of this evaluation was to identify the needs of the plant and the areas of improvement and to evaluate the present cost of these weaknesses. The evaluation was conducted by N. Battikha, an independent process control system evaluator. The following plant areas were reviewed: A4, A13, and A27. The values shown in this report are annual costs based on last year's data.
The coordinator wishes to acknowledge the efforts of the attendees at this meeting; their contributions were key to its results.
2) Findings
1. Present effluent problems of the plant (see attached memo 3257.2 by J. Doe)
1.1 Yearly fines (these values will probably increase over the next year due to new upcoming legislation) ............ $30K 1.2 A bad public image in the nearby community (it is estimated that at a minimum this represents an annual loss in sales and increased PR expenses) .......... $10K
Total = $40K
2. Present data logging and data collection functions 2.1 Two man-months per year are spent manually collecting data from different monitoring devices.
The data must then be massaged to obtain useful info (e.g., plant efficiency, material balance, energy balance, etc.) ................. $10K 2.2 Errors in copying (from searching through old data from online recorders and reconstituting the data as it should have been recorded), conservatively evaluated at one man-month per year ............... $5K
Total = $15K
3. The present control system is limited in capabilities. When problems occur, the operator takes control of the process, but this is after the fact.
3.1 Problems of this nature result in scrap material and disposal costs. (We expect this cost to increase next year, when our neighbor Scrap, Inc., shuts down, which means finding new outlets for our scrap; there are none in this region of the country.) ....... $50K 3.2 We are now using the lab to try to ascertain potential problems in advance (i.e., increase in lab workload) .................. $30K 3.3
These problems tend to be frustrating to the operators. (They spend a lot of time talking about it, with no results because the present control system is really pushed to its limits.) .......... $20K
Total = $100K
========
On the non-believers' side, engineering judgments are only guesses. Non-believers usually have little experience with modern control systems (or perhaps they've had a bad experience) and need proof. They know that many vendors avoid guarantees of performance (obviously a difficult task, if not impossible, because vendors don't really know the conditions of the plant).
What the non-believers' side needs is a justification in black and white and a bottom line that shows if the investment is worth it. The purpose of this Section is to change the concepts of belief and faith into facts and justification, thus bringing the two sides together with the help of the logical and factual decision-making process.
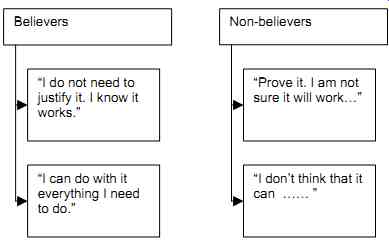
FIG. 5 The believers and non-believers of modern control systems.
Hurdles in the Justification Process
When the need for a justification emerges and is recognized, there will be, in many cases, hurdles to be surmounted. Some of them can be handled easily, but others will be difficult but not impossible to overcome (with much tact and dedication).
Such problems can be roughly divided into two classifications
1. Management hurdles, such as no commitment, unwillingness to make decisions, no (or an unclear) strategy in existence, or bad communication between departments
2. Personnel hurdles, such as no champion, a shortage of expertise (and lack of knowledge), poorly understood problems and benefits, and strong resistance to change There are no quick solutions to these problems. However, an essential starting point is commitment from management. Without it, the whole justification process could be a waste of time.
Another aid in overcoming these hurdles is keeping a vision of the future and the benefits of modern control systems in mind, and involving as many individuals as possible. In other words, it should become a common cause and a common vision.
Cost Justification
There are two steps in the cost justification process.
1. Totalize all the costs. Costs are not limited to the cost of the control system only. They include engineering, installation, training, and so on. A breakdown is shown below to pro vide a starting point. Each case will obviously have to be looked at individually to develop its own list of items.
2. Justify the costs. Following totalization of costs, calculations using either the payback method or the return-on-investment (ROI) method will be used. These two methods are the most current and the easiest to understand. Some plants may have different methods of calculating justification, but all require the value of the benefits and the total cost.
Costs - The Bottom Line
The overall cost includes two parts: (1) the initial cost of equipment, engineering, installation, and operation, and (2) maintenance costs (see FIG. 6). The initial cost is a one-shot expense, but the second is an ongoing expense. The amount of the maintenance cost can vary from year to year, depending on additional plant needs, changes in maintenance manpower, system and component age, and reliability of the control system equipment.
========
FIG. 6 Overall costs for modern control systems.
1. INITIAL COSTS (a one-time expense)
• control system (hardware and software), control room,
• engineering,
• installation,
• training, and
• miscellaneous (travel costs, start-up).
2. MAINTENANCE COSTS (ongoing)
• repairs
• system upgrades,
• training, and
• personnel.
=========
1) Initial Costs
The first major cost is the control system itself, which could be considered a lot price (e.g., a DCS) or the total of the prices of different components (e.g., PLCs, PCs, PLC programming software, PC application software, and communication highways). For the purpose of this Section, the control system will be broken down into two parts: hardware and software.
The hardware cost includes the CPU, memory, disk drives, input/output (I/O) modules, power supplies, I/O racks, communication modules, CRTs, printers, desks, consoles, and uninterrupted power supplies -if required.
The software cost includes operating system software, programming and documentation soft ware, operator interface software, software for communications between the different devices, troubleshooting and diagnostic software (if not built into the control system), and any custom software to meet specific plant requirements.
In the case of software costs, estimating the time required to develop custom software, if it is required, is a tricky exercise. Extreme care is required in estimating, even for the development of PLC programs and operator interface applications, which are relatively easy. Beyond such simple applications, software development time tends to be longer than expected, first in development and then in debugging. The author uses the "custom software factor of 2". This means "take the final estimate received, multiply it by 2, and you have an idea of how much time it will really take." Another not-always-necessary cost item is control rooms (depending on the facility). For further details on this item, refer to Section 11.
Engineering costs vary depending on the scope of the work and the type of control system.
This cost, which is a major portion of the total cost, includes project engineering, engineering contractors, programming, system checks, preparation of manuals, and commissioning and start-up assistance. The cost of checking the system before installation, and preferably at the vendor's facility, is of prime importance and includes simulating all I/Os. No one wants to discover defective I/Os or incorrect programming at commissioning time.
Installation is a major cost that generally involves the plant, vendor(s), engineering contractor (if one is used on the project), and the installing contractor. Installation costs (see Section 15) cover moving the control equipment to the plant and into the control room, the wiring of all I/Os, power supply, and grounding, and the testing of the complete installation to ensure its working condition.
Training cost must be allowed for. This cost will not be repeated when similar systems are added in the future, but it is an initial cost. Initial training is generally supplied by the vendor (note that sometimes training costs are included in the cost of the system by the vendor). In many cases, training also includes some basic troubleshooting skills.
If the control system must be installed on an operating process line, with the minimum down time, additional costs should be allowed for this "hot cutover." First, additional care must be taken in pre-testing; then items such as additional manpower and standby test equipment must be allocated. Even the best of hot cutovers have some form of lost time during the transition.
Travel costs for training, consultants, checkouts at the vendor facility, and so on will vary depending on locations and the complexity of the control system. These must be included. The better the quality of work done upfront, the lower the start-up costs will be and the lower the final cost will be.
2) Maintenance Costs
Control systems, like any other piece of equipment, will fail sooner or later, regardless of how reliable the equipment is-hence, the need for maintenance and its related costs (see Section 16). Items purchased as components to create a control system come with their own individual warranties. If the control system was purchased as a complete system from one vendor, maintenance is generally more straightforward and easier for the user to understand. In addition, the supplier of a control system should have the resources to service the whole system at the plant if the need arises.
Once the warranty period is over (three months to one year, depending on the equipment), maintenance agreements are available from system vendors (or third-party service companies).
A decision to purchase maintenance or have an in-house maintenance person(s) depends on the size and complexity of the system, as well as on the capabilities of plant personnel.
Updates should also be included in costs. Once the operators become familiar and comfortable with the control system, they start asking for more functionality. Management and plant engineering may start asking for system improvements. In many cases, all of these activities fall under maintenance, and they all cost money.
As maintenance and engineering personnel change, and as the control system gets updated, additional training may be required. Generally, this cost is minor compared with the other maintenance costs.
Maintenance personnel, including supervisors, and overhead must also be included in maintenance costs. In most cases, the cost of maintenance personnel for control systems is less than for conventional systems because of the reliability of the equipment and its self-diagnostic features.
Cost Justification
Two sources of information are needed to complete the cost-justification process:
• the calculated benefits from the evaluation of plant needs, and
• the calculated total costs.
Since payback and ROI are used by most firms and they are relatively easy to understand, they are used in this Section. In either method, the time value of money has been ignored to simplify the calculations.
For example, say the calculated benefits of an alternative solution gave a value of $97K per year (see TABLE 1). This alternative is a new control system, with an initial cost of $180K, which includes hardware, software, engineering, and so on, as listed in the previous section.
The average annual operating and maintenance cost of $5K includes the maintenance contract, updates to the system, training, etc., as listed in the previous section.
At the first stages of implementation, when the system is acquired and installed, the cost of $180K has not yet reaped any benefits, and therefore, there is a negative cash flow of $180K.
In the following year (year 1), the annual benefits of $97K required an annual maintenance cost of $5K, giving an annual cash flow of $92K. The annual net cash flow is the difference between the annual benefit and the annual cost. In this example, we'll assume that the annual benefits of $97K will repeat every following year.
The resulting average annual estimated benefits, costs, and resulting cash flows are shown in FIG. 7.
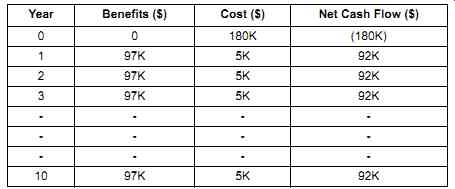
FIG. 7 Benefits, costs, and cash flow.
Calculation Using the Payback Method
The payback method works as follows: The annual net cash flow is added year after year until the value of the original investment is reached; the number of years required to achieve this balance is known as the payback time. The lower the number, the faster the payback on the investment. Obviously, the higher the benefits and the lower the cost, the shorter the payback period will be.
We use the ongoing example and add the net cash flow until we reach $180K (i.e., 180K / 92K = 1.95). So the payback time equals around two years. In other words, it takes about two years to recoup the original investment.
Calculation Using the ROI Method
The ROI method works as follows: an estimated usable life is set (in the example, it will be set at 10 years). From the original cost, an annual depreciation is calculated (by dividing the original cost by the number of years-the usable life. The average annual benefit of the investment is calculated by adding the net cash flows of the 10 years and averaging them. And the ROI is calculated by dividing the average net cash flow by the original cost.
Using the ongoing example, and based on 10 years of usable life, the annual depreciation = 180K/10 = 18K.
The average annual benefit of the investment = 92K Using depreciation, the ROI = (92K - 18K ) / 180K = 41%.
If this calculation is performed without depreciation, the ROI = 92K / 180K = 51% Calculation Results
Obviously, as the annual benefit increases, the payback will take less time and the ROI increases. With this information in hand, plant personnel now know
• the benefits to be obtained from the potential control system,
• the required features of the potential system,
• the total implementation cost; and
• the return on investment.
The original question, "Is it worth it?," can now be answered.
Justification Follow-up
Now that the justification is complete, the system has been purchased and installed, and it is operating, the question arises: "Does the installed system actually provide the benefits that were listed (and valued) in the justification?" A justification follow-up is often required, particularly in cases where a system upgrade is done on a small scale (i.e., one section at a time) and management needs to know if they should proceed with the upgrade of the whole plant. This is a feedback activity to the investment and is not easy. The main difficulty lies in the assembly of data (i.e., the collection of information from before and after implementation).
The collection of information is guided mainly by the list of benefits in the justification analysis. It is quite common to discover benefits that were not on the original list and drawbacks that were never thought of.
On control systems that are replacing old ones, justification follow-up requires two sources of information: first, information to be collected before the implementation (generally taken from the justification analysis); and second, information to be collected after the implementation (confirming or changing the estimated benefits listed in the justification analysis). In most cases, there will be a difference between the values reached before implementation and those obtained after implementation as a result of the follow-up because the forecasted benefits cannot predict exactly the final benefits. If the original evaluation of plant needs was on the conservative side, the final benefits generally tend to be on the positive side. However, the closer the evaluation and estimated costs are to reality, the smaller the gap between the two values.
With control systems that are being incorporated in a new plant, the benefits attained need to be compared with the original requirements generally outlined in a control philosophy document and justification analysis.
The justification follow-up not only examines the items listed in the justification analysis and the control philosophy document, but it must also investigate operator and maintenance training, quality of support documentation, handling/security of software, and so forth. In other words, the follow-up becomes a control system audit, focusing only on the system in question.
Control system auditing was covered in detail in the first part of this Section.
System Evaluation
The exercise of systematically assessing different alternatives (or choices) is known as decision making. In the field of process instrumentation and controls, this is commonly used when evaluating different potential control systems and comparing them to a plant requirement or to an existing system. It should be noted at this point that this tool can also be used for any decision making process requiring a quantified and systematic approach (e.g., buying a car when faced with so many available models). The approach used in this guide is a quantified method that gives the decision maker a tool for selecting the best option. This approach also acts as a record as to why a decision was taken and why a certain result was obtained.
Quantified decision making consists of a table where the requirements are shown in rows and the available options in groups of columns. The following simple step-by-step example describes how this method of decision analysis works (see TABLE 1).
First, the requirements of the plants are classified into two types (i.e., two sets of rows):
A The Primary Requirements (i.e., the essential requirements of the plant). These generally include safety, environmental concerns, codes and regulations, and disaster prevention needs. They are typically identified in the plant control philosophy and are essential for any system in the plant. A control system that does not provide for these requirements should be immediately rejected. In the case of Primary Requirements, if the control system meets the plant needs, it rates a GO; otherwise, it's a NO-GO and the system is rejected.
B The Secondary Requirements (i.e., the wish list requirements). These have a value to the plant. They cover most of the production requirements and include quality, information reporting, process protection, etc. They define which control system alternatives (that have successfully passed the Primary Requirements) will be evaluated based on their relative benefits. A control system that does not provide these features 100% is not rejected; instead, its features are weighed. All Secondary Requirements are given a relative weight of 0 to 100%. The 0 to 100% weight reflects the relative compliance of the alternatives with respect to the plant needs. A 0% means a full non compliance; a 100% indicates that the alternative offered meets plant needs fully.
In the simple cases where a bidder has specifically complied or has not, the decision is easy to make. However, in most cases, the offered computer-based control system may be close but not 100% compliant. For example, one system (as offered by a vendor at a very attractive price) may have the ability to display only 100 points per graphic page, whereas the plant requirements specified 140 points per page. Now it must be determined how close the offered system is to the original requirements and what its value is to the plant. In other words, if, as a result of the evaluation of the plant needs, the above example of 140 points has a value of $10K and the control system offered only has 100 points, the plant may decide that this non compliance reduces the value of this benefit by 50%, making the $10K benefit a $5K benefit.
For the purpose of this example, the Secondary Requirements to be used are the benefits identified earlier in this Section (see FIG. 4). In real-life situations, the list of benefits is generally much longer than the one generated for the purpose of this example.
At this stage of the evaluation process, the decision analysis can also be used to compare the functionality of different types of control systems. For example, if a DCS vendor and a PLC/ PC vendor are bidding on the job, the decision analysis that follows can help direct the decision to be taken based on the benefits achieved from each system.
The table (see TABLE 1) is then divided vertically into a series of columns that are grouped into:
1. Plant Needs. This is what the plant requires based on the previous audits and the evaluation of plant needs (see FIG. 4), as reflected in the system specification that was sent to the vendors for bidding.
2. A number of groups of columns representing the existing control system, followed by all the available alternatives (i.e., the available choices from all the bids and systems offered by vendors). In this example, two alternatives are shown, but often, three and even four alternatives would be shown.
The data available in this table will allow a comparison between the Plant Requirements and each of the existing analog system and the two control system alternatives (1 and 2).
The first step is to complete the left-hand column for the Primary Requirements. In our example, the three Primary Requirements shown were part of the functional specification to the bidders and are essential to the plant. The existing system and the three alternatives are entered, and the GO/NO-GO column is completed to immediately rule out noncompliant systems. In our example, all alternatives are compliant. If, however, one of the alternatives is not compliant, it would be rejected from the evaluation.
Following this, the first column of the Secondary Requirements is completed. This is done by entering the information and annual values [V] that were obtained from the evaluation of plant needs (see FIG. 4). It is obvious that the Decision Analysis Table cannot include all the requirements from the functional specification that was submitted to the vendors. It should include only the key items with which the alternatives are not in complete compliance. In some cases, instead of one value [V], two or three may emerge, as when the team during the plant needs evaluation cannot agree on a number. Therefore, two numbers may emerge as high and low, or sometimes three numbers may emerge: a minimum (pessimistic), a mid-point (most likely), and a maximum (optimistic). In such cases, two- or three-value analyses could be done, one for each set of values, or the averages of two (or three) could be combined into one aver age value.
The information section in each of the second, third, and fourth columns is a reference and a reminder. It records key points and summarizes discussions and facts.
Following the Information column, weights (0 to 100%) are applied to the individual Secondary Requirements of the existing system and each alternative (W0, W1, and W2). This shows the relative closeness or compliance of the individual Secondary Requirements to the plant needs.
Multiplying the value [V] by each weight (for each alternative) results in a weighted $ value (A0, A1, and A2), the purpose of which is to provide a comparative evaluation between the alternatives with respect to the plant requirements and needs.
For example, on the first Secondary Requirement, the existing system has a real value to the plant of only $40K x 0 = $0K. Alternative 1, because it complies with 80% of the requirements, has a value of $40K x 0.8 = $32K. Each alternative is now totaled A0 = $40K, A1 = $72K, A2 = $137K. This represents the "real" value of a particular control system to the plant.
Finally the annual benefit of each of the alternatives in relation to the existing system must be evaluated. This is done by subtracting the weighted value of the existing system from the weighted value of each alternative:
A1 - A0 = $32K, and A2 - A0 = $97K.
The result of the decision analysis shows that Alternative 2 has the highest annual benefit, which makes it the logical choice.
TABLE 1 Decision analysis. [coming soon]