DEFECTS IN AMPLIFIER PERFORMANCE
SUBJECTIVE TESTS on the amount of distortion that is audible appear to show two things: (1) that improved equipment and practiced listening have enabled us, both collectively and individually, to detect smaller degrees of distortion; and (2) that the amount registered varies widely between […] the types of distortion present.
In the early days, before the advantages of push-pull operation were discovered and long before the advent of feedback to “solve all our troubles, ” the minimum detectable harmonic distortion was settled on as 5 percent. More recent tests along the same lines have shown that two thirds of the subjects could detect 5 percent harmonic distortion, while one-third of them could detect 1 percent. Because intermodulation (IM) distortion produces some inharmonic additions to the program, it was found that this kind, produced when more than one input freq. is used, is responsible for more of the distortion noticed in actual performance.
But some puzzling facts remain. All forms of distortion in amplifiers, measured according to conventional methods, are either so far below the minimum audible distortion level or are so far below distortion of the same kind produced by other links in the chain-the pickup, loudspeaker or even the human ear itself -that it should no longer be possible to hear any difference between the performance of any good modern amplifiers. Certainly none of them should produce any audible component of distortion. The fact remains that some good amplifiers are observed to 'sound cleaner' in some way than others.
A closer examination reveals certain trends that have been followed long enough, and it is time to change our direction in amplifier development. In the days when a “good ” audio amplifier produced around 5 percent harmonic distortion and a frequency response within 3dB from 100Hz to 5kHz, improvement in these was audible. Hum probably showed room for improvement, too. But work has gone on until fabulous figures of performance have been achieved-distortion in the region of 0.1 percent (and some even lower) and frequency response from a fraction of a cycle up to the region of a megacycle within 0.1dB or so. By the figures, such amplifiers should rate as audibly perfect.
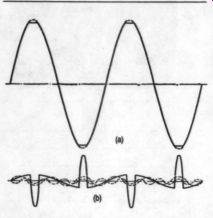
FIGURE 1: Harmonic relationship in a clipped wave. Figure 1a is an example
of a clipped output waveform. Figure 1b is the distortion component of (a)
to ten times scale with the dashed lines indicating the first two terms
of the series analysis.
This trend seems to have been followed because of a belief that a better specification in these regards must mean the amplifier performs better. Even when some knowledge able people realized this was not true anymore, because of the standard generally achieved, the trend persisted because promotion had made the market-or at least sections of it -- ”specification conscious.” Some, of course, have discovered for them selves that the audible performance does not appear to be related to the figures on the specification and have concluded that “specifications are valueless-the only reliable test is to listen to it.” As a result, for a few years now, progressive amplifier designers have been faced with an anomaly: the need to design an amplifier that works well and also gives a good specification.
Such an amplifier would read lower than--necessary figures for the distortion and frequency response deviation, and at the same time sell to the people who judge by listening to it.
While a sudden change in presentation can hardly be expected, it would be good to find a way of getting the information published in specification form that is a little more closely related to how the amplifier sounds.
A couple of decades ago, degenerative feedback was hailed as the amplifier maker's “godsend ”--the more the better. So amplifiers have appeared with 20, 40, 60 and 80dB of negative feedback-and even with “infinite feedback. ” It is largely this feedback that has enabled such low figures in distortion and frequency response deviation to be achieved.
From the first crude attempts, using as much feedback as possible in a single loop over the whole amplifier, designers have learned to use it more skillfully in multiple loops so that its effect on performance can be better controlled.
Simple Overload Characteristic
Inevitably, one effect of feedback has been to change the overload characteristic of an amplifier. The older 'class A’ amplifiers, without feed back, first produced a waveform that became rounded and later reached a point where the wave became definitely clipped. The rated output may have been somewhere in the region where the wave was getting well rounded. Pushing twice the input in to the amplifier might overbias some stages and compress the signal a little, so the wave eventually clipped, but still not too badly.
With feedback in large quantities, however, the round form of distortion is “taken care of ”--virtually eliminated. What would have been 10 percent third harmonic (a very serious degree of rounding) is now reduced to less than 1 percent (or in some in stances less than 0.1 percent), so we have an amplifier that can be pushed so far with very little distortion. But then the clipping point is reached, and distortion starts to increase quite suddenly. Figure 1 shows the way distortion invariably starts in a modern feedback amplifier. This is not just third harmonic, but a whole range of harmonics reaching up into higher orders. This can be Fourier analyzed, but it is questionable whether the result of such a Fourier analysis gives a representative impression of the effect of the distortion.
As Fig. 1b shows, the distortion component really takes the form of a succession of alternately up--and down--going pulses, which can be analyzed into a Fourier series.
Whether it is analyzed into a Fourier series (with a wave analyzer, for ex ample) and an RMS value obtained, or whether its value is measured as a composite waveform with a meter that rectifies the waveform and measures its average rectified value (which is what harmonic distortion meters do), it seems doubtful that the resulting figure represents its audible effect.
If you listen to “static” hum, it sounds like a buzz rather than a product of 60Hz. If you feed more low frequency into a loudspeaker than it can handle so the diaphragm or voice coil hits its end-stops, you can hear the knocking as a separate entity from the fundamental frequency at which it is driven. The clipped waveform is a drive voltage (or current) with precisely the same kind of added distortion component. Therefore, it will also sound like knocking, as a separate entity from the fundamental frequency rather than as a series of spurious overtones for this frequency.
This being the case, it would seem more logical to compare the magnitude of the pulses with the magnitude of the fundamental. To see what this means, compared to the usual method of measurement, Fig. 2 shows the basic relationships. The waveform can be regarded as a sine wave in which the tips are ch off. The fraction chopped off is given the designation a. From the geometry developed in Fig. 2a, the following relationships are derived:
b=cos-1 1/(1+a)
c=sin
In Fig. 1b, where the fundamental is balanced out, the area of the tall narrow pulses must equal the long shallow areas that “balance” it. This is represented, for a quarter period of the fundamental, in the right-hand part of Fig 2a. For simplicity, two areas can be regarded as approximately one quadrant of a sine wave-the areas shaded in opposite 45-degree directions. There is an overlap area where the shading produces a crosshatching, and this is outside the waveform. Subtracting this from both sine-wave quadrants, the remaining parts represent the areas “under ” the wave above and below the reference line. So we derive this condition by equating the areas of the sine-wave quadrants when the areas under the wave must also be equal.
It may be argued that the up-going pulse is not a true sine-wave quadrant, but must be represented by a more complicated mathematical series. This is being very rigorous. We have assumed the distorted wave is a chopped-off sine wave. As it never will be exactly this (because the feed back used is always finite), we shall not be justified in trying to be more rigorous, and this assumption is very convenient.
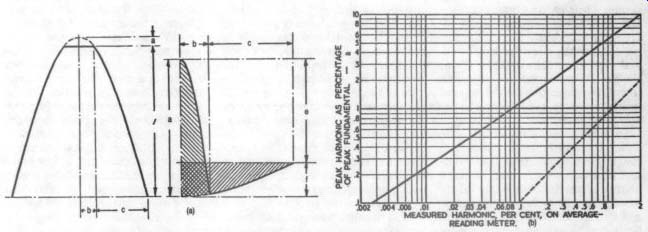
FIGURE 2: Analysis of peak average reading of clipping. Figure 2a is the geometry on which the curve is based. MEASURED HARMONIC, PERCENT, ON AVERAGE READING METER. (b)
Writing b+c= pi /2, we can produce whole shaded portions: up-going pulse has an area of 2ab/ x, while the a ink props […] sine wave is simply f. […] doing these areas, which 15 the condi. […]
The fundamental in a harmonic distortion meter, we have f=2ab/pi. As e+f=a, we can evaluate from the equation e=a(1-2b/pi).
From this we can evaluate the fundamental and the harmonic residue, as with a harmonic distortion meter […]
Notice that, for example, a reading of 0.1 percent distortion by conventional methods represents a relation ship between the fundamental and pulse magnitude of more than 1 per cent, or less than 40dB differential, which can be quite audible in certain frequency ranges, although most forms of harmonic distortion as low as 0.1 percent are definitely in audible.
Before leaving this section, we should answer the question of what effect use of a speaker load, in place of the academic resistance load, has. This varies with individual amplifiers to the kind of out put circuit and the way the feedback is distributed. In particular, if the out put tubes are pentodes (or beam tetrodes), operation into a load whose value runs higher than the nominal limits the grid drive at which clipping occurs. Usually the amount of negative feedback is correspondingly in creased by this change in loading impedance, so the grid drive is reduced, and clipping actually occurs at about the same output voltage (but much less power, of course) and also very nearly the same input voltage to the complete amplifier.
Output circuits employing triode tubes, or triode-operated tubes, can also accommodate higher-than-nominal load values-this is an inherent ability of triodes. But with values lower than the nominal impedance and voltage feedback, the distortion limitation is exaggerated. The only way to produce results paralleling the pentode compensation is to use current feedback, which raises the effect or yields a very low damping factor.
Sometimes this happens to be necessary, but it is unconventional.
These remarks about the effect of have no connection with other possible effects that reactive loading can have.
Low-Level Distortion
Feedback, of course, reduces the distortion at lower levels very successfully. A fact that gets overlooked, however, is that for each reduction in magnitude of distortion, there is a multiplication of the order of distortion. If the basic amplifier, without feedback, generates second and third harmonic distortion, the addition of feedback may reduce the second and third components, but it will introduce fourth, sixth and ninth components. These are, theoretically, of very small magnitude because the feedback works on them, too But if feedback is accomplished in separate loops, the effect can be multiplied. The shorter loop may produce only a relatively small reduc […] and ninth. Then the longer loop takes this and, as well as adding further fourth, sixth and ninth, due to the residue of original second and third, contributes a small quota of eighth, twelfth, sixteenth, eighteenth, twenty-fourth, thirty-sixth, fifty fourth and eighty-first. Let's not com plicate matters further by adding another loop! It is difficult to give a quantitative analysis of this part of the subject.
Admittedly, with ever-increasing feedback, the higher orders should be microscopic in magnitude. But there are many complicating factors. The frequency multiplication and diminution in magnitude will go on until a point is reached where the feedback swings its phase to accentuate instead of minimize, as it does in many amplifiers. Additionally, some amplifiers have forms of distortion peculiar to the high-frequency region, due to erratic phase relations causing internal nonlinear loading effects. This will further multiply these products by intermodulation among themselves.
The logical result of this process would be a sort of program-modulated, grid “noise ” com the reproduction a Harmonic or IM Measurement?
But isn't IM measurement more effective for indicating the apparent distortion? Figure 3 shows the kind of transfer characteristic on which most theory of the relationship be tween the two forms of distortion is based. Using this basis, mathematical relationships between the two forms have been deduced for various ratios of magnitude between the two test signals in the IM measurement, which are graphically illustrated here.
Measurement of harmonic distortion basically determines the deviation of the transfer characteristic from its mean straight-line value, as shown toward the left of this figure.
If the high frequency in the IM test signal has a small magnitude com pared to the low-frequency magnitude, it serves to indicate, by its modulation, the change in slope of the transfer characteristic throughout its length. A ratio in the region of 10:1 would probably be ideal from this consideration. Use of a smaller ratio (bigger high-frequency component) allows variations in slope over short distances to be swamped. In an extreme hypothetical example (not likely to be met in practice] IM distortion can be apparently zero, while there is considerable harmonic distortion (Fig. 4).
This somewhat imaginative hypothetical case uses a transfer characteristic in the form of a succession of waves so that the magnitude of the transfer characteristic waves is identical with that of the higher test frequency. This would result in the high frequency being unmodulated, giving zero IM reading. Of course, use of larger or smaller magnitude for the high-frequency signal would lose this hypothetical zero. Such a case is not likely to occur in practice, but it serves to illustrate the possibility that the more complex transfer characteristics can produce cases where the reading obtained will have maxima and minima according to the choice of relative magnitude of the higher frequency, and possibly also the value of the lower frequency, used for the test (because this often modifies the transfer characteristic).
Obviously, the relationship between harmonic and IM measurement cannot be simple, nor is it subject to mathematical computation with any degree of accuracy, as has been found by experiment.
With the particular combination of Fig. 4, it is obvious that the harmonic distortion would be far more annoying than the nonexistent IM. Intermodulation testing of waveforms whose principal deviation is due to clipping is invalidated in a way similar to the harmonic measurement treated more fully at the beginning. The distortion products shown qualitatively for an idealized measurement in Fig. 5 include a low frequency harmonic residue similar to that of Fig. 1, which does not get measured at all by this method, as well as the regular high-frequency modulation. It is doubtful whether any practical instrument could measure the waveforms as shown, (a) be cause the “nicks ” in the modulated high-frequency waveform may be only one or two half-waves of the high frequency in duration, and hence the clipping may not be accurately sampled by the high-frequency wave; and (b) because the filter to remove the high frequency to obtain a modulation reading will also remove most of the “notch ” amplitude. In this case, probably the harmonic meter will give nearest to the theoretical reading expected of it.
So far, we have only shown possible reasons invalidating the existing measurement techniques for the types of signal they are set up to measure. Other things happen in amplifiers that are probably more important from the viewpoint of audible interference with the program.
Transformer Distortion
Low-frequency distortion is one of these. Modern feedback amps have a very low source resistance (high damping factor). As well as enabling the amplifier to damp the loudspeaker better, this enables it to “smother ” the magnetizing current distortion in the output transformer, too. Satisfactory power output characteristics can be (and are) obtained with output transformers that run well into the saturation region because the feed back provides adequate regulation to deliver the magnetizing current without distorting the voltage.
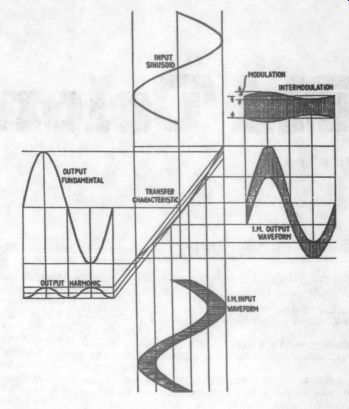
FIGURE 3: Conventional transfer characteristic yielding higher IM than the harmonic reading.
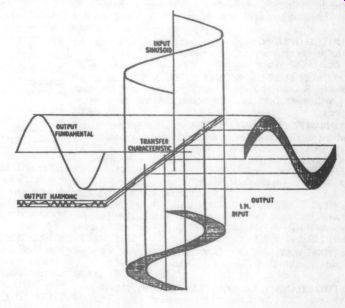
FIGURE 4: Unusual transfer characteristic yielding a zero IM with considerable harmonic distortion.
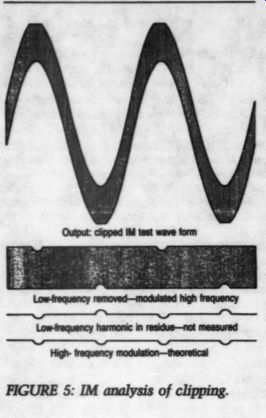
Fig. 5
If the load is a resistance, as it usually is for test, the magnetizing
[...]
combination that “fits in ” with lit tle current-swing increase (Fig. 6, lower left).
When the load takes the form of an inductive impedance equivalent to the nominal load resistance in series with an inductance, the magnetizing current can produce a much exaggerated effect (Fig. 6, lower right) that does not appear on the resistance load test. An amplifier that delivers its full power into a resistance load down to a low frequency may not do so well when feeding a loudspeaker in the same frequency range.
Transformers do not normally cause distortion at the high-frequency end, but they have been known to do so, quite seriously, in an indirect manner. If the reactances in the transformer produce differences in the phase transfer response from the two output tube plates, these may be ‘seeing very different impedances.' Instead of working together on the freq. being amplified, they may be opposing one another, so as to pro duce a frequency-doubling effect. In an ultralinear circuit, the possibilities for this kind of deviation are multiplied many times over, and very careful attention to transformer design is vital. Distortion checks should be made up to much higher frequencies than is customary to eliminate such possibilities.
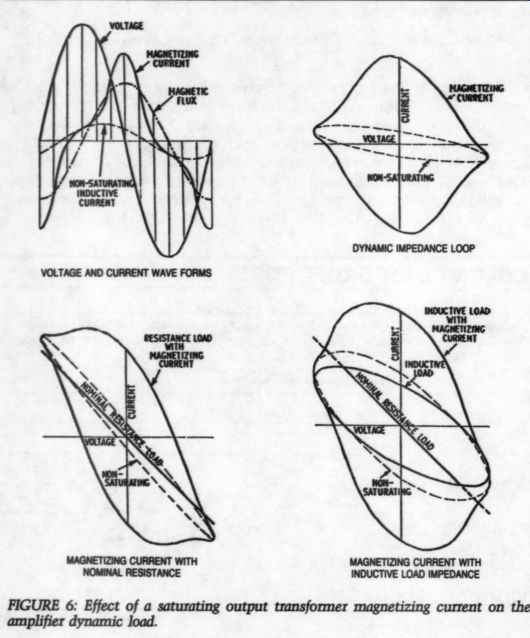
-------------- Fig. 6
Phase Compensation
Application of large amounts of feed back brings its own problems, as many amplifier design engineers are well aware. Achieving an adequate stability margin and obtaining a satisfactory frequency response (such as within +0.1dB) requires careful finagling. This has been given the “engineering” title of “phase compensating,” which at least gives the impression the whole thing is intentional and academically designed for its purpose. That insufficient attention has been given to just what this approach really does can be shown fairly simply (Fig. 7).
Without the phase-compensating capacitor, we are hard put to get sufficient feedback (0.1 percent distortion and what have you), and it is also a problem to get a response within the desired limits (such as 0.1dB). Use of little capacitor(s) enables some of the effective roll-off elements to be 'pushed way out,’ so more feedback can be used, and it also enables peaks and roll-offs to be offset so that the resultant response comes out nearer to flat and over a greater frequency range.
What is wrong with this method? Basically, this approach is a “trick” to enable the amplifier to work and give a satisfactory overall response- as opposed to loop-gain response- with a smaller stability margin. If the loop gain (from input, through the amplifier, and back through the feed back) is measured with feedback connected or closed, as opposed to the input-to-output gain, these amplifiers invariably possess quite a peak at some high frequency. This means their transient response is marred.
Faked Square-Wave Response
Will this reflect in the square-wave test? At first sight, one would think so, but further investigation- theoretically and with practical amplifiers-shows that this too can be 'faked' (Fig. 8). This kind of trickery is critical. The phase capacitor across one half of the phase-inverter load (nominally to 'balance' the inverter) actually works with phase shifts in the output trans former, so the two ringing components very nearly cancel on its secondary, although considerable ringing will be evident on both out put tube plates. Usually the capacitor across he feedback resistor, as well as finagling the frequency response and high-end stability, acts to boost the residue of ringing present in the output. This boosted, phase-advanced, fed-back ringing combines with the original square wave to pro duce a critically shaped “starting ” wave at the plate of this first stage.
The precise shape of this wave is often dependent on the grid-circuit resistance of this stage because this controls the delay in the initial rise of the input waveform.
This skillful combination produces a characteristic output waveform that has a fairly square leading edge with an irregular ripple a little way along.
As a method of obtaining a “satisfactory ” square-wave response, it may be likened to a complex dynamic bridge involving practically every component in the amplifier and particularly including the load impedance. This shows to a marked extent that adjustment of values to get the best 'null' on the 8 ohm tap of a 4, 8 and 16 ohm output leaves the 4 and 16 ohm taps with considerably poorer response. One will be more peaky, and the other will show the opposite effect. That is using a resistance load in all cases on different output taps.
When an impedance including re active components is used, the “null” does not happen. Of course, reactive loading will always modify a square wave considerably, so it is not customary to show a square wave into a reactive load. But the loss of null effect will mar the drive passed on to the loudspeaker far more than the normal reactive loading of a true square wave obtained without “trickery. ” With this method, though, a “satisfactory ” square wave can be shown under idealized test conditions. But it is no indication of the relative performance of the amplifier on normal high-frequency transients, especially working into a loud speaker, instead of the resistance load.
Low-Frequency Response
Low-frequency transient response is yet another question, and one with more “built-in ” scope for finagling.
All decoupling components (screen, cathode and plate supply) are capable of contributing a “step ” response element to the low-frequency stability criteria. Careful choice of values can result in a satisfactory low-end response (e.g., within 0.1dB down to 20Hz) with a narrower-than-normal low-frequency stability margin, so the amplifier verges on instability at a frequency in the region of a cycle.
This can give rise to an undesirable shock-excited intermodulation be tween a high-amplitude internal low frequency wave train, which is in audible in itself, and the program audio-a familiar effect, although often unidentified. It sounds like a cyclic distortion, going on and off once or twice a second, following any sudden burst of program, which need not always be at a sufficient level to cause distortion otherwise.
This effect is complicated by the fact that the inductance of most out put transformers changes with signal level, particularly at the lower frequencies where magnetization is appreciable. This means the effect may show in frequency and level when ex cited by certain program components but not others.
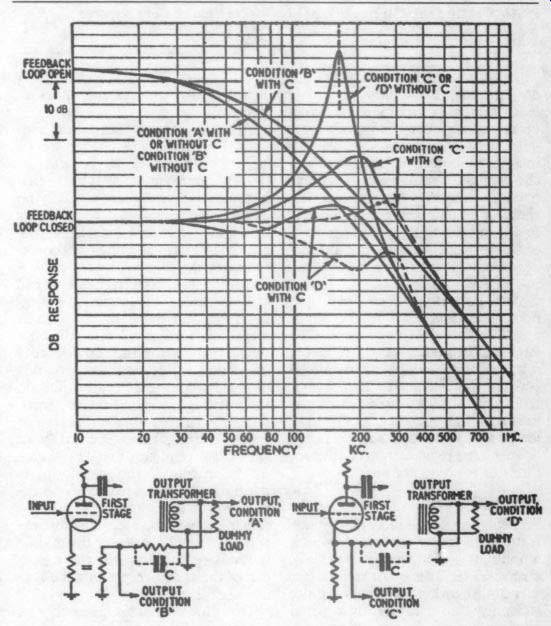
FIGURE 7: Analysis of the typical effect of a phase-compensating capacitor
on amplifier response performance.
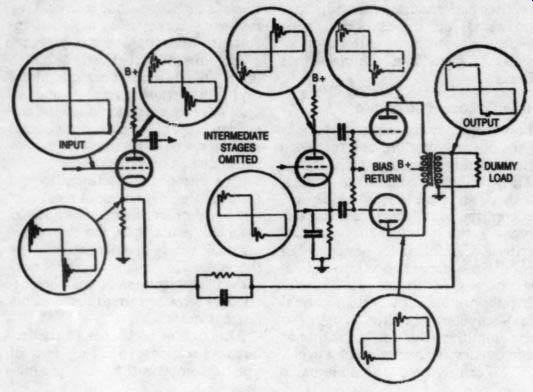
FIGURE 8: Analysis of a typical case of a “faked” square-wave response.
Although at both ends of the frequency response skillful use of 'phase compensation' can produce an amplifier that will work with a gain margin much smaller than otherwise of reactances contributing to roll-off in the overall loop.
Work done on a number of amplifiers using […] rolling off instead by perhaps 1dB at 20Hz to 20kHz-but it does maintain a more uniform performance into practical loudspeaker loads, and as a result sounds much cleaner in its reproduction of different kinds of program transient.
Sudden Overload
Probably one of the most deleterious features of many modem feedback amplifiers is the 'sudden overload’ characteristic. This is not just the fact mentioned earlier that it goes quite suddenly into clipping. But when clipping occurs, the amplifier ‘triggers' into a really severe overload condition from which it may not re cover without reducing level to a point below the normal overload point.
Analysis of one form of this is shown in Fig. 9. The change shown occurs with just a 10 percent (or 0.9dB) increase in input signal beyond the point where virtually no distortion occurs. When the clipping starts, the fed-back voltage is clipped, so the waveform amplified by the early stages develops a sudden peak- the difference between the input and the feedback. This progressively exaggerates the drive to the output stages and further increases the clip ping. At the same time, the rectifying action in the output stage grids produces additional negative bias on the coupling capacitor from the previous stage that over-biases the output tubes, causing them eventually to start crossover distortion. This, being in the middle of the waveform, is naturally compensated to some ex tent by the feedback, but this additional feedback produces a further exaggerated amplification of the middle sections of the wave in the earlier part of the amplifier, pushing the condition still further.
This kind of effect is characterized by two well-known evidences: (a) When the distortion occurs, using a sine-wave test signal, the input must be turned down to well below the “turnover point ” before the amplifier restores to normal operation, and (b) it is critical to set the input to get maximum rated output from the amplifier. If the input is turned up a little too far, the distortion a be triggered, and the input must turned down and brought up again.
As shown in Fig. 9, this is just one of a group of sudden overload or blocking-type distortions. They can be complicated in an almost infinite variety of ways by what happens in the intermediate stages under this condition. The case shown has only one point of distortion generation- the grids of the output stage. But this suddenly calls on the earlier stages to handle about three times the normal maximum output signal of an extremely distorted form. If any of these earlier stages, including the driver or phase inverter, do not have this much headroom, other complications occur producing variations in the waveform and behavior pattern. Some times one half of the phase inverter will be overloaded, hare a distortion into the other half of opposite form, making an even more distorted, asymmetrical variation.
Sometimes a condition is set up at part of the waveform where part of the amplifier goes into oscillation until voltages return to the normal operating region, and the waveform, already heavily distorted, carries a sort of “squegging ” oscillation.
This kind of overload effect is responsible for many seeming inconsistencies in the power rating of amplifiers under listening test conditions, as opposed to the bench test.
It explains the familiar complaint that a certain 15W amplifier seems to give more output than a certain 60W one. The 15W amplifier may use a circuit not subject to this kind of defect, and hence will accept twice the normal input swing required for 15W output, producing only a normal amount of clipping, and that only during the duration of the peaks. But if the input for the 60W amplifier to give its full rated 60W is exceeded at all, it triggers into this severe distortion condition, distorting not only the peak that causes it, but also some of the program that follows. Thus the 15W amplifier gives the impression of being able to handle a louder pro gram without going into distortion as severe as that caused by the 60W unit.
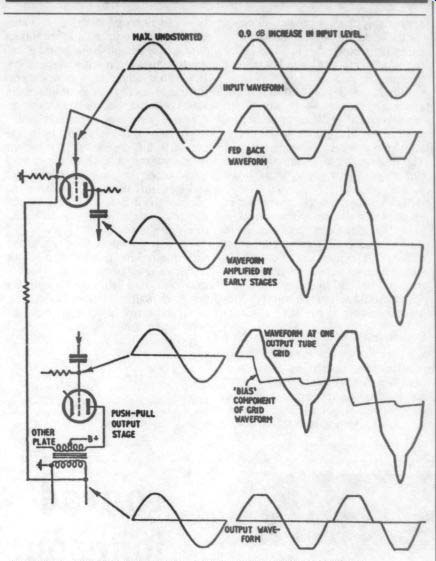
FIGURE 9: Analysis of a common type of sudden overload condition.
Methods of Detection
The remedy for the misleading readings discussed in Figs. 1 and 2 would seem simple-technically, at least. There is, of course, the problem of how to avoid ambiguity of claims when some people are using one definition of harmonic percentage, while others still adhere to the old one. This could probably be over come by inserting the word “peak ” somewhere, such as designating the reading “percentage peak harmonic. ” A comparatively minor change would make a distortion meter register peak reading in measuring the residue, with a correction so that the percentage read is peak of harmonic as a fraction of peak fundamental. The balance adjustment should be carried out with a mean reading instrument; otherwise, the residue will contain a component of fundamental, although this may re duce the reading to not much more than half that obtained if the peak indication were used for setting balance.
The resolution of inconsistencies between different forms of IM measurement using different frequency combinations and various magnitude ratios would not seem possible. This would seem to be an area for standardization after careful research to determine which combinations will “catch ” most of the things that can go wrong. Perhaps one measurement can aim at determining the low-frequency performance, while another [ ...] for applying reactive load at the low A frequency end. This would care of possible effects of transformer The existence of a satisfactory stability margin can be checked fairly easily merely by increasing the feedback to see how much more can be applied before instability sets in.
Another method is the exploration of the effect of output loading-different values of resistance, as well as reactive components-on the amplifier transfer characteristics. If this differs a t source resistance or at a the loading is interfering with the overall stability margin.
the waveform at different points in side the amplifier, WS Sp the output, will show up at other points.
Sudden overload characteristics in an amplifier also are easy to check- in fact, as many engineers who have encountered i it will testify, it is harder to hide. A specification to cover this would have to state how much more than normal full-load input the amplifier should accept without producing any trigger or blocking effects.
Conclusions
We have explored some of the forms of distortion caused by amplifiers from which it is evident that the present method of specifying amplifier performance is not adequate to give a reliable indication of expected quality of program reproduction. It is suggested that steps should be taken toward (a) establishing better standards of measurement and specification, more indicative of practical performance merits; (b) coordinating a series of corresponding minimum acceptable performance criteria in different groups, to avoid aiming, for example, at an unnecessarily excellent frequency response at the expense of some other desirable characteristic; and (c) instituting a program to educate the consumer to understand the new standards, broken down in to simple terms.
These steps would then enable the skill of amplifier designers to be put to better use. Some of the ‘perfection' achieved by modern amplifiers under virtually fictitious conditions could be sacrificed usefully to obtain better performance under normal working conditions.
Reprinted, with permission, from the Journal of the AES.
Copyright 1957 Audio Engineering Society, Inc. All rights reserved.
By Norman H. Crowhurst.
----
Also see:
PREEMINENT PHONO PREAMP, By John H. Roberts
POOGE-3, BY R.N.Marsh