A REAL-TIME SIGNAL TEST FOR CAPACITOR QUALITY
IN THE PAST FEW YEARS, audiophiles have begun to focus on passive circuit components and their impact on audio signal. Caps, and passive components that vary enormously in their from the ideal, have been part of these discussions. You can easily measure capacitor quality by a variety of standard tests for […] (DF) and dielectric absorption (DA). Undoubtedly, these tests arrange the various dielectrics according to their relative quality. Some tests, such as the one described in the specifications for the MIL-C-19978D capacitor [fixed plastic (or paper-plastic) dielectric], are sensitive detectors of the more subtle parameters (DA). This is not a real-time test, however, and it requires specialized equipment and uses essentially DC signals.
Bridge tests have long been used in passive component testing, and a simple wideband bridge circuit can be used to test relative capacitor quality. The advantage of this approach is that it is both real time and real signal. Specifically, you can observe the relative quality results immediately, and they are based on signals that closely approximate audio signals. In fact, they may actually be audio signals.
The test is simple to implement using two RC networks and a calibrated differential amp, as shown in Fig. 1. In one arm of the bridge, the capacitor being tested is connected in series with a fixed stable resistance, Ry. In the other arm, a high-quality reference capacitor of similar value is connected in series with two variable resistances, Radjr and Ragj2. Trimmer Radj1 adjusts the time constant, while Ragj2 compensates for the equivalent series resistance (ESR).
Typical pulse width is 1 to 20msec; period is 5 to 10 times pulse width.
These adjustments balance the bridge (note that the values need only be nominally equal). The bridge output is amplified by a factor, K, and is converted to single-ended form for observation on a standard oscilloscope.
The bridge is driven by a low impedance rectangular wave source with a level of 1 to 10Vpp. This can be from any lab pulse generator with a passive output filter added to band limit the signal to below 100kHz.
The band limit is to minimize instrumentation problems, as well as to simulate an audio signal more realistically. Note that a steady-state signal such as the one described above is most useful in finding the null position. Once this has been established, you may use a real audio signal, as well as pink or white noise and other broadband sources.
--------------
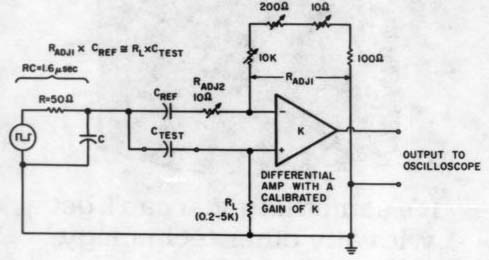
FIGURE 1 : The basic test setup uses two RC networks and a calibrated differential amplifier. Trim Radj1 for coarse null. Trim R_adj2 for fine null. C_ref should be reference-quality caps (Teflon are preferred, but polypropylene are adequate).
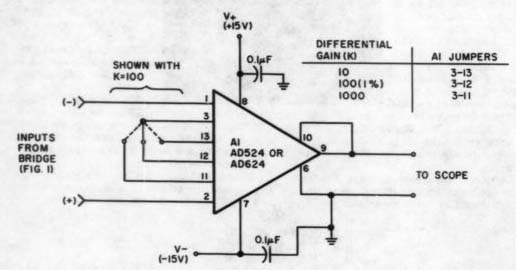
FIGURE 2: This selectable-gain differential preamp uses an IC instrumentation amp to realize the differential gain/level shift function.
---------------
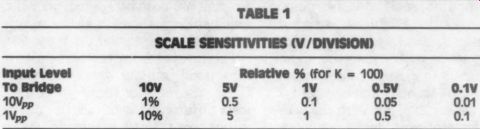
TABLE 1 SCALE SENSITIVITIES
(V/DIVISION) input Level To Bridge
10Vpp Wop 10V Sv 1% 05 10% 9
Relative % (for K = 100) wv 0.5v 0.1v
0.1 0.05 0.01 1 05 0.1
----------------------
Figure 2 shows one convenient way to realize the differential gain/level shift function using an IC instrumentation amplifier (IA).With the AD524 (or AD624) devices, pin selectable calibrated gains of 10, 100 or 1,000 times are available, as noted in the table with Fig. 2. A gain of 100 is the most useful. The devices quoted require no additional parts and no trimming for operation, pg a +15V supply (recommended).
In principle, you may also use other IAs or separate setups with three op amps. If you choose the latter approach, you will need seven precision resistors, four of which should be precisely ratio-matched pairs.
Using the Setup
With this setup, you can obtain a wide variety of sensitivities, which are dependent on the driving level, K, and the scope sensitivity actually used. For example, dependent on the particular quality of Ces, the residue signal at the null point may be as high as 10 percent or more referred to the input, or it may be as low as 0.01 percent or less. These scaling sensitivities are indicated in Table 1 for the drive levels of either 10Vpp or 1Vpp, with the scope scale as shown.
For this table, an IA preamp gain of 100 is assumed. For example, when a drive of 10Vpp is used, a scope display of 1V/division is equivalent to 0.1 percent/division, with respect to the input signal.
For an asymmetric rectangular ...
---------------
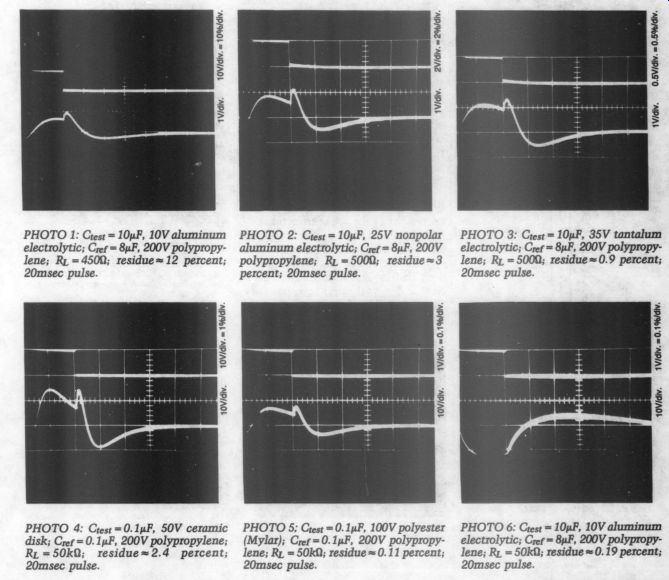
PHOTO 1: C_test = 10uF, 10V aluminum electrolytic; C_ref = 8uF, 200V polypropylene; Ry =450 ohm; residue= 12 percent; 20msec pulse.
PHOTO 2: C_test = 10uF, 25V non-polar aluminum electrolytic; Crer = 8uF, 200V polypropylene; Ry =5000; residue=3 percent; 20msec pulse.
PHOTO 3: C_test = 10uF, 35V tantalum electrolytic; Cref = 8uF, 200V polypropylene; Ry = 500 ohm; residue=0.9 percent; 20msec pulse.
PHOTO 4: C_test =0.1pF, 50V ceramic disk; Crer = 0. 1uF, 200V polypropylene; Rp =50 k-ohm ; residue=2.4 percent; 20msec pulse.
PHOTO 5; C_test =0.1pF, 100V polyester (Mylar); Crer=0.1uF, 200V polypropylene; Ry = 50k); residue =~ 0.11 percent; 20msec pulse.
PHOTO 6: Crest = 10uF, 10V aluminum electrolytic; Cre = 8uF, 200V polypropylene; Ry = 50k; residue = 0.19 percent; 20msec pulse.
-----------
... wave input signal, the frequency spectrum of the test signal is rich in harmonics. Therefore, a single ideal time constant will cause the signal components to change in amplitude ow A second time constant of similar basic value, but with the parasitic effects of non-ideal parameters added, will produce a different set of amplitude/phase relationships. You can understand this if you consider that the parasitic components will change the capacitor value or ESR with frequency. Any capacitor with frequency-dependent parameters will not act identically to an ideal one when fed a wideband signal. This test is designed to produce an output (the residue after nulling) that represents the signal components that differ from the bridge's reference leg. This signal is a measure of the relative quality of Geese because it differs from Ceer in real time.
Sample Results
Some sample results from this type of test are shown in Photos 1-7. The input driving waveform is shown at the top, and the residue after nulling appears at the bottom (sensitivity as shown). The specific types being compared are noted, along with other relevant conditions. In all cases, the input pulse width is 20msec, and the time base is 10msec/division.
This residue can be composed of linear and nonlinear components because it is the total error remaining after the bridge has been trimmed for time constant and ESR. DA will typically be the largest error component in film and aluminum capacitors, and it will often be essentially linear error. Nonlinear errors can also occur, as with capacitance parameters that are not voltage independent.
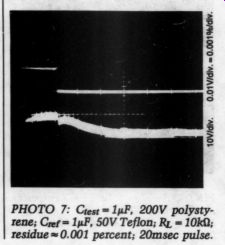
PHOTO 7: C_test = 1uF, 200V polystyrene; Crer = 1uF, 50V Teflon; Ry = 10k ohm; residue = 0.001 percent; 20msec pulse.
This can occur with high-k ceramic units and some tantalum types.
The residue from the test units is dominated mostly by DA errors.
These results offer some interesting observations about the nature of the output error with regard to audio signals (mostly transient in nature).
Not only is the basic waveform of the input pulse distorted in shape, but al so note that appreciable output is still occurring for several tens of milli seconds after the input is complete.
Editors Note: In a letter to Richard Marsh in December 1980, responding to Marsh's article 'Dielectric Absorption in Capacitors’ (TAA 4/80), John Roberts suggested a test similar to the one outlined above. The suggestion was in an unpublished postscript to the letter, which appeared in TAA 3/81, p.54.
ACKNOWLEDGMENTS
A number of people have worked with this basic experimental setup over the past few years. Walt Jung built an early version of it with 5534 op amps, then later with the AD524. Dick Marsh also has tried this. John Curl has done the bulk of the recent work, including all the measurements detailed in the photo series. The basic setup was inspired by discussions with AD524 designer Scott Wurcer of Analog Devices regarding Scott's earlier work with bridge measurements on resistors using the AD524.
REFERENCES
1. Dow, P.C., 'An Analysis of Certain Errors in Electronic Differential Analyzers II-Capacitor Dielectric Absorption, ” IRE Transactions on Electronic Computers (Volume EC-7), March 1958.
2. Dummer, G.W.A. and H.M. Nordenburg, Fixed and Variable Capacitors, McGraw-Hill, 1960.
3. Applications Manual for Computing Amplifiers, Philbrick/Nexus Research, Dedham, MA, 1968, pp.86-87.
4. Kom, G.A. and T.M. Kom, Electronic Analog and Hybrid Computers, 2nd Edition, McGraw-Hill, 1972.
5. Marsh, R.N., TAA 4/77, p. 46.
6. Curl, J., “Omitted Factors in Audio Design, ” IEEE Intl. Conference on Acoustics, Speech, and Signal Processing Proceedings, April 1978, p. 66.
7. Doeling, et al., 'Getting Rid of Hook: The Hidden PC-Board Capacitance,’ Electronics, October 12, 1978.
8. Curl, J., 'Omitted Factors in Audio Design, Audio, September 1979, pp. 20-24.
9. Jung, W.G. and R.N. Marsh, “Picking Capacitors, Parts I & II, ” Audio, February and March 1980.
10. Canning, W., 'Circuit Design Considerations for Low Dielectric Absorption Applications, ” Application Note, TRW Capacitors, Ogallala, NB, June 1980.
11. Marsh, R.N., 'Dielectric Absorption in Capacitors,’ TAA 4/80, p. 31.
12. Pease, R., 'Understand Capacitor Soakage to Optimize Analog Systems,' EDN, October 13, 1982.
13. Wurcer, S. and W.G. Jung, 'Instrumentation Amplifiers Solve Unusual Problems,’ EDN, August 4, 1983.
----
Also see:
DEFECTS IN AMPLIFIER PERFORMANCE, By Norman H. Crowhurst
PREEMINENT PHONO PREAMP, By John H. Roberts