Measure the intermodulation distortion (IMD) of your power amplifiers or preamps to 0.0001%. This article shows you how, and makes some comparisons between total harmonic distortion (THD) and IMD.
By Richard Crawford
Total harmonic distortion (THD) measurements are the most common distortion measurements used for audio equipment. THD is a measure of the nonlinearity of the device under test (DUT). By nonlinearity, I mean that the output is not a true replica of the input. The DUT can be any part of the audio chain, from microphone to amplifier to loudspeaker. In THD testing the source is a sine wave of low distortion.
WHY IMD?
IMD measurements are another way of expressing the nonlinearity of audio equipment. In IMD testing the source is a combination of two (or more) sine waves, and the IMD is a signal (produced by the nonlinearity) at some different frequency. More than 50 years ago Bill Hewlett (of Hewlett-Packard Company) helped write an article about the similarity between THD and IMD measurements1. Broadly speaking, the second-order term in the nonlinearity equation gives (1) second harmonic distortion, and (2) IMD at the sum or difference frequency of the two sine waves.
Similarly, the third-order term in the nonlinearity equation gives (1) third harmonic distortion and (2) IMD at the sum and difference frequencies of multiples of the frequencies of the input sine waves.
Reading the last sentence, I can understand why THD measurements are more popular! For the rest of this article, I will use the terms second-order and third-order to describe the inter modulation measurements, and you can relate these to second and third harmonic distortions.
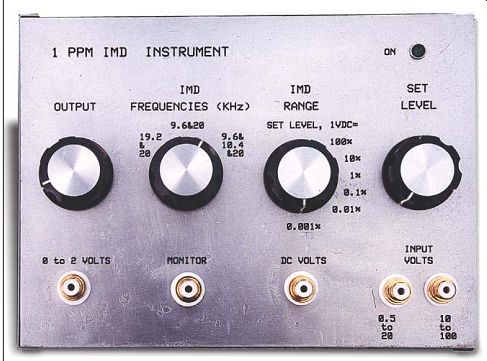
PHOTO 1: Front panel.
THD vs. IMD
Given that both THD and IMD arise from the same nonlinearities, and can be related mathematically, which is preferred?
THD measurements are more common, and there is a large number of existing measurements on a variety of components and devices, and it is useful to be able to compare these measurements. Viva THD measurements. Another advantage of THD measurements is that the signal is a sine wave, and the peak-to-peak voltages are 2.83 times the RMS value of the sine wave.
IMD measurements with two equal signals (two tone) means that the RMS value is 1.414 times that of each of the two signals, but the peak-to-peak signal is 5.6 times the RMS value of each sig nal. So for two-tone IMD signals the peak-to-peak value is four times the RMS. And for three equal signals (three tone), the RMS value is 1.73 times that of each signal, while the peak-to peak signal is 8.4 times the RMS value of each signal. For three-tone IMD signals, the peak-to-peak signal is about 4.9 times the RMS. Thus the ratio of peak-to-peak signals to RMS signals is different for IMD test signals than it is for THD testing, and it changes depending upon the number of test tones used.
This is important because good audio electronics produce audible distortion only when the peak-to-peak voltages are near the limits set by the power-supply voltages. So if you measure the IMD of a power amplifier using RMS calculations, the IMD measurements will show distortion at much lower output power than the THD measurements. My answer to this is to make my IMD measurements based on peak-to-peak voltages. To make a comparison to RMS voltages, divide the peak-to-peak voltages by 2.83.
On the other hand, I believe that it is easier to design--and cheaper to build-- an IMD instrument of high sensitivity.
By high sensitivity I mean an instrument that will measure very small amounts of distortion. This article de scribes an IMD instrument that can measure IMD of 0.0001% (equal to 1ppm); a THD instrument of that sensitivity would cost much more. I need a distortion tester of high sensitivity be cause I am working on some power amplifiers whose distortion is less than most THD analyzers.
Some assert that IMD testing is more strongly related to music than THD measurements, because the distortion that you hear (in orchestral music, for example) is the IMD between the musical instruments. I don't believe this is valid, because the source of THD and IMD are the same nonlinearities. However, to satisfy those who do believe this, I have de signed this IMD instrument so that it can independently measure both second- and third-order nonlinearities. I believe that it is easier to design this independent measurement in an IMD instrument than in a THD instrument.
A THD instrument will usually measure total harmonic distortion including hum and noise, while this IMD instrument measures only the IMD, ignoring the hum and noise. This helps in very sensitive tests, because hum and noise can contaminate the distortion tests. There is no excuse for hum, but it can obscure the distortion tests.
GOALS
My design goals for this IMD instrument include:
1. Generation of IMD test signals, and measurement of IMD signals, on a single printed circuit board of about 3”× 7”.
2.Measurement of IMD from 100% to 0.001% in six decade ranges.
3.Measurement of both second-order and third-order IMD.
4. The use of IMD test signals near 20kHz where audio electronics are most susceptible.
5. Input signal levels from 0.775V RMS (0dBm @ 600 ohm) to 100V RMS.
6. Ease of use.
7. Low cost.
8. The use of an external DC voltmeter to simplify the design and lower cost.
FREQUENCIES
Most modern IMD measurements use two-tone signals of equal amplitude at 19kHz and 20kHz2. The reason for these high frequencies is that they stress amplifiers the most, and is thus a revealing test. However, these frequencies are not very good for testing loud speakers because they would only test the tweeters. The two high frequencies evaluate the second-order nonlinearity by measuring the amplitude of the 1kHz difference frequency.
In this design I have a two-tone test, but I use 19.2kHz and 20kHz, with the difference frequency at about 800Hz.
But I also have a two-tone test using 9.6kHz and 20kHz. This evaluates the third-order nonlinearity by measuring a difference frequency at about 800Hz.
Finally, I have a three-tone test of 9.6kHz, 10.4kHz, and 20kHz, all at the same amplitude, and this gives several difference frequencies near 800Hz for both second-order and third-order non linearities.
I achieve these four frequencies (19.2, 9.6, 10.4, and 20kHz) by dividing a 1MHz crystal clock by (52, 104, 96, and 50). This is simple, low cost, with few parts, and no adjustments. The resulting square waves are stable in amplitude and frequency. All of the difference frequencies are near 800Hz:
1. 1MHz (1/50 - 1/52) = 20kHz - 19.231kHz = 769Hz
2. 1MHz (1/50 - 2/104) = same as previous, 769Hz
3. 1MHz (1/50 - 2/96) = 20kHz -20.833kHz = 833Hz
4. 1MHz (1/96 - 1/104) = (10.417kHz -9.615kHz) = 802Hz
With a single bandpass filter at 800Hz, I can measure all of these IMD signals. I can achieve the differentiation between second- and third-order IMD by the choice of input signals to the DUT, but use the same bandpass filter for measurement.
BLOCK DIAGRAM
The block diagram (Fig. 1) shows the device under test (DUT), the genera tor(s), the measurement section, the voltmeter, the power supply, and the wiring for the front panel. The wiring is important because it minimizes the hum generated by ground loops. What I call the voltmeter is really an AC to DC converter, and I use a separate DC volt meter for measuring the IMD.
Figure 2 shows the schematic of the frequencies generator. A 20kHz square wave is generated by feeding the crystal clock (U1) into a divide by 50 circuit (U2). U3 and part of U6 produce a di vide by 13 circuit, which is followed by a divide by four and divide by eight counter (U4), which produces the 19.2kHz and 9.6kHz square waves. U5 and part of U6 are a divide by six circuit, which is followed by a divide by 16 integrated circuit (IC) (half of U4), which gives a square-wave output of 10.4kHz. I use CMOS ICs because of their low cost, ready availability, and rail-to-rail outputs.
All of the frequencies generator outputs are square waves, with outputs from 0V to +5V. These square waves are unsuitable to drive the DUT directly because:
1. The square waves contain many harmonic frequencies, which could con fuse the IMD measurements.
2. The fast rise and fall times of the square waves might cause problems in the DUT.
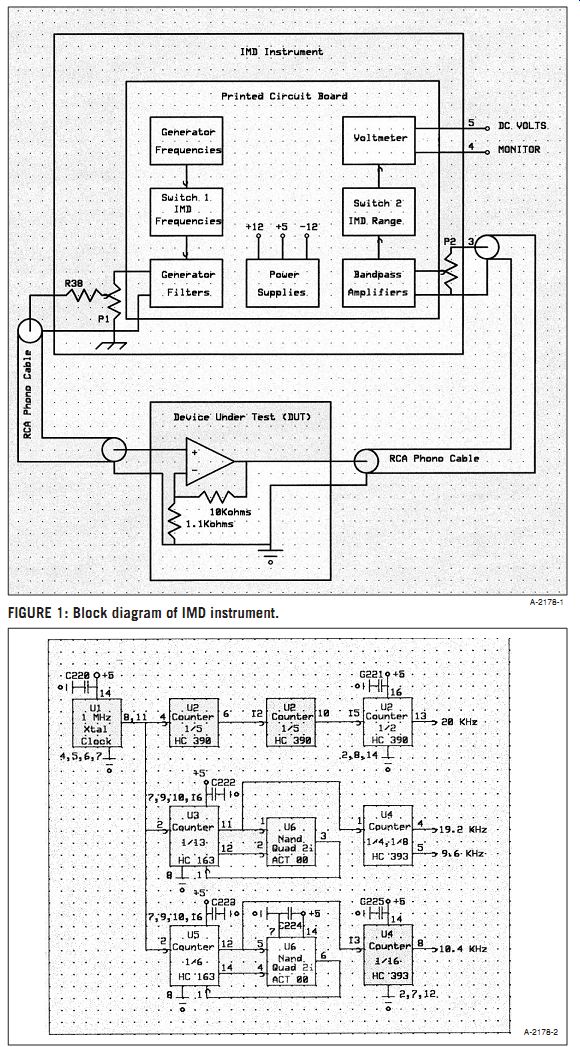
FIGURE 1: Block diagram of IMD instrument. FIGURE 2: Schematic of frequencies
generator.
FIGURE
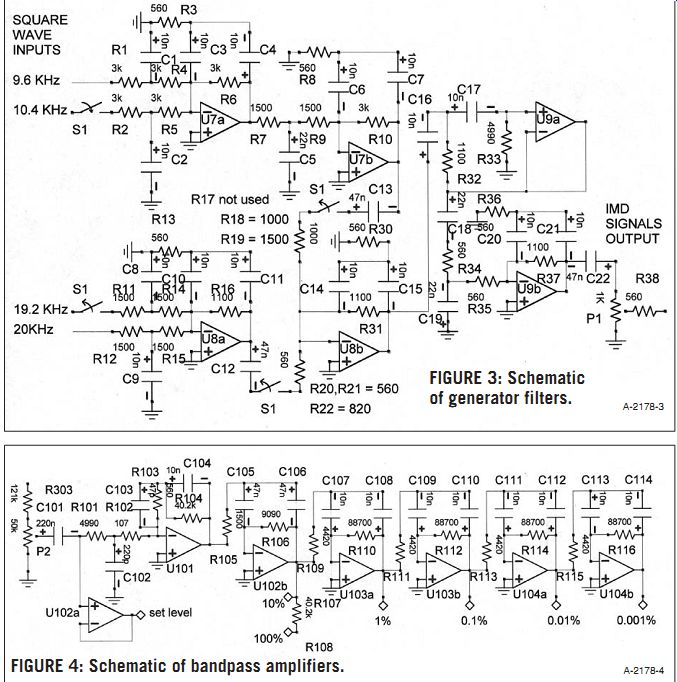
3: Schematic of generator filters. FIGURE 4: Schematic of bandpass amplifiers.
GENERATOR FILTERS
It is desirable to reduce the harmonics in the square waves from about 40% to about 1%. This is accomplished by the generator filters: U7, U8, and U9 (Fig. 3).
U7a is a low-pass filter for the 20kHz and 19.2kHz square waves. U8a and U8b are low-pass filters for the 9.6kHz and 10.4kHz square waves. All of these signals are combined, in varying amplitudes, in U8b.
Switch S1 (the frequencies selector switch) selects the resistors (R17, R18, R19, R20, R22, and R23), which give the proper signal amplitudes for each of the IMD modes. Switch S1 is a 4-pole, 3 position switch, but it is not shown that way on the schematic because of limitations of my schematic capture pro gram. U8b also acts as a low-pass filter.
U9a requires explanation. Both U7 and U8 can have two signals present, and they will generate some IMD at about 800Hz. I want the generator output signal to be unblemished by any IMD, else how can I distinguish IMD generated by the DUT from the IMD supplied by the generator? U9a is a high-pass filter which attenuates the 800Hz IMD. C12, C13, and C22 also produce high-pass filters which further attenuate the 800Hz IMD. U9b is a low-pass filter which reduces the harmonic content of all signals in the output, and which supplies the output signal. P1 is the output level control. R38 is used to keep the output impedance near 600?, and to prevent long cables from causing problems with U9b. The output signal level is about 2V RMS, which gives peak-to peak outputs of as much as 10V. I want to keep the output signal level as low as possible to reduce the IMD in the generator, but high enough to drive any audio gear.
MEASUREMENT SECTION
The goals for the measurement section include a dynamic range from 0.75V RMS to 100V RMS, an IMD level of -130dB, and a signal-to-noise ratio of 130dB. Achieving this combination was the hardest part of this design. It would be even harder to achieve in a THD instrument, because the bandwidth is about 100 times larger than in this IMD instrument.
Figure 1 shows the input signal attenuator and level control. The range of input signal levels is handled by having two inputs--one for 0.75V to 30V and the second from 25V to 100V.
VOLTMETER
I need a voltmeter that will measure the IMD over a range from 100% to 0.0001%.
I achieved this dynamic range by building an AC voltmeter which is accurate over a 20dB range (1V to 0.1V), and coupled this to an amplifier chain which has five stages with 20dB gain per stage. This lets me switch (with S2) the AC voltmeter to the desired gain stage, thus giving the desired IMD range. S2 selects between:
1. Set input level, wherein the input gain is adjusted to give 1V DC at the voltmeter. This measures all the signals in the audio bandwidth (no bandpass filtering). Set input level re quires a nominal 0.75V RMS at the input of U102a.
2. 100% IMD, wherein the voltmeter reads 1V DC for 100% IMD.
3. 10% IMD, wherein the voltmeter reads 1V DC for 10% IMD.
4. 1% IMD, wherein the all-knowing volt meter reads 1V DC for 1% IMD.
5. 0.1% IMD, wherein the overworked voltmeter reads 1V DC for 0.1% IMD.
6. 0.01% IMD, wherein the astounding voltmeter reads 1V DC for 0.01% IMD.
7. 0.001% IMD, wherein the beleaguered voltmeter reads 1V DC for 0.001% IMD.
BANDPASS AMPLIFIERS
In order to measure the IMD I use a chain of 20dB amplifiers, but I need to filter out the signals above 800Hz. I do this by making the 20dB amplifiers into bandpass amplifiers which are tuned to 800Hz. This combination of five cascaded bandpass amplifiers results in an overall gain of 100dB, with a bandwidth of about 160Hz. This gives more than 130dB of attenuation at 9.615kHz.
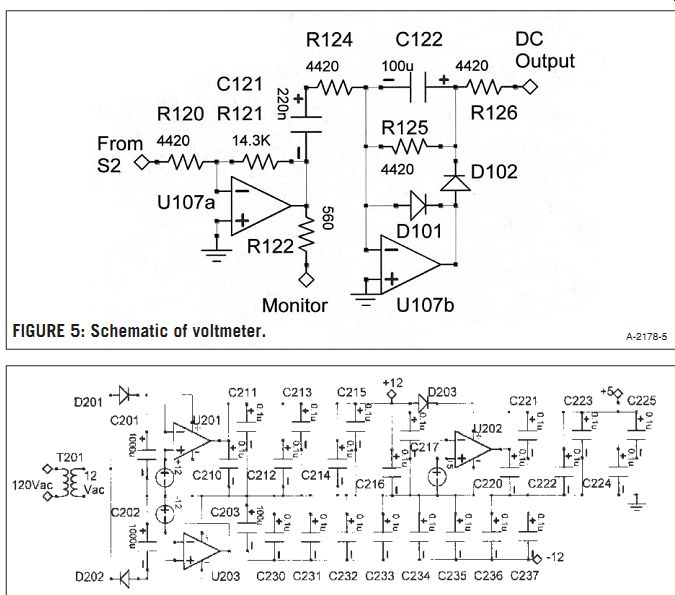
FIGURE 5: Schematic of voltmeter.
FIGURE 6: Schematic of the power supply.
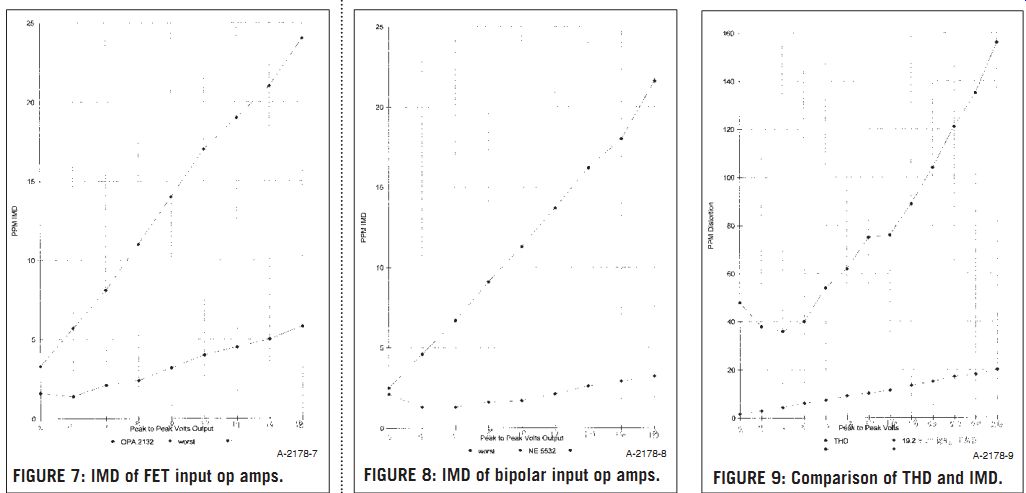
FIGURE 7: IMD of FET input op amps.
FIGURE 8: IMD of bipolar input op amps.
FIGURE 9: Comparison of THD and IMD.
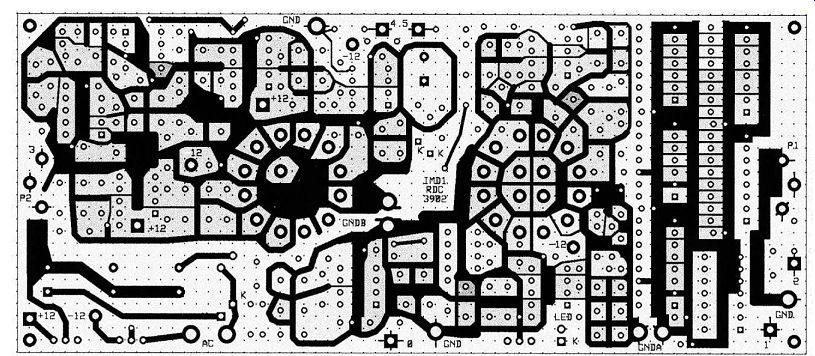
FIGURE 10: Component side of the printed circuit board.
These bandpass amplifiers also re duce the 60Hz hum by more than 130dB. In order to reduce the noise to -130dB, I need an input noise level of less than 245nV. With a noise band width of 160Hz, the noise referred to the input needs to be below about 19nV per square root Hz. This is achievable with low-noise devices.
The input amplifier (U101) of Fig. 4 has the hardest job. It is an inverting amplifier, because I found that this gives the lowest IMD. It uses a low-noise op amp (NJM 5534) to give the required signal to noise. To reduce the requirements on the succeeding stages, U101 has gain (about 12dB at 800Hz) and is a low-pass filter, reducing the signals at 9.615kHz and above by more than 20dB ( compared to the 800Hz).
U102b is a bandpass amplifier tuned to 800Hz, with about 8dB of gain at 800Hz. (U102b is similar in design to U103a described later). The combination of U101 and U102b gives a gain of 10 (20dB) at 800Hz, and thus the output of U102b represents 10% IMD. R107 attenuates the output of U102b by a factor of ten, thus giving a signal which represents 100% IMD.
U103a is a bandpass amplifier with a gain of ten. It uses a bridged-T RC net work with:
1. Gain = 1/2 (R110/R109)
2. Q = (1/2) [square root of (R110/R109)]
3. Fo (tuned frequency) = 1/[(2 pi){square root of (R110)(R109)(C107)(C108)}] For R110 = 88.7k?, R109 = 4.42k?, C107 and C108 = 10nF, the gain is 10.0, the Q is 2.24, and the tuned frequency is about 804Hz. 0.75V RMS at the output of U103a represents 1% IMD.
U103b, U104a, and U104b are all tuned amplifiers identical to U103a. Thus, 0.75V RMS at the output of U103b rep resents 0.1% IMD. Similarly, 0.75V at the output of U104a represents 0.01% IMD, and the output of U104b represents 0.001% IMD.
U102a is a voltage follower that monitors the voltage across the series combi nation of R101 and R102. This is a signal which is an attenuated version of the signal from the DUT. The output of U102a is used as the "Set Level" for S2.
When S2 selects the "Set Level," the SET LEVEL control is adjusted to give 1V DC output from the voltmeter. The gain of the voltmeter is designed to give 1V DC output for 0.75V RMS AC input.
The voltmeter (Fig. 5) is a conventional half-wave average responding detector (U107b). The time constant of the DC filter (R125 and C122) is about 0.4 second, which seems a little slow.
The output is a DC voltage of 1V full scale. The voltmeter will have better accuracy if the input signal is large, so U107a is a buffer amplifier which boosts the nominal 0.75V RMS signal from S2 to 2.4V RMS. The buffer amplifier also supplies the monitor output, which has a source impedance of about 600?, and is intended for use with external high impedance instruments such as oscilloscopes or audio spectrum analyzers.
-------------
TABLE 1
PARTS LIST
0-100 = generator; 100-200 = measurement; 200-300 = power supply; 300-400 = panel
CAPACITORS
C1-C4, C6-C11, C14-C17, 10nF/100V/2% film capacitor
Mouser 140- PF2A103F $10.75 C20, C21, C104, C107-C114 C5, C18, C19 22nF/2% film capacitor Mouser 140- PF2A223F $1.44 C12, C13, C22, C105, C106 47nF/2% film capacitor Mouser 140- PF2A473F $3.15 C101, C121 220nF/5%
Mouser PF2A224J $0.68 C102 220pF/10% NPO ceramic Mouser 21RD622 $0.12 C103 47pF/10% NPO ceramic Mouser 21RD747 $0.10 C122, C203 100µF/100V electrolytic, 105° C Digi-key P10776-ND $2.88 or Mouser 647- UPW2A101MHH C201,C202 1000µF/35V electrolytic, 105° C Digi-key P10305-ND $3.14 or Mouser 647- UPW1V102MHH C210-C217, C220- 0.1µF X7R ceramic Mouser 21RX310 $4.18 C225, C230-C237
CONNECTORS
RCA panel mount phono jack, insulated Parts Express 091- 1120 $15.90 DIODES D101, D102 1N4148 small-signal silicon Mouser 78-1N4148 $0.10 D201, D202 1N4002 1A/100V rectifier Mouser 583-1N4002 $0.06 D203 Green LED Radio Shack 276-069 $2.29
ENCLOSURE
LM Crown Royal 6"H × 8"W × 4.5"D
Mouser 537-CR-864 $22.48
INTEGRATED CIRCUITS
U1 1-MHz clock Mouser 73-X0 54B100 $2.24
U2 Dual divide by 10 74HC390 Mouser 511- M74HC390 $0.58 U3, U5
Binary divider 74HC163 Mouser 511- M74HC163 $1.04 U4 Dual divide by 16 74HC393 Mouser 511- M74HC393 $0.58 U6 Quad NAND 74ACT00 Mouser 511- 74ACT00B $0.34 U7, U8, U102-U104, U107 JRC5532 Mouser 513- NJM5532D $3.30 U9 Burr-Brown OPA2132 Digi-key OPA2132PA- ND $4.48 U101 JRC 5534 Mouser 513-NJM 5534D $0.33 U201 +12 regulator 78F12 Mouser 513-NJM 5534D $0.36 U202 +5V regulator 78F05 Mouser 513- NJM7805FA $0.36 U203 -12 regulator 79F12 Mouser 513- NJM7912FA $0.55 Knobs Radio Shack 274- 402 $2.98 PC (printed circuit) board $40.00
RESISTORS
ALL 1% METAL FILM, UNLESS NOTED
R1, R2, R4, R5, R6, R10 3 k-ohm K-OHM Mouser 271-3.0K $0.54 R3, R8, R13, R20, R21, R30, 560 -ohm Mouser 271-560 $1.08 R34, R35, R36, R38, R302, R103, R122 R7, R9, R11, R12, R14, R15, 1.5 k-ohmMouser 271-1.5K $0.63 R19, R105 R16, R31, R32, R37 1.1 k-ohm Mouser 271-1.1K $0.36 R17 not used R18 1.0 k-ohm Mouser 271-1.0K $0.09 R22 820 -ohm Mouser 271-820 $0.09 R33, R101 4.99 k-ohm Mouser 271-4.99K $0.18 R102 107 -ohm Mouser 271-107 $0.09 R106 9.09 k-ohm Mouser 271-9.09K $0.18 R109, R111, R113, R115, 4.42 k-ohm Mouser 271-4.42K $0.63 R120, R124, R125 R104, R107 40.2 k-ohm Mouser 271-40.2K $0.18 R110, R112, R114, R116 88.7 k-ohm Mouser 271-88.7K $0.36 R303 121 k-ohm Mouser 271-121K $0.09 R121 14.3 k-ohm Mouser 271-14.3K $0.09 P1 Potentiometer, 1k-ohm, audio taper Mouser 31VJ301 $1.25 P2
Potentiometer, 50k-ohm, audio taper Mouser 31VJ405 $1.25
SWITCHES
S1 4-pole, 3-position, PC terminals Mouser 105-2457 $2.57 S2 1-pole, 7-position, PC terminals Mouser 105-2454 $2.57
TRANSFORMER (AC TO AC ADAPTER) T201 12V AC @ 1A
Mouser 412-212101 $5.49
Total: $139.57
--------------
POWER SUPPLY
The power supply is simple (Fig. 6). It uses a 12V, 1A, AC to AC adapter. Half wave diode rectifiers and 1000µF filter capacitors give about +18.2V and -18.6V of unregulated voltage. The 7812 voltage regulator (U201) provides +12V, the 7805 voltage regulator (U202) provides +5V, and the 7912 voltage regulator (U203) provides -12V. The positive supply has the most drain (of about 100mA), because this supplies the +5V for digital as well as the +12 analog. The voltage regulators without heatsinks are warm, not hot, to the touch.
An LED, to indicate that the instrument is on, is included in the power supply. You can put the LED on the PC board, or mount it on the front panel and wire it to the PC board. If you wire the LED backwards, it won't light, and the +5V regulator won't work. If you don't want an LED, put a jumper of bare wire into its wiring holes on the PC board. My apologies if the drawings for the voltage regulators U201, U202, and U203 are not normal, but this is due to limitations of my schematic cap ture program.
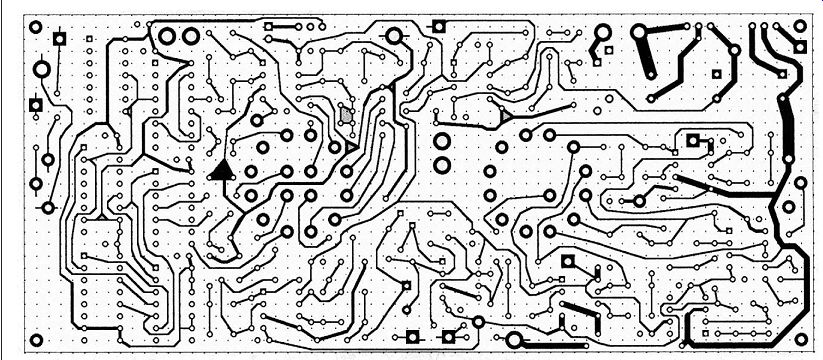
FIGURE 11: Circuit side of the printed circuit board.
ENCLOSURE
The printed circuit board is 2.8” high × 6.6” wide, and will fit in a 3”× 7” enclosure. My prototype (Fig. 7) is built in a metal box of 6”H × 8”W× 4.5”D, because I wanted more room on the front panel for large knobs, which let you more easily adjust the output level and set level controls. I tried a plastic enclosure, but on my workbench this did not work well because the IMD instrument is sensitive to magnetic fields. I recommend a metal enclosure.
PERFORMANCE
There is a minimum noise of this IMD instrument, and in my unit this measures about 0.3ppm. This is slightly more than -130dB down, and corresponds to about 150nV referred to the input. This is less than 12nV per square root hertz, and is mostly due to R101, the 4.99 k-ohm input resistor.
The worst residual IMD occurs on the two-tone (19.2kHz and 20kHz) mode. I believe this is because these are the two highest frequencies, which tend to generate more IMD. This residual IMD measures about 0.3 ppm.
The combination of noise and residual IMD establishes a lower measurement limit, or "floor," of about 0.5ppm.
This is low enough to reliably measure 1ppm (0.0001%) IMD.
SOME MEASUREMENTS
The process used in making an IMD measurement is to hook up the DUT as shown in Fig. 1. Set S1 to select the desired test frequencies. Adjust the output level of the IMD instrument (P1) to give the desired signal level from the DUT. If the DUT has its own gain control, you usually will get better results if you set the output level of the IMD instrument at maximum, and adjust the gain control of the DUT to give the desired signal level. You will need to measure the output signal level from the DUT using either an oscilloscope or an AC voltmeter.
Next, set the IMD range switch to the SET LEVEL position. Then adjust the SET LEVEL control (P2) to give 1V output at the DC voltmeter terminals and slowly rotate the IMD range switch clockwise through each successive IMD range until the DC voltmeter reads more than 0.1V. The IMD is the DC voltmeter reading in volts times the IMD range.
For example, if the DC voltmeter reads 0.5V on the IMD range of 0.1%, then the IMD is 0.05%. In order to evaluate this IMD instrument, I used a test circuit (the DUT) shown in Fig. 1. This is a gain of ten stage, and I tested some good op amps.
I used the non-inverting configuration because it typically has more distortion than the inverting version. The FET input op amps have a good reputation in audio circles, so I tested the LF412, the TL072, the OPA 2132, the OPA 2604, and the AD712.
Figure 7 shows the results for the best and worst op amps, but I identify only the best one--the OPA2132, which is expensive at about $5 for a dual op amp. I use the OPA 2132 for U9, be cause this allowed me to achieve an output level of 2V RMS, whereas other op amps limited me to less than 1V RMS output.
Figure 8 shows the best and worst results for some bipolar input op amps. I tested the 5532 from three manufacturers, and the LT1124. The best bipolar op amp was the NE5532 from Signetics (now part of Philips). I found a four-to one variation in IMD for 5532s from different manufacturers.
If you look at my parts list (Table 1), you will see that I use the NJM 5532D extensively, and it is not the best 5532! I designed the IMD instrument before I made these tests. The NJM 5532D is good enough for the IMD instrument.
All of the 5532s are reasonably priced, some going for less than a dollar.
Figure 9 shows some comparisons between IMD measurements and THD measurements, at the same peak-to peak voltages. I needed to use one of the worst bipolar op amps to get enough THD to make these comparisons. I used 20kHz as the frequency for the THD measurements. Notice that the THD measures about eight times larger than the IMD. This seems to be due to two causes:
1. The IMD is more sensitive than the THD by about a factor of 3.21.
2. The IMD frequency is about 800Hz, and this is 25 times smaller than the 20kHz used for the THD measurements. This means that there is about 25 times more negative feedback at 800Hz than at 20kHz, and this greater negative feedback reduces the IMD by about 25 times.
These two causes reduce the IMD by a factor of (25/3.2), or about eight. Still, the IMD instrument is more than ten times as sensitive as the THD instrument, be cause its IMD "floor" is much lower than that of the THD. The IMD instrument will be even more sensitive than that of the THD instrument if it is used on digital signal processors such as D to A converters, A to D converters, and so forth.
Figures 7, 8, and 9 show only the IMD measured using 19.2kHz and 20kHz.
The IMD measured with other frequencies was much lower, and I left it off the graphs for reasons of simplicity.
The test circuit IMD results are in the 1.4ppm to 24ppm range. This is more than the IMD of the IMD tester, and a natural question is why? The reason is that I use lower distortion circuit design for the input stages of the IMD instrument, and the 800Hz tuned amplifiers in the IMD instrument reduce the higher frequency test signals (above 9.6kHz) in the following stages, thus reducing their IMD.
Still, 24ppm IMD is very good, and is beyond the limit of some expensive THD instruments. Why are these op amps so good? One answer is that I measured only op amps that have a good reputation. Another answer is the IMD frequency is near 800Hz, and all of these op amps have lots of negative feedback at this frequency, thus lowering the IMD. An IMD instrument with a larger difference frequency (e.g., 12kHz - 8kHz = 4kHz3) would be more sensitive at detecting IMD, but this is a more expensive IMD instrument.
If you look closely, you will notice that some of the op amps measure more IMD (2ppm) at 1V output than at 2V output (1.4ppm). Is this true? No.
The problem is noise. 2ppm at 1V output is 2µV. If the DUT produces 2µV of noise in the 160Hz bandwidth of the IMD instrument, then it will seem to be 2ppm IMD. Some op amps with a gain of ten produce this much noise.
Another question is "Could I hear the difference between these op amps?" The answer is "not likely." 24ppm is the worst IMD I measured, and this is 0.0024% IMD. The most acute listener might discern IMD of about 100 times worse.
The final question is "Then why bother?" and the answer is that high fidelity is a search for unquestionable reproduction, and the IMD instrument is a tool to help in that search. Besides that, I deliberately chose good op amps to measure, and other devices, such as switching power amplifiers, or A to D converters, or D to A converters, or any means of digital processing or recording, might be much worse. Don't get me wrong, I like digital processing; it's just that I need to know what it is doing to my audio signals.
CONSTRUCTION
The IMD instrument, designed for the hobbyist, uses a single printed circuit board, with no adjustments. In order to eliminate adjustments I needed to use components of high accuracy. I kept the design as simple as I could, but the active filters and tuned amplifiers of the IMD instrument require a lot of parts. There are some jumpers on the PC board, and there is some front panel wiring. Photo 1 shows the front panel.
I do not recommend this as a first project, because of the complexity, but I do believe that the amateur who has built a couple of other projects will be able to successfully build this one.
Photo 2 shows the interior of the proto type, giving you an idea of the wiring complexity. Figures 10 and 11 show the component side and circuit side of the printed circuit (PC) board.
The construction should start with the front panel. I show a recommended layout in Fig. 12. The switches (S1 and S2) solder directly to the printed circuit board, and thus their mounting holes (3/8” diameter) need to be 2 ” apart. You don't need the anti-rotation tabs for S1 or S2.
The pots (P1 and P2) can be 6” apart (3/8” diameter holes) and in line with the switches. This makes the connections from the pots to the PC board straight pieces of wire. This is easy and avoids confusion. I recommend anti-rotation holes for the pots.
I use insulated RCA phono jacks (five in all) for the inputs and outputs.
The chassis is grounded to the front panel at the output phono jack. In my prototype this gave the lowest hum due to ground loops, which can be a problem, as in some measurements I have detected hum components at the 11th, 13th, and 15th harmonics of 60Hz (660, 780, and 900Hz).
There is no connector for the 12V AC input, simply a hole in the cabinet to allow the 12V AC wires from the AC adapter to enter the enclosure. Figure 13 shows the component loading dia gram.
PARTS LIST
Table 1 shows the parts list. The total cost of the parts is less than $150, not including the DMM. The Radio Shack model 22-809 DMM costs about $40 and seems more than adequate. What is needed here are at least three digits at 1V DC. For less than $200 you can build an IMD instrument of top-notch performance.
CONCLUSION
Years ago I had a Heathkit IMD instrument, and I miss it. This IMD instrument is many times better than that Heathkit at measuring the performance of electronic gear. The measurements that I've made show that modern op amps have much lower IMD than you are ever apt to hear. That's the way it should be. If you want to build amplifiers or preamps, this IMD instrument will tell you whether they have the low distortion you want.
REFERENCES
I particularly recommend the reference by R.H. Small, which I didn't find until my design was completed.
1. W. J. Warren and W. R. Hewlett, "An Analysis of the Intermodulation Method of Distortion Measurement," Proc. of the IRE, April 1948.
2. Charles Hansen, "Product Review: EarMax Pro Tube Headphone Amplifier," audioXpress , Sept. '02, p. 53.
3. R. H. Small, "Total Difference-Frequency Distortion: Practical Measurements" J. Audio Eng. Soc., June 1986.
4. J. Borwick (et al.), Loudspeaker and Headphone Handbook, 2nd ed., ISBN 0 240 51371 1, pp. 459-461.
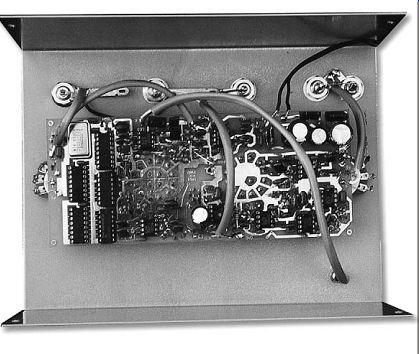
PHOTO 2: Inside of the IMD instrument.
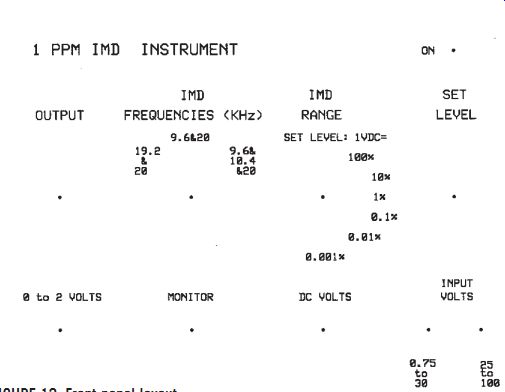
Fig. 12. : Front-panel layout.
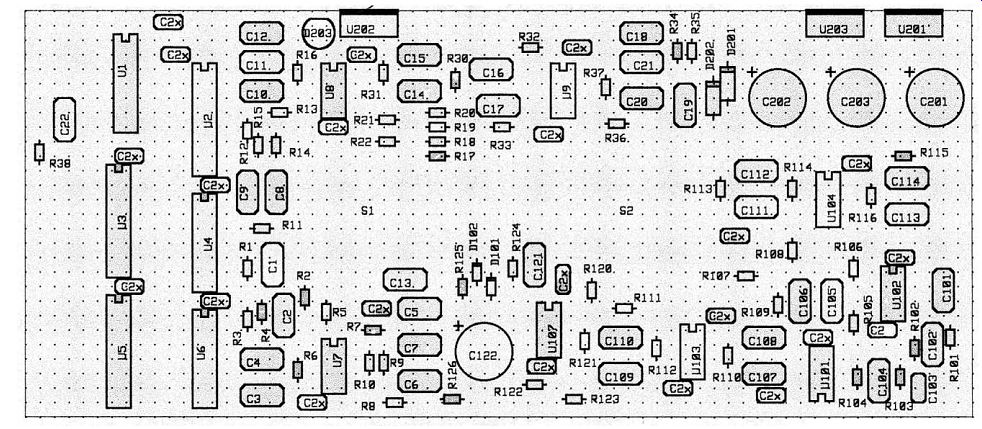
FIGURE 13: Loading diagram of the printed circuit board.
Also see: AN 8W 2E24 SE AMP