TESTING THE SEAS FROY MK3 -- How does this updated Froy kit, featuring high-quality SEAS drivers, rate? Our audio experts put this design through its paces.
----
By Joseph D'Appolito and Dennis Colin
According to the SEAS web site (seas.no), the Froy (Mk3) kit is an improved version of the original Froy kit. It uses SEAS' latest drivers from the EXCEL line. The kit employs two W15CY001 15cm magnesium cone woofers with one EXCEL T25CF002 Millennium tweeter in my MTM configuration. Ed Dell built the two Froy (Mk3) loudspeakers tested here. (March '03, p. 60)
I ran a series of impedance, frequency response, polar response, and distortion tests on the Froy (Mk3). Figure 1 is a plot of system impedance magnitude. At low frequencies the plot displays the double-peaked curve typical of vented systems. The impedance minimum of 3.74 ohm at 54.2Hz indicates the vented-box tuning frequency (fB). There is a second impedance minimum in the low frequency range of 3.2 ohn at 210Hz.
Impedance phase angles range from +34° to -43°. I would rate this a 4 ohn speaker.
FREQUENCY RESPONSE
Figure 2 shows the full-range frequency response of one Froy (Mk3). This response is obtained as a combination of the far-field quasi-anechoic response and prop erly summed near-field woofer and near-field port responses. I placed the microphone along the tweeter axis at a distance of 1.25m to pro duce the far-field response. The near- and far-field responses were then spliced together at 200Hz to produce the full-range response1.
The response data is 0.1 octave smoothed.
In the octave between 500Hz and 1kHz, sensitivity averages 87.6dB SPL/2.83V/1m. This is only 0.4dB less than the 88dB SEAS claims and well within acoustic measurement accuracy.
Relative to the 87.6dB level, response varies by +2.1dB and -1.2dB over the range of 200Hz to 20kHz. The +2.1dB point occurs in the tweeter's response range at about 4.5kHz. The -3dB low frequency point is 72Hz.
The rather poor low-frequency extension is surprising. A quick analysis in LEAP shows these woofers capable of an f3 of 55Hz in a QB3 alignment with a 12 ltr box tuned to 43Hz. Contrast this with the measured fB of 54.2Hz. (The second sample measures even higher at 56Hz.) SEAS claims a low frequency response to 40Hz, but no limits are given on this figure. SEAS' own plot shows the Froy down about 14dB at 40Hz when measured in their anechoic chamber.
The Froy (Mk3) impedance curve given on the SEAS website shows an impedance minimum of about 47Hz. A quick glance at the Froy plans shows that Editor Dell has reproduced the enclosures accurately, which leaves the discrepancies in fB unexplained.
Figure 3 plots system and individual driver responses between 200Hz and 20kHz. This plot shows the crossover frequency for this sample to occur at 2061Hz, some what below the 2200Hz claimed in the SEAS literature. Notice the woofer pair response peak at 8.24kHz. SEAS claims the woofer peak is suppressed in the crossover with a series LC network in parallel with the woofers. However, exami nation of the crossover schematic on the website shows a Zobel across the woofer terminals, which negates the effect of the shunt.
WOOFER/TWEETER TIMING
The Froy (Mk3) step response is plotted in Fig. 4, which shows two separate arrivals of acoustic energy. The initial sharper positive spike is the tweeter arrival. It is followed by the woofer arrival, be ginning about 0.2ms later. Al though not shown, a detailed examination of the excess group delay plot1 shows the woofer pair to be 200µs (0.2ms) behind the tweeter. Although all drivers are connected with positive polarity, the system is not time-coherent.
CUMULATIVE SPECTRAL DECAY
The Froy (Mk3) cumulative spectral decay (CSD) response is presented in Fig. 5A. This waterfall plot shows the frequency content of the system response following a sharp impulsive input at time zero. On the CSD plot, frequency increases from left to right and time moves forward from the rear.
Each slice represents a 0.11ms increment of time. The total vertical scale covers a 30dB dynamic range.
Ideally the response should decay to zero instantaneously. Inertia and stored energy that take a finite amount of time to die away, however, characterize real loud speakers. A prominent ridge parallel to the time axis indicates the presence of a strong system resonance.
The first time slice in Fig. 5A (0.00ms) represents the system frequency response. The major decay response above 3kHz falls 30dB in 0.8ms. However, there is a fair amount of "hash" beyond this point. In particular, there is a ridge at 8.2kHz extending out be yond 3ms. This result is at first surprising since the EXCEL Millennium tweeter does not display this poor decay response in the THOR transmission line2.
Figure 5B gives the source of this hash. This plot of woofer pair response without smoothing shows a strong response peak at 8.2kHz followed by successively smaller peaks at 10.8, 13, 15.7, and 18.5kHz.
These are the higher frequency breakup modes of the EXCEL woofer cones. The major peak is only 13dB below the full system response. Figure 5C, a CSD of the woofer pair, shows these modes clearly.
Returning to Fig. 3, you see that the woofer pair response falls off only 9dB in the octave above crossover and the primary woofer breakup peak is not suppressed.
Contrast this with Fig. 14 in reference 2, where response falls off 15dB in the first octave above crossover and the primary woofer peak is fully suppressed. Careful listening will determine what, if any, effect the untamed woofer modes have on sound quality.
The low-frequency decay is rather rich in frequency content and extends out to about 4ms.
This is fairly typical of vented loudspeakers.
HORIZONTAL POLAR RESPONSE
Horizontal polar response is examined in Figs. 6 and 7. Figure 6 is a waterfall plot of horizontal polar response in 10° increments from 60° right (+60°) to 60° left (-60°) when facing the speaker. All off axis plots are referenced to the on axis response, which appears as a straight line at 0.00°. For this reason, the plotted curves show the change in response as you move off axis. For good stereo imaging the off-axis curves should be smooth replicas of the on-axis response with the possible exception of some tweeter rolloff at higher frequencies and larger off-axis angles.
Within ±30° the off-axis curves are indeed fairly smooth replicas of the on-axis response. The -3dB coverage at 15kHz is ±25°, which is typical of 25mm dome tweeters.
The 60° curve shows the transition from the woofer pair to the tweeter.
At 1.6kHz, response is down 6.7dB relative to the on-axis response. This is due to the woofer pair directivity at that frequency.
At 2.6kHz, however, the 60° off axis response is down only 2.4dB, because the system output has transitioned from the woofer pair to the tweeter. The response at large off-axis angles is typical of two-way systems.
The average response over a 60° horizontal window (±30°) in the forward direction is a good approximation of the way a speaker will sound in a typical listening environment (Fig. 7). This response is within 1dB of the on-axis response out to 10kHz and is only 2dB down at 15kHz. This is excellent horizontal performance and suggests good direct field coverage in the primary listening area with little change in spectral balance with changing position. Image stability should be very good.
VERTICAL POLAR RESPONSE
Figure 8 is the waterfall plot of vertical polar response. Responses are shown in 5° increments from 25° below (-25°) the tweeter axis to 25° above it. Off-axis responses out to ±10° track the on-axis response with little error.
As angles approach 20° and more, deep symmetric notches develop just below 2kHz. This performance is typical of the MTM geometry, and is actually one of its major advantages. This vertical off-axis response greatly reduces floor and ceiling bounces that tend to confuse imaging.
Figure 9 plots the average vertical polar response over a ±10° window.
This average tracks the on-axis response within 1dB out to 10kHz and is down only 1.6dB at 15kHz.
-----------------------
CRITIQUE
Reviewed by Dennis Colin
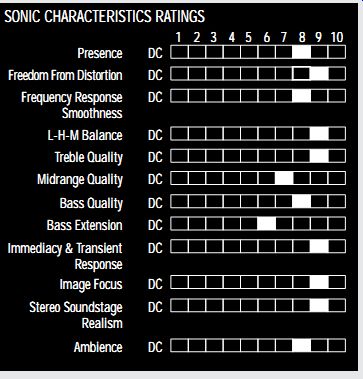
I judge the Froy speakers to be very good except for two factors: (1) thin-sounding bass and (2) a mild but "brassy" emphasis around 3-4kHz. The latter was not noticeable on all material. But on horns and strings, and sometimes on a well-recorded powerful voice, I heard some roughness or congestion, best describable as not so much frequency emphasis, but rather some harshness with confusion of detail in the upper midrange.
To put this into perspective, the overall sonic naturalness was about 80% of the way from the Adire speaker (which I highly criticized) to the THOR (which I thought second to none in tonal quality). On much material the Froys sounded very good. And on all material, the highest treble smoothness and general low-mid high balance were excellent.
Regarding image focus, soundstage realism, and spatial reproduction, these were outstanding, perhaps as good as the THOR (or at least very close).
SPECIFIC IMPRESSIONS
Turtle Creek Chorale--Voice very good, not quite as natural as with THOR; bass sounded thin but not colored.
A Chorus Line--Somewhat thin, upper mids slightly
"brassy," still good-sounding overall. Estimated bass extension to 60Hz.
Jacintha--Here, the voice midrange sounded natur al, but highs somewhat sibilant (roughness on "S" sounds).
Carmen, Percussion Fantasia--Bells excellent, super image focus and stereo staging; perceived some emphasis around 3-4kHz (est.).
Carmen Ballet--Good, neutral tonality throughout.
Beethoven Pastoral--Good, but bass was too thin.
Chopin -- Excellent piano rendition and presence.
COMMENTS ON MEASUREMENTS
Figure 2---The LF -3dB point of 72Hz explains the thin bass perfectly well. The mild peak at 4.5kHz might explain the emphasis heard (I had estimated 3-4kHz).
Figure 5A--Joe mentioned the ridge at 8.2kHz. This explains the sibilance on Jacintha's HF-rich voice. But I didn't notice this on other material. Rather, I think the pronounced long-decay ridge around 3kHz was what bothered me the most, more so than the mild 4.5kHz peak on the first-arrival frequency response (0ms top of waterfall, all Fig. 2). The former 3kHz "hashiness" of decay would be the most likely contributor, I think, for the upper-mid roughness or congestion I heard. Such a decay pattern would also likely obscure fine details.
Figure 5B--The woofers' 8.2kHz resonance, even though largely obscured on Fig. 2 by the crossover to tweeter, nevertheless was sometimes audible.
Figure 5C--Surprising here is the absence of the 3kHz ridge from the combined waterfall of Fig. 5A. If the long 3kHz decay isn't from the woofer, and most likely not from the excellent Millennium tweeter, where does it come from ?
My guess is (by process of elimination) that the crossover is causing some ringing (undamped resonance). While not evident in the overall frequency response, Fig. 4 (step response) might provide a clue. Notice from 3.4ms on the time axis to 4.2ms a small but nearly periodic wiggle, with cycle peaks around 3.4, 3.75, and 4.1ms. With a cycle period around 0.35ms, my alleged ringing frequency would be about 2.9kHz, close enough to the approximate 3kHz prominent ridge on Fig. 5A.
Or perhaps the tweeter LF rolloff area around 3kHz (Fig. 3), where you see a mild but fast 2.5kHz peak-to 2.9kHz dip transition, represents (I further speculate) a lack of tweeter damping by, say, too high a driving impedance at this frequency range.
Figure 6--This smooth, well-behaved polar rolloff is consistent with the excellent imaging and sound field reproduction.
Figure 7 ?Smooth overall. However, while the peak at 4kHz is small in dB value, you see a noticeable
"corner-like" effect. In my experience, such slope changing effects are audible.
RETROSPECT
I must reiterate that despite my having fun playing detective, the colorations noted were small on most material, and unnoticeable on some. The Froys are in most aspects excellent speakers. I believe that, considering the identical tweeter and similar woofers (to the THOR speaker), the Froy anomalies are crossover related.
I think the moral of this story is: If you want the best possible crossover, have Joe design it. I hope he receives permission from SEAS to do just that here; if so, I look forward to auditioning the result. But even as it is, the Froy (Mk3) speakers are very good; the SEAS' drivers are probably among the world's best.
-------------
SONIC CHARACTERISTICS RATINGS
HARMONIC DISTORTION
I ran harmonic distortion tests at an average level of 90dB SPL. Ideally, harmonic distortion tests should be run in an anechoic environment. In practice, it is important to minimize reflections at the microphone during these tests.
Out-of-phase reflections can pro duce false readings by reducing the level of the fundamental while boosting the amplitude of a harmonic. In order to reduce the impact of reflections, I placed the microphone at 0.5m from the loud speaker and gated response to largely eliminate later reflections.
Second and third harmonic distortions at 50Hz and 90dB SPL were 5.4% and 5.0%, respectively.
50Hz lies below fB, and 90dB SPL places quite a demand on these small woofers. However, all harmonic distortion falls below 1% above 100Hz, which is a very good result.
INTERMODULATION DISTORTION
I measured intermodulation distortion next. In this test two frequencies are input to the speaker.
Intermodulation distortion produces output frequencies that are not harmonically related to the ...
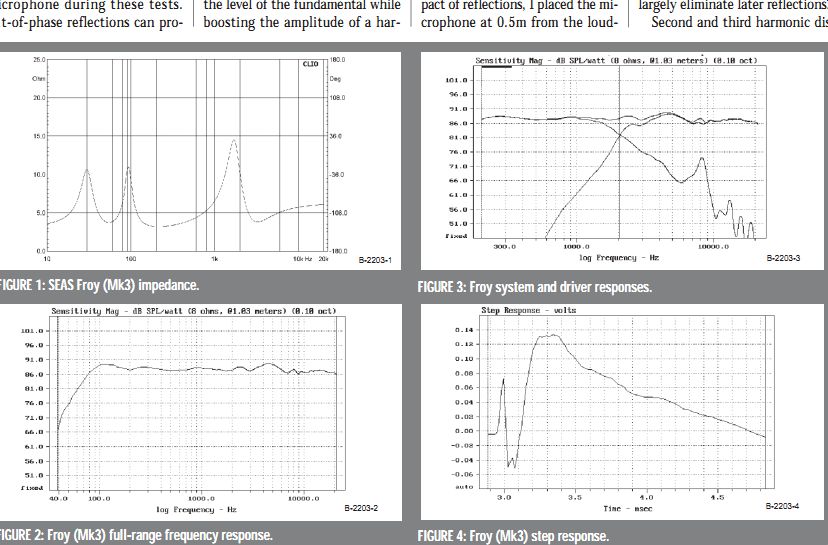
FIGURE 1: SEAS Froy (Mk3) impedance.
FIGURE 2: Froy (Mk3) full-range frequency response.
FIGURE 3: Froy system and driver responses.
FIGURE 4: Froy (Mk3) step response.
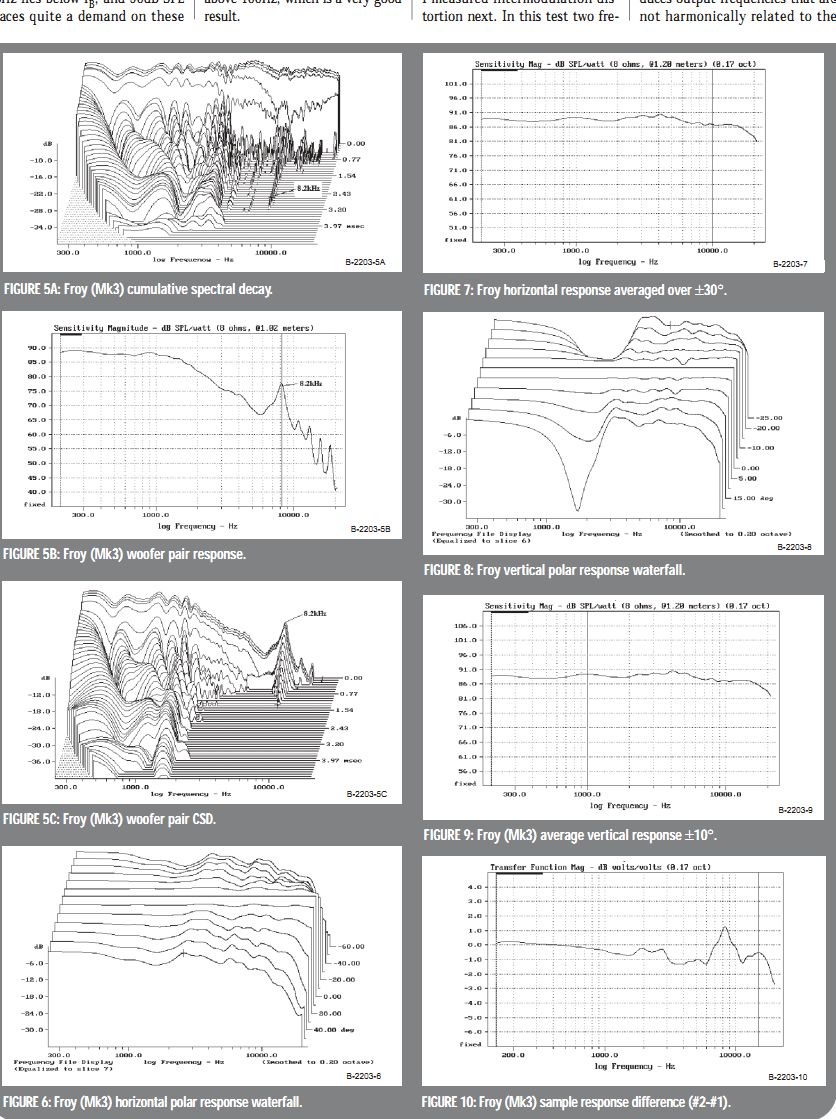
FIGURE 5A: Froy (Mk3) cumulative spectral decay.
FIGURE 5B: Froy (Mk3) woofer pair response.
FIGURE 5C: Froy (Mk3) woofer pair CSD.
FIGURE 6: Froy (Mk3) horizontal polar response waterfall.
FIGURE 7: Froy horizontal response averaged over ±30°.
FIGURE 8: Froy vertical polar response waterfall.
FIGURE 9: Froy (Mk3) average vertical response ±10°.
FIGURE 10: Froy (Mk3) sample response difference (#2-#1).
... input. These frequencies are much more audible and annoying than harmonic distortion.
Let the symbols f1 and f2 represent the two frequencies used in the test. Then a second-order non linearity will produce intermods at frequencies of f1 ± f2. A third-order nonlinearity generates intermods at 2f1 ± f2 and f1 ± 2f2.
I examined woofer intermods first by inputting 400Hz and 550Hz signals at equal levels.
These frequencies should appear predominantly in the woofer out put. Total SPL with the two signals was adjusted to 90dB at 1m. Significant woofer IM products appeared at 950, 1350, and 1500Hz.
However, the overall level was only 0.09%, an excellent result.
I measured tweeter intermods with a 9kHz and 10kHz input pair adjusted to produce an 87dB SPL at 1m. Because steady tones are used in the IM test, I thought it safer to use a lower power level to prevent possible tweeter damage.
The major IM product occurred at 12kHz. However, total distortion was only 0.07%, a very good result for tweeters.
The last IM test examines cross intermodulation distortion be tween the woofer and tweeter using frequencies of 900Hz and 10kHz. Ideally, the crossover should prevent high-frequency energy from entering the woofer and low-frequency energy from entering the tweeter. IMD products appeared at 8.2, 9.1, and 10.9kHz at an overall level of 0.05%. This is a very good result and indicates good inter driver isolation by the crossover.
SPEAKER MATCHING
All of the test results reported so far were obtained from a single sample. Now look at how well the two speakers match in frequency response (Fig. 10). The two Froy (Mk3) samples match quite well.
The second system is within ±1.3dB of the first out to 15kHz.
This bodes well for image stability.
CLOSING REMARKS
Many of the points raised in the test review may seem less than complimentary to the Froy (Mk3).
I mentioned them only to high light some of the subtleties that you can encounter in loudspeaker testing. On balance, the results reported here in the areas of frequency response, polar response, and distortion are very good. I suspect that auditioners will be very impressed with the Froys.
Manufacturer's Response:
Our sincerest thanks to Joe D'Appolito, Dennis Colin, and Ed Dell for their excellent in-depth review of the SEAS Froy Mk. III kit. We are generally in agreement regarding Joe's measurements and Dennis' listening evaluations, but there are a couple of points we would like to address.
Joe points to a discrepancy be tween the cabinet tuning frequency of the test samples compared with the Froys that were built and measured at SEAS. We, too, are puzzled by his results, as the fB of his systems were indeed 7-10Hz higher than ours. About the only thing we can point to is the possibility that the port slot openings in Ed's cabinets are slightly smaller than specified. This is quite critical, because even a very small change in the height of the slot will have a significant impact on the area of the port.
We also agree with Joe that the W15 CY001's 8.2-kHz resonance peak could have been better suppressed by the crossover's notch filter. Thankfully, this peak is at a rather high frequency, and is still sufficiently down in level to have minimal impact on the frequency response and distortion measurements of the sys tem. Still, we will revisit the crossover design in the future to see whether this aspect can be further improved.
Regarding Dennis Colin's listening critique, he faults the Froy in two areas: bass extension and a mild emphasis around 3-4kHz.
We believe the two are related.
While the overall balance of the Froy is basically flat, the lack of deep bass response will cause the system's perceived balance to be shifted more towards the upper end of the spectrum; i.e., it will sound a little bit bright.
Additionally, when comparing the horizontal dispersion characteristics of the THOR with those of the Froy, you will find that the Froy's smaller woofers are capable of generating considerably more energy off-axis in the presence region than those of the THOR. The audible result of this--especially in rooms that are somewhat live--will be an in creased perception of upper midrange/lower treble energy.
John Stone, SEAS USA
REFERENCES
1. J. D'Appolito, Testing Loudspeakers, Audio Amateur Corporation, Peterborough, NH, 1998.
2. J. D'Appolito, "THOR: A D'Appolito Transmission Line," audioXpress, May 2002, pp. 8-26.
A NOTE ON TESTING:
The Froy (Mk3)s were tested in the lab oratories of Audio and Acoustics, Ltd. using the MLSSA and CLIO PC-based acoustic data acquisition and analysis systems. Acoustic data was measured with an ACO 7016 ¼” laboratory-grade condenser microphone and a custom designed wideband, low-noise preamp.
Polar response tests were performed with a computer-controlled OUTLINE turntable on loan from the Old Colony Division of Audio Amateur Corporation.
EDITOR'S NOTE:
A careful measure of the ports in the Froy cabinets confirms that they are exactly as specified, one-half inch between the two panels, contrary to SEAS manager John Stone's comment.
----
Also see:
BUILD A PLASMA TWEETER---Here's a hot idea--ion tweeters you can build to reproduce high frequency sound that's clean, clear, and totally non-directional.