This article offers detailed test data and separates fact from fiction regarding electrostatic speaker construction methods and interface options.
By Matthew L.
This project began several years ago as a quest for the highest output possible per unit area from an electrostatic loudspeaker (ESL). As testing progressed, it became apparent that I needed to evaluate most of the common build methods over broad operating ranges and compare the test results to accepted rules of thumb and basic ESL theory.
WIRES, LOTS OF WIRES
Having read several articles that suggest wire-based stators produce the most output for a given input voltage, I started building small speakers using the methods avail able to the average DIY'er. This involved low-tech construction techniques and rudimentary acoustical tests. It quickly became apparent that determining the true limits of these units would require tight build tolerances and the ability to perform accurate acoustical tests rapidly. So, with the help of friends and the purchase of new hardware, I produced several highly adjust able test platforms.
Figure 1 shows an exploded view of the framework used during the tensioned wire tests (wires not shown for clarity). The frame was 0.25” aluminum plate with captive bolts that allowed the diaphragm-to-stator spacing to be adjusted from 0.024” to approximately 0.5”. The diaphragm was the typical 0.0005 ” Mylar with a high resistance graphite coating. The conductive portion of the diaphragm was 2.5 ” by 2.875 ”. I used the same central frame and diaphragm with the perforated metal and screen stators that are presented later in the article. Photo 1 shows the assembled stator frames with the tensioned wires in place.
I strung 28 AWG bare copper wire (0.0126 ” nominal diameter) on 0.0625
” centers between CNC laser cut PETG stretchers. This configuration produced
an open area of 79.8%. The lacing pat tern and termination produced three
circuits that could be used to energize the wires on 0.25 ”, 0.125 ”, and
0.0625 ” centers. Photo 2 shows a closeup view of the stators from both
sides.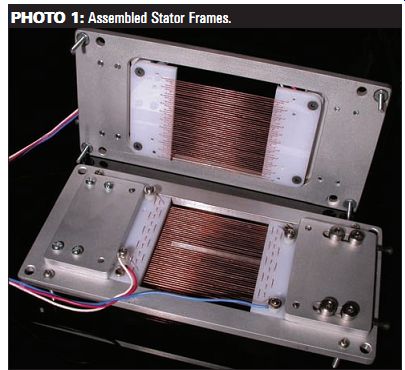
PHOTO 1: Assembled Stator Frames.
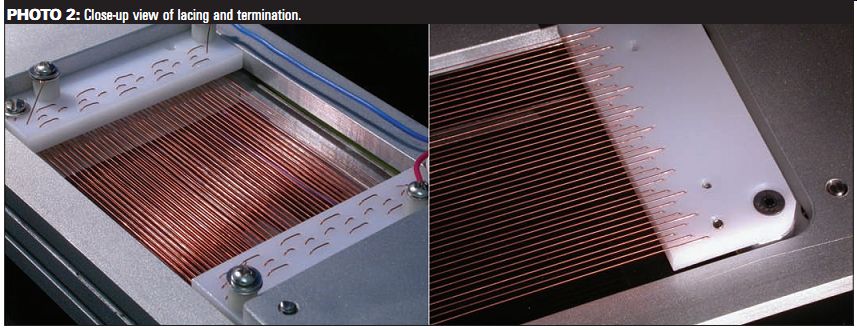
PHOTO 2: Close-up view of lacing and termination.
I used the full width (~2.52 ”) of the wire array in each electrical configuration and made the diaphragm's conductive area smaller than the stator in the other direction to eliminate variations in the overall driven area that would have resulted from the staggered hole patterns used to route the wires. I brought the wire under tension by tightening the two bolts that are perpendicular to the four shoulder bolts toward the top right of Fig. 1. When I achieved the desired tension, I clamped the sliding plate in place with the shoulder bolts.
Photo 3 shows the finished, assembled unit.
Beaming at high frequencies and dipole cancellation at low frequencies cause the characteristic increase in output with increasing frequency seen in the measured data. I made no at tempt to eliminate these traits. The frequency response plots in this article also reveal irregularities in the high frequency output that seem related to the spacing of the stators.
I think these were a result of the cavity formed between the PETG stretchers and other framework over undriven portions of the diaphragm, which continued for approximately 1.375” beyond the conductive portion of the stator.
When the spacing was at its minimum, the high frequency range was much smoother. The variations in the test data at low frequencies are due to back ground noise fluctuations and have no significant effect on the frequency used to compile summaries, illustrate trends, and compare theory and practice. The lowest valid frequency (and the resolution) based on the gating used is 318Hz.
Arcing between conductive frame elements in the tensioned wire speaker limited its use to spacings of 0.183 ” and below (for the two units presented later, more typical corona and arcing issues from the stators to the diaphragm stopped testing beyond 0.153 ” for perforated metal and 0.164 ” for screen). I intended to use a fully insulated frame work, but the appropriate plastics are quite expensive and the machine work would have been much more complex.
So I settled on a conductive frame, thinking that even if the spacing is somewhat limited, it will surely be sufficient for the required tests. As usual, most projects don't go as smoothly as originally planned.
THEORETICAL VALUES
For those on the great equation hunt, please note that finding accurate information can be challenging. The proliferation of information in reprints and web pages is beneficial because it simplifies searches, but it can be a real problem when people are not careful during transcription. I prefer not to think of all the time I have wasted trying to understand formulas that contained errors. Finding suitable equations for this article was no different. I suggest running simple numbers through any new equations you find to make sure the answers are sensible before putting too much faith in them.
Most of the errors I found when researching this article were large and relatively easy to find once I had a general feel for what the answers should be. My original intention was to include equations that gave force values in common units and considered the diaphragm in motion under constant charge conditions, but I decided against using them. They are significantly more complicated than those that follow, and because relative numbers are my main concern, the added complexity does not provide
-------- 4
great benefit for the topics at hand.
Since no one has treated the subject lately, I must go back several years for a simple formula that defines the relationship between diaphragm-to-stator spacing, bias voltage, audio signal voltage, and force acting on the diaphragm.
Peter J. Walker presented these topics succinctly in a May 1955 Wireless World article titled “Wide-Range Electrostatic Loudspeaker ” (included in Ron Wagner's Electrostatic Loudspeaker Design and Construction). Equation 1 comes from that article and can be used to give relative force values under different physical and electrical conditions (this equation is too simplistic to use for the speaker in dynamic conditions, so the following examples assume the diaphragm is centered between the stators).
F = ((E + e/2)/d2)2 - ((E - e/2)/d1)2 (1)
where F = force per unit area acting on the
diaphragm E = bias voltage e = applied audio signal voltage d1
= distance from the diaphragm to
stator 1 d2 = distance from the diaphragm to
stator 2
If you use numbers that give very simple results, some basic relation ships will become obvious. Doubling the applied audio signal voltage while holding all other attributes constant gives the following :
You can use equation 2 to calculate the difference in decibels (dB) between two voltages when the impedance is held constant dB = 20 log (V1/V2) (2) By plugging the audio voltages from the first three scenarios into equation 2, you note a 6dB rise in output each time the audio drive voltage is doubled --a well-known phenomenon.
You also see that a doubling of force occurs when the audio drive voltage is doubled. Because the same ratios are produced by comparing forces or voltages, you can use the force on the diaphragm (calculated with equation 1) for different drive and physical conditions in equation 2 to determine the theoretical difference in output between 2 ESL designs.
BIAS VOLTAGE INCREASES AND THEIR EXPECTED CONSEQUENCES
In the following cases the bias voltage is doubled. Using the calculated force values in equation 2 shows that each
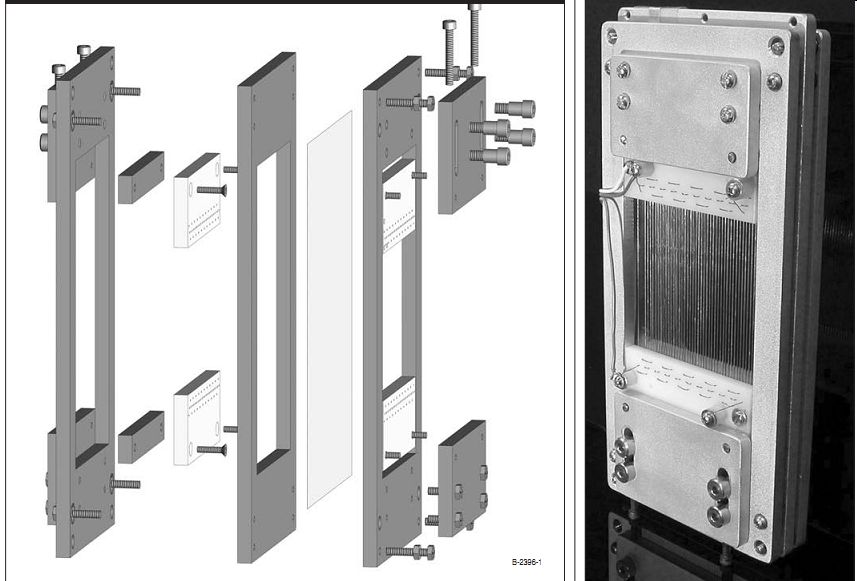
FIGURE 1: Exploded view of speaker frame.

PHOTO 3: Finished unit.
doubling of bias voltage (while holding the other parameters constant) should give a 6dB rise in output (up to the point where significant leakage and/or arcing begin to influence the system).
E = 1 e = 1 d1 and d2 = 1
Force = 2 E = 2 e = 1 d1 and d2 = 1
Force = 4 E = 4 e = 1 d1 and d2 = 1
Force = 8
To check this theory, I tested three speaker configurations with varying bias voltages. The bias levels are stated in volts per mil of diaphragm to stator spacing, which shows output differences between speakers more clearly and allows a wide range of data to be presented in a compact graph. The data is presented in Figs. 2-4.
Figure 5 summarizes Figs. 2-4 by showing the output at 1002.4Hz for each test condition. Since you expect a fixed increase in output for each doubling of bias, using a logarithmic axis for bias voltage helps present the data in a clearer fashion. It shows that 33 of the 34 points used in the summary graph correlate fairly well with theory. The error in the lowest point on the graph is believed to be noise related (the level was quite low in that configuration).
WIRE SPACING
In any electrostatic speaker you must balance the benefits of conductive area and open area in the stator. Maximizing the open area will present the least acoustical resistance to the diaphragm, but a 100% open stator doesn't leave any room for conductors. On the other hand, maximizing the conductive area will en sure that the electrical field produced by the stator at the diaphragm is uniform and that the force it produces is perpendicular to the diaphragm over its entire surface. When carried to the extreme you wind up with a solid plate that will not let any sound out--obviously undesirable when you are designing a speaker.
While many patents and articles use the generic suggestion that stators need to be acoustically transparent, Harold Beveridge's US Patent 3,773,976, which was granted in 1973, listed his preferred open area as approximately 25% (on the side of the stator near the diaphragm and approximately be cause the size of the unperforated area between the slots was not specified).
Arthur Janszen's US patent 3,800,102, which was granted in 1974, gives a stator example with 39.5% open area. The Janszen designs typically pushed the limits of efficiency through small spacing and intricate stator construction.
There was also a specific suggestion of 37% open attributed to David Hermeyer in “The Sanders Electrostatic Speaker” published in 1975 in The Audio Amateur and reprinted in Audio Amateur Loudspeaker Projects. While this was presented as Hermeyer's suggestion for
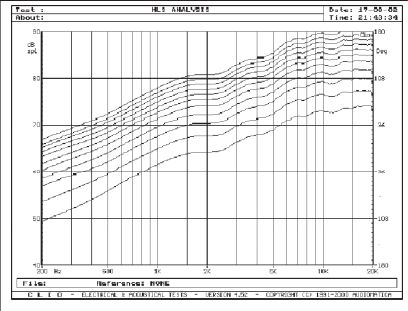
FIGURE 2: Diaphragm-to-stator spacing 0.024 ” with 10-60V/mil bias--wire spacing 0.0625 ”.
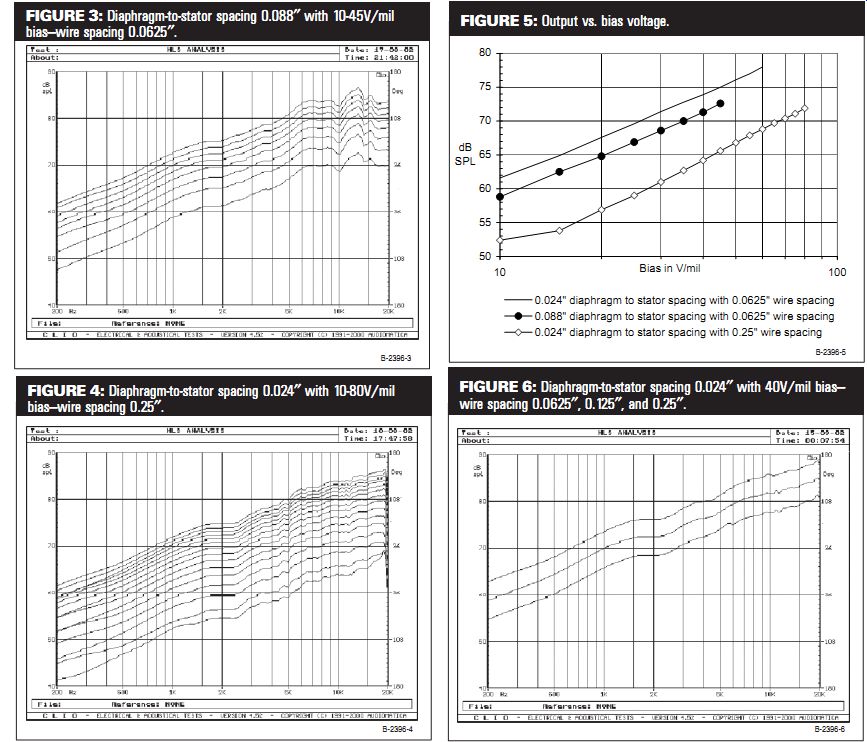
FIGURE 4: Diaphragm-to-stator spacing 0.024 ” with 10-80V/mil bias-wire spacing 0.25 ”.
FIGURE 3: Diaphragm-to-stator spacing 0.088 ” with 10-45V/mil bias-wire spacing 0.0625 ”.
FIGURE 6: Diaphragm-to-stator spacing 0.024 ” with 40V/mil bias- wire spacing 0.0625 ”, 0.125 ”, and 0.25 ”.
FIGURE 5: Output vs. bias voltage.
GROUND RULES
1. Unless another transformer is specifically named in a test, I used the Plitron PAT-4134-ES.
2. Turns ratios on transformers can be stated in several ways: step-up ratio (50:1 or just 50), turns ratio stated as number of primary turns: number of secondary turns ( 1:50), turns ratio stated as number of secondary turns: number of primary turns (50:1), impedance matching specification (4 ” primary, 10 k-ohm secondary), or just a stated turns ratio (50:1)
with no concern about which is the primary or secondary since they can often be swapped without harm. They all mean the same thing and are initially a bit confusing be cause they become mixed and matched in nearly any way you can imagine. I normally use the number of primary turns:number of secondary turns ( 1:50), which is the way the device is hooked up. It's not necessary to know the actual number of turns; the ratio is what you need (unless you are designing the transformer).
3. 1 mil is 0.001 ”.
4. In this article the term “spacing ” used alone refers to diaphragm to stator spacing. “Wire spacing ” and “wire density ” refer to the center-to-center spacing of the conductors in the wire stators.
5. Diaphragm-to-stator distances are measured from the nearest conductive part of the stator.
6. This article does not deal with any insulated designs.
Insulation normally allows the device to be operated with higher voltages, but the electrical characteristics of the insulation can be quite complex and problematic in designs that push the operating limits of these speakers.
7. Some authors refer to the stationary parts of the speaker as plates, while others use the term stator. If I'm talking about a capacitor or dealing with a characteristic of the speaker that relates to it being a capacitor, I tend to use plates. The rest of the time I normally call them stators, simply because it seems to be the term that is currently favored.
8. The test signal (type and level), gating, and physical conditions were as constant as possible in a home environment for all of the frequency response based tests in this article.
the ideal open area, most DIY information available today implies that this is a minimum value for acoustically trans parent stators and that more open area is better as long as the hole size or wire spacing is relatively small ( “small ” is discussed later).
Hermeyer's 1977 article, “A High Efficiency Electrostatic Loudspeaker System, ” originally published in The Audio Amateur and reprinted in Audio Amateur Loudspeaker Projects, used perforated metal with 0.125 ” holes on 0.1875 ” staggered centers, which gives 40% open area. Later you will see that the use of open areas in this range by both Janszen and Hermeyer in ESLs intended for high output is still worthy of careful consideration today.
A hole size or wire spacing no greater than the diaphragm-to-stator spacing is another generally accepted rule for do-it-yourself ESLs. For a given stator design, as the distance from the stator to the diaphragm is decreased, the force being applied to the diaphragm under the stators' open areas decreases relatively (i.e., when the force under open areas is compared to the force directly under the conductors) and deviates further from perpendicularity. David Hermeyer's 1972 article, “An Electrostatic Speaker System, ” originally printed in The Audio Amateur and republished in Audio Amateur Loudspeaker Projects, listed this phenomenon as a possible source of distortion.
The earliest paper I have found that attempts to explain the reasoning be hind the idea from the preceding paragraph is Charles I. Malme's “A Wide Range Electrostatic Loudspeaker ” printed in the Journal of the Audio Engineering Society Vol. 7, Number 1, p. 47 (1959). This paper was included in the first edition of Ron Wagner's Electrostatic Loudspeaker Design and Construction, but is not in the second edition. Much of the article is covered in US patent 3,014,098, which was granted to Malme in 1961. In the paper and patent Malme states (I'm paraphrasing a bit) that the capacitance of an array of parallel wires in a plane parallel to a plate is approximately equal to that of two similarly sized and spaced parallel plates until the distance between the wires is appreciably larger than the distance between the wire array and plate.
He then uses this idea to set the distance between the metal rods in his design. I imagine this was also the origin of the general rule that you should not have openings larger than the diaphragm-to-stator spacing in other types of stators.
If these two general rules are accurate, you should be able to space ine wires at a center-to-center spacing equal to the diaphragm-to-stator pacing to produce very high open area and high output, so that's what tried. I ran a series of tests starting at 0.024 ” diaphragm-to-stator spacing with 0.0625 ”, 0.125 ”, and 0.25 ” wire spacing. I increased the spacing (along with the bias voltage to hold the bias in V/mil constant) and tested the three wire spacings again. This continued through diaphragm-to-stator spacings up to 0.183 ”.
Figures 6-11 present the data collected from these 18 ESL configurations.
Going back to equations 1 and 2, you can analyze the effect of halving the spacing while holding the bias voltage per mil of spacing and the applied audio signal constant.
E = 1 e = 1 d1 and d2 = 1 Force = 2 E = 0.5 e = 1 d1 and d2 = 0.5
Force = 4
A doubling of force is produced and a 6dB increase in output is the result.
The 6dB increase will occur only if the density of the stators' conductors is high enough to allow the spacing to be halved while maintaining electrical field conditions at the diaphragm.
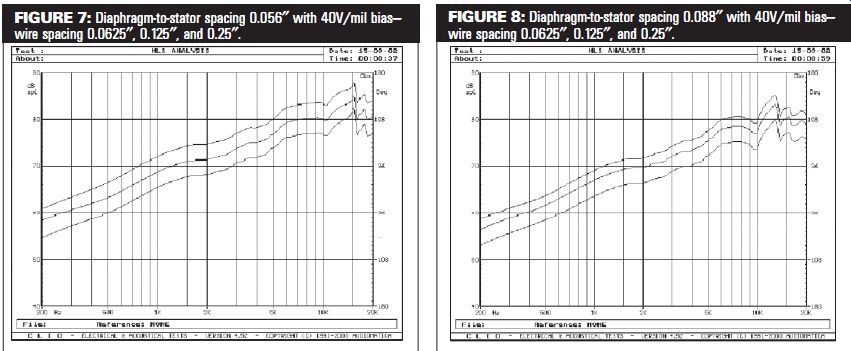
FIGURE 8: Diaphragm-to-stator spacing 0.088 ” with 40V/mil bias- wire spacing 0.0625 ”, 0.125 ”, and 0.25 ”.
FIGURE 7: Diaphragm-to-stator spacing 0.056 ” with 40V/mil bias- wire spacing 0.0625 ”, 0.125 ”, and 0.25 ”.
To summarize this data, I took the output at 1002.4Hz for each configuration and produced Fig. 12. The dashed line represents the theoretical 6dB increase in output for each halving of the diaphragm-to-stator spacing. If the rule of thumb held, the data from 0.0625 ” and 0.125 ” wire spacing would have converged at a diaphragm-to-stator spacing of 0.125 ”. Since this didn't hap pen, I made the theoretical line inter sect the measured data at the highest wire density and largest spacing because this configuration should behave the most like an ideal speaker.
From the summary graph, it be comes obvious that there are a couple of data points that are not following the general trends. While I don't like fudging data, without an anechoic chamber and far more expensive equipment, there will occasionally be errors that need to be “corrected.” Where the data showed obvious, abnormal deviations from expected values, I made the following changes to smooth the curves and produce the graphs that follow.
0.056 ” spacing with 0.125 ” wire spacing +0.5dB
0.151 ” spacing with 0.25 ” wire spacing +0.7dB
The modified data is presented in Fig. 13.
I ran this series of tests several times to ensure that these were valid corrections of measurement error and that the modified data reflected the speaker's true performance. I could have made additional small corrections to produce even prettier graphs, but I wanted to present the data with as few changes as possible.
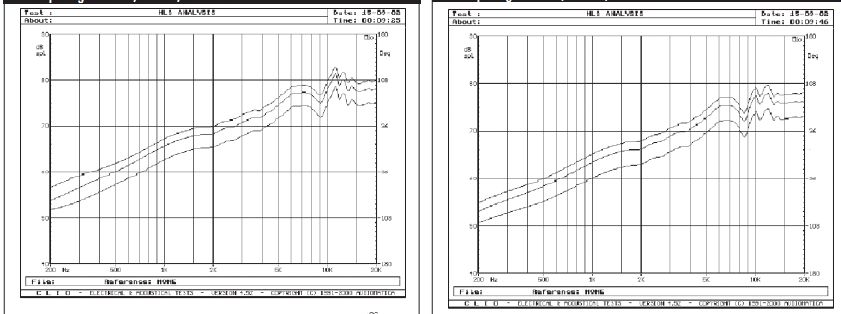
FIGURE 9: Diaphragm-to-stator spacing 0.119 ” with 40V/mil bias- wire spacing
0.0625 ”, 0.125 ”, and 0.25 ”.
FIGURE 10: Diaphragm-to-stator spacing 0.151 ” with 40V/mil bias- wire spacing 0.0625 ”, 0.125 ”, and 0.25 ”.
Summarizing the data in yet another way and giving what may be the most useful representation, Fig. 14 shows the advantage the smaller wire spacings have over the base design (0.25 ” wire spacing) at different diaphragm to-stator spacings. You can estimate the penalty in output that results from simplified construction at lower wire densities for a wide range of typical de signs with this graph.
My original goal was to find the specific ratio of wire spacing to diaphragm-to-stator spacing, in which in creasing the wire density stopped in creasing the output, but I did not reach that point in the testing. I also hoped to determine the relationships between output, capacitance of the speaker, and theoretical capacitance with solid plates, but the capacitance of the speaker at large spacings was so small that it could not be measured reliably.
OTHER BUILD METHODS
Since things didn't go exactly as planned with the wire density tests, I decided to add two other typical construction methods to the mix. Keeping the central frame and diaphragm the same as used in the wire-based test series, I included new stator frames to produce spacings similar to those used with the wire stators. The stators' widths were the same as the wire-based design, and the length was the same as the shortest wires (as stated earlier, the diaphragm's conductive area was smaller in this direction to eliminate the effects of the different wire lengths).
An extension of the wire-based de sign is the use of aluminum window screen adhered to an egg-crate style fluorescent light diffuser. This method appears attractive because it produces high wire density and a moderate percentage of open area with less work than a typical wire stator. I used 3M super 77
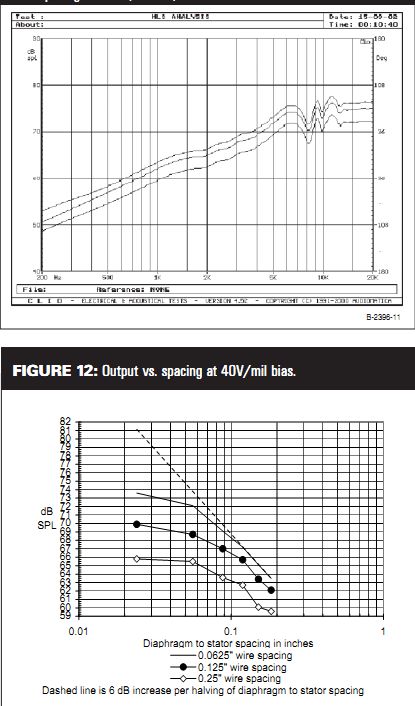
FIGURE 11: Diaphragm-to-stator spacing 0.183 ” with 40V/mil bias-wire spacing
0.0625 ”, 0.125 ”, and 0.25 ”.

FIGURE 12: Output vs. spacing at 40V/mil bias.
Diaphragm to stator spacing in inches
0.0625 ” wire spacing
0.125 ” wire spacing
0.25 ” wire spacing
Dashed line is 6 dB increase per halving of diaphragm to stator spacing
spray adhesive to glue the screen to the diffuser, which was composed of
0.5 ” square openings and 0.06 ” ribs and had an open area of 79.7%. The screen was made of 0.010 ” diameter wires that were spaced on 0.056 ” centers in one direction and 0.066 ” centers in the other. This gave an open area of 69.7% for the conductive portion of the stator.
Combining the screen and grid gives an open area of 55.6%. Photo 4 shows the finished speaker.
Many people prefer to use perforated metal stators because they are simple to design and build, but the idea that they produce less output than wire designs is put forth often.
The perforated metal version I built used 0.018 ” thick aluminum with 0.125 ” holes on 0.1875 ” staggered centers for an open area of 40%. Photo 5 shows the finished speaker.
As in the previous cases, the bias level was 40V/mil of diaphragm-to-stator spacing during these tests. The screen based speaker produced the frequency response curves shown in Fig. 15 for spacings from 0.034 ” through 0.164 ”. The results for the perforated metal unit for spacings of 0.026 ” through 0.153 ” are shown in Fig. 16. Figure 17 summarizes this data and presents it with the results from the wire stator tests.
From what I had read about stator
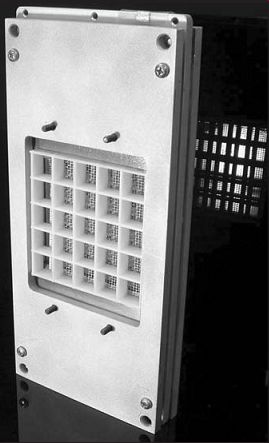
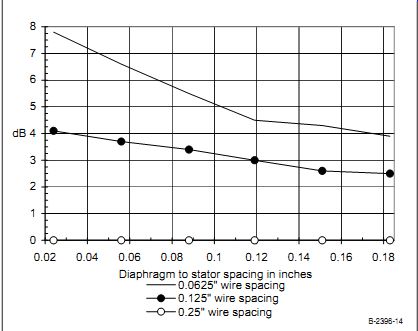
PHOTO 4: Screen stator.
FIGURE 14: Increase in output compared to 0.25 ” wire spacing.
design, I expected the screen version to have the highest output, with the tensioned wire design with the highest wire density coming in second. My reading also led me to expect the perforated metal version to perform moderately at high spacings and poorly at small spacings. As shown in the tests, the perforated metal version had the most output across the board and had a sizeable advantage at the smallest spacings. The screen model had output comparable to the highest wire density tensioned unit until 0.07 ”, but lost to the tensioned wire unit below that point; again, not what I expected.
My theories about why the screen and wire versions did not perform as well as expected:
1. The most efficient application of force to produce diaphragm movement occurs when that force is applied in a direction perpendicular to the diaphragm. Designs with open area toward the lower end of the suggested ranges are guaranteed to have a significant portion of the diaphragm being acted on in this fashion. From the data gathered, it appears that wire spacing should be
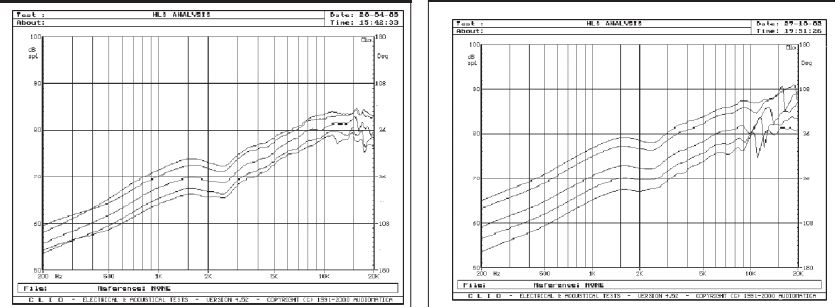
FIGURE 16: Perforated metal stator at 0.026 ”, 0.058 ”, 0.090 ”, 0.121 ”, and 0.153 ” diaphragm-to-stator spacing with 40V/mil BIAS.
FIGURE 15: Screen stator at 0.034 ”, 0.069 ”, 0.101 ”, 0.131 ”, and 0.164 ” diaphragm-to-stator spacing with 40V/mil bias.
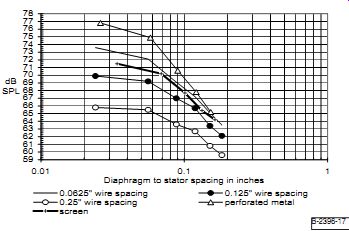
FIGURE 17: Output vs. spacing at 40V/mil bias.
approximately one-half to one-third of the diaphragm-to-stator spacing if maximum output is desired and small wire is being used to keep the percentage of open area high.
Designing for lower open area with larger diameter wire and larger center-to-center spacing may produce the same results, though I have not tested this idea. Since the 40% open perforated metal stator had the highest output in the tests here, that still seems to be a logical design goal. I don't claim to have all the answers though; the relationships between open area, wire diameter, hole/gap size and pattern, and output need to be tested further to accurately predict stator performance.
2. Since the screen is woven and the nominal spacing is referenced from the nearest point of the conductors, there is a significant portion of the stator's overall conductive area that is farther away from the diaphragm than the stated value. At small spacings this difference in distance can become significant. Number 1 also applies to the screen.
A particular insulation method, ease of panel division or construction, or some other issue may be a larger factor in your
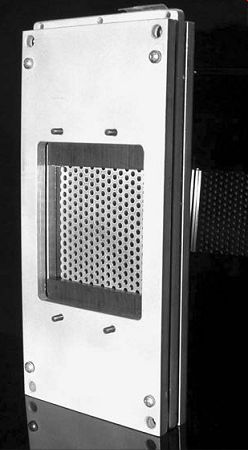
PHOTO 5: Perforated metal stator.
decision making process than dBs, but if output is your only concern, then the perforated metal seems to be the winner.
Next month, the author continues his search for the ultimate ESL design and includes a survey of typical transformer options and their implementation. xyz
[The discussion above is adapted from an article, June 2005, outlined in xyz ]
Also see:
Electrostatic Loudspeaker Basics, Part 2