“One man's meat is another man's poison”. Nowhere is it more true than in the choice of loudspeakers. What features do you look for in a loudspeaker? Very likely they will be quite different from those chosen by your neighbor.
The perfect loudspeaker, reproducing exactly the sound field obtaining at the original performance does not yet exist.
Many of the requirements are incompatible when applied to practical loudspeaker design. If we want one we must sacrifice another. The designer usually tries to effect a compromise, giving us some of both as far as that is possible. One designer may favor one characteristic and so slant his design in that direction, while another may consider the other to be of greater importance.
This being so, we will consider the main parameters and how they may affect the choice of a loudspeaker. When buying a ready-made speaker the choice may be confusing, but at least you can listen to what is on offer and maybe use a pair for a trial period in your home before deciding. It is, incidentally always wise to do this, as first impressions may not endure, or the speakers may sound quite different in the acoustics of your living room, running from your amplifier, from how they sounded in the dealer's showroom.
When you consider building to a published design or even trying your hand at your own design, you have no means of telling how it will sound until he job is complete. Then it is too late to change, so it is necessary to first analyze what parameters are important to you and what design factors will produce those parameters. You are then more likely to end up with speakers that more or less satisfy your priorities.
Cost
A necessary consideration this, but not too choice-restricting, because the most costly items, the wood and the drivers do not vary much between designs of comparable power handling and size. As large savings can be made over commercial ready-made equivalents, even the more costly DIY speakers work out to be quite reasonable. Horn or transmission line speakers will be more expensive than infinite baffle or reflex enclosures because of the extra wood needed. However, most large timber merchants sell cheap off-cuts. As the partitions are concealed inside the enclosure, any grade of plywood can be used for them, and off cuts can often be used at considerable cost saving.
Size
A consideration that overrides many others is that of size. The majority of modern living rooms can hardly be described as spacious. What space there is usually well filled, and accommodation for two large speaker enclosures along with the amplifying/radio/disc/tape playing equipment is in most cases very limited. Of recent years there has been competition also from other home entertainment devices such as television, video recorders, computer games, along with keyboard musical instruments which are becoming more popular.
Usually, the larger the enclosure the more extended the bass response. Many small enclosures have a bass response that sounds remarkable, but the laws of physics cannot be circumvented, it is just not possible to reproduce deep bass with a small enclosure. In such cases the makers have most likely adopted a Q that gives a hump in the response at the resonant frequency. This apparently gives plenty of bass, but closer listening reveals that it is boomy and indistinct. If the Q is so chosen that the hump is avoided, the results are more natural but the sound is rather lacking at the bottom end of the scale.
A further disadvantage of the small enclosure is that small volume of enclosed air behaves as a harder 'spring' than a large volume, against which the cone must work. So non-linearity of cone motion is greater, producing more distortion, and sensitivity is likely to be less.
So while some remarkable bookshelf designs have been produced that make the very best of the limited space available, the results cannot be compared with much larger floor standing models of comparable quality. This is true of the popular infinite baffle type, and in the case of horn or transmission line enclosures, even more space is required.
The best course then is to avoid the very small units if at all possible, and go for the largest you can accommodate that is appropriate to your room size. The latter proviso is not just a concession to necessity but has a practical basis. The amount of bass that can be fully developed in any listening room depends on the room size. The lowest frequency that can be produced is governed by the longest room dimension and is given by:
f =560 d
... in which f is the lowest frequency, and d is the longest dimension in feet. So a 12 ft dimension limits the response to 46Hz. It follows then that throwing out other furniture to make room for large speakers that go well below the room's frequency limit does no good at all!
If the average living room space situation is analyzed though, it will found that the problem is not so much total volume as floor area. The speakers can be tall as long as they do not take up too much space on the carpet. A column-like enclosure thus offers the best prospect of large volume with small floor area, but for a sealed unit could suffer from strong pipe resonances. However, there are some good designs using this shape and the Kapellmeisters described later is one example.
Frequency Response
A wide frequency response is usually considered a top priority, and most commercial models vie with each other in getting the widest range possible in their specs. A wide range is indeed desirable and within certain limits essential for hi-fi, but it can be overdone, especially if it is at the expense of other features.
Considering the high frequencies first, these are necessary to give the brilliance and sparkle to music; they convey the sense of presence and are essential, along with correct phasing, for good stereo imaging. Without them, music sounds dull as though heard through a heavy curtain. It becomes difficult to distinguish some instruments, especially in the woodwind section.
The response needs to go a lot higher than the frequency of the highest note likely to be played, because it is the harmonics that give all these effects. These are multiples of the fundamental frequencies generated by the musical instruments and can extend nearly to the upper limit of human hearing.
Of the 24 frequency bands into which the human ear splits up all received sound and transmits them to the brain, the center-frequency of the highest is 13.5 kHz. Its upper limit extends to about 16 kHz, but only in the young, the upper response falls over the age of 20, increasingly so over the age of 30. At 40, the 8 kHz response is some 10 dB less (a third) of what it is at 20, while at 50 it is 20 dB less. The high quality f.m. music radio broadcasts in the U.K. have as their upper limit, 15 kHz. which is thus seen to be more than adequate.
The 20 kHz response of the compact disc is a case of allowing a very wide margin over the top. No one can hear that high (except the dog) and few could get within many kHz of it.
A response above 15 kHz can therefore be considered superfluous, and should certainly not be achieved at the expense of other more important things. This calls into question the use of tweeters and especially additional super-tweeters with all the drawbacks described in the last section.
Now to the bass region. The lowest note produced by any orchestral instrument is 29Hz, from the contra-bassoon, while piano goes down 27.5Hz. Actually, it only rarely that those instruments get down that far. When they do, spectrum analysis reveals that the fundamental is very weak anyway, and most of the character is imparted to the tone by the harmonics.
The lowest harmonic which is the second, is in the above cases 55 Hz and 58 Hz respectively. The bass drum (not the tympani) is about the only orchestral instrument that really needs a deep bass response to do it justice, as it has few harmonics beyond the starting transients.
Although it may be desirable then, to reproduce down to the lowest frequencies, it is by no means essential. In fact sub-bass response can reveal rumble, record warp, and even subway trains passing near the studio! So while a bass response within a few dB down to 45 Hz can be considered desirable to give depth and richness to the reproduction, little is gained by going lower. An even higher limit can often be preferable to a lower one gained at the expense of naturalness. As noted above, the listening room dimensions may not permit the propagation of bass much lower than this anyway.
Now a word about the measurements themselves. Accurate frequency response measurements are not possible unless you have a large anechoic room, that is one that completely absorbs all sound produced within it and reflects none. Only the larger speaker manufacturers and audio laboratories have such a facility. Any response measurements attempted in any other environment except an open field are wildly inaccurate due to multiple reflections causing cancellation and reinforcement at various frequencies. Just moving the measuring microphone a few inches can cause up to a 20 dB difference in the reading at one frequency and little if any at another. Furthermore the size of the room limits the lower bass response as we have noted before.
Some loudspeaker reviewers occasionally publish graphs that were made 'under typical living room conditions', meaning their own living rooms, and try to justify them by the comment that no-one listens in an anechoic room. True, but irrelevant, no-one will be listening in the reviewer's living room either, and moving the speakers or the listening position by quite a small amount can completely change the measured response.
It is possible though, to make a fairly accurate response plot by measuring each frequency several times with the microphone in a different position, and also the speaker. The readings for each are averaged and any that are wildly different are obviously the effect of interference and are rejected. The same combination of positions is used for every frequency.
The process is a long and laborious one and does not equal the accuracy of the anechoic room measurement, but it can give results that co-relate reasonably with it. It will give the overall shape and range of the plot quite accurately, if not all the individual small peaks and dips.
Another method of speaker response measurement in an ordinary room is the use of pink-noise filtered into +- octave bands. This is how it works.
If an f.m. radio that does not have interstation muting is detuned, a hissing sound is heard. This is made up of random frequencies covering the whole audio frequency spectrum, just as white light is made up of all other colors. For this reason the noise is termed white-noise. It has on average, an equal amount of each frequency, so as each octave has double the number of frequencies as all those below it; most of the energy is concentrated in the upper octaves. This is the reason for the characteristic 'hissy' sound.
White-noise can be filtered to alter its content so that there is an equal amount of energy in each octave rather than at each frequency. It thus contains more low frequencies than white noise and so is called pink-noise. It is invaluable where the use of individual frequencies for measurements may be misleading. Speaker sensitivity measurements for example, need to relate to the average sensitivity to all frequencies not just to one, so pink-noise is used.
It can also be used to a limited extent for frequency response testing splitting the noise up into +- octave bands, then measuring and plotting the result. Instead of a line plot on the graph paper, the response is shown as a series of blocks or bars on the graph.
The advantage is that a group of closely related frequencies are less affected by interference effects than single frequencies, so tests can be made in an ordinary room.. While this is so, the result is still affected by the room acoustics due to the narrow bands used. Wider bands would be less affected, but would give a coarser resolution. As it is, the plot which consists of a bar chart, does not reveal the sharper peaks and dips in the response.
A reasonably accurate frequency response plot, however derived, can give an idea of how the speaker will sound although it does not present the whole picture. Minor deviations from a flat response plot are to be expected and have little effect on the sound, but larger ones most probably will. A hump just before a sharp bass roll-off will result in a boomy 'one note' bass; far better is a gentler slope starting higher up. Peaks in the mid-range or treble can give an artificial brilliance but be tiring to listen to for any period.
Phasing
Phase distortion, that is phase differences between frequencies that were not present in the original, do not seem to have a noticeable effect on the quality of the sound itself.
They do affect the stereo image which can be blurred or even rendered totally indeterminate except for the extreme left and right positions. The distortion is produced in all, but more particularly, the higher order crossover networks. Spatial differences between tweeter and bass driver also change the phase relationship and this varies too, according to the listening angle from the front axis of the speaker.
For better stereo imaging, a single full-range speaker, co-axial speaker, or a piezo tweeter that needs no crossover circuit should be used. If a conventional tweeter is desired, a simple crossover consisting of a first order filter for the bass and a second order for the treble will minimize phase distortion as well as ringing, but there may be a frequency response anomaly around the crossover frequency.
Ringing
The oscillations caused by energy storage and release in the reactive components of the crossover circuit known as ringing can impart a muddy and indistinct effect to the sound with loss of detail. The greater the number of drivers with their own crossover points, and also the more complex the crossover filters the worse the effects are. Damping of mechanical cone overshoot and oscillation are also impaired by high order crossovers.
The answer again is a simple crossover or better still, no crossover at all. Some commercial speaker manufacturers have in the past published tone-burst photos of their speakers at various frequencies. These are short bursts of a steady sine-wave signal each followed by a short gap of silence.
Ideally, the burst should end abruptly, but usually there is a half-cycle or so overshoot visible on the oscilloscope trace.
It is at the crossover frequencies that the ringing really shows, often with several cycles of diminishing amplitude evident before the trace subsides (see Fig. 39, p 99). Such photos are not often published today, perhaps with good reason.
Power Rating and Sensitivity
The maximum power rating varies considerably between speakers and often a minimum power requirement is quoted as well. The rating is governed almost entirely by those of the drivers, so it starts with the choice of these. The driver rating indicates the maximum power it will handle, but this does not indicate the ultimate volume level. It may need a high power to produce a relatively moderate sound pressure if the enclosure design has sacrificed sensitivity for other parameters.
Alternatively, a highly efficient enclosure such as a folded horn would need a fraction of the power to produce a high output, and so would require only modestly rated drivers. The amount of acoustic power required varies with the listening room, a large one needs more than a small one, and a room heavily furnished with thick curtains, well-padded chairs and deep carpeting needs more than a sparely furnished one. High power then does not necessarily mean high volume.
The rating is thus linked with sensitivity, which is usually specified as a given dB level at 1 meter on axis for an input of 1 watt. Sometimes a voltage of 2.83 V is quoted instead of 1 watt. This is the voltage which produces 1 watt of power across an 8- ohm load, however, the speaker impedance varies considerably with frequency so this is not a very reliable rating.
A speaker with a low sensitivity would have an output of around 80 dB, whereas one with high sensitivity would be 90 dB or more. Other levels at other distances can be easily calculated from this. To increase the level by 3 dB, the power must be doubled, so the difference in power required from 80 dB to 90 dB is over 8 times. A sensitive speaker at 5 watts can therefore give the same output as an insensitive one at 40 watts.
A sealed box loudspeaker behaves as a monopole sound source at all wavelength greater than its own dimensions, and for such a source the sound pressure level drops 6 dB for each doubling of distance from the source in the far field (over 1.m). So if you listen at about 2 meters from the speakers, the power must be increased by 6 dB to give the same level as at 1 meter, hence is four times the 1 meter level. This assumes no reflections from the room boundaries i.e. an acoustically dead room. In practice, reflections reduce the amount of power required to give a specified level.
A reasonable rule of thumb for assessing musical sound levels is that a symphony orchestra produces about 90 dB when playing full fortissimo as heard from a good seat in a concert hall having good acoustics. For most of the time it is much less than this, and is also less in the loud passages when the performance is given in a theatre, where the sound is absorbed by curtains and drapes.
So for a speaker of average sensitivity producing 87 dB for 1 watt at 1 meter, we need to double the power to produce 90 dB, then quadruple it to give 90 dB at 2 meters. The power requirement is thus 8 watts from both channels or an average of 4 watts each in a dead room. For a normal room the power requirement would be less, probably three quarters of this, say 3 watts. For a low sensitivity speaker of 81dB for 1 watt at 1 meter, the power needs to be quadrupled to give the same results, so requiring 12 watts per channel.
These figures give no safety margin and should be at least doubled preferably trebled, to ensure that the amplifier and speakers are not overloaded on peaks and are working well within their linear range. So for a speaker of average sensitivity, 6 to 9 watts per channel should be adequate, while an insensitive model would need 24 to 36 watts.
At further distances in a normal room there is little reduction in sound pressure level because the free field at which the level falls 6 dB for a doubling of distance, is reinforced by the reverberent field in which the level is fairly uniform. No further increase in power is therefore needed.
For those who like rock music blasted at over 90 dB, double the power for each extra 3 dB and do not be surprised when your hearing above 4 kHz disappears before you are 40! These figures are approximate as much depends on the size and furnishing of the listening room as well as the type of music reproduced and listening level preferences. However, it is evident that many systems tend to be overpowered.
Impedance
When a loudspeaker cone operates at its resonant frequency its excursion is greater for a given input than at all other frequencies. The back EMF is likewise greater and so less forward current flows. According to Ohm's Law as applied to impedance Z = E/I, so a reduction in current means a higher impedance.
An impedance graph is often published with loudspeaker specifications, which shows its value over the speaker's frequency range, and quite a lot can be learned from it (Fig. 40). Firstly a peak can be seen of some 25-4012 in the bass register. This is the main bass cone resonance and shows that even if the acoustic output is damped to give a flat response, the cone still makes large excursions at that frequency.
If the peak is very high, say over 50 ohm, this indicates that the resonance is insufficiently damped and a peak in the output is likely. No doubt this has been engineered by the makers to give an apparently good bass response, but the result is really to make it boomy. This ploy is more likely to be found in bookshelf speakers in which bass would normally be deficient.
A lower peak of around 20 ohm or less indicates a well-damped resonance likely having a smooth roll-off, hence a more natural bass sound. This is usually found only in the larger enclosures.
Twin small peaks either side of the resonant frequency tell us that the enclosure is a reflex. These are really the sides of a resonance peak the tip of which is inverted by the restraining action of the resonating body of air in the exit port (see Fig. 24, p 65).
From the bass region the impedance rises toward the mid-frequencies where what appears to be a large peak is seen.
This rise is not due to increased cone motion, but is the result of the increasing reactance of the coil. We remember that the reactance of an inductor increases with frequency, and the coil is of course inductive.
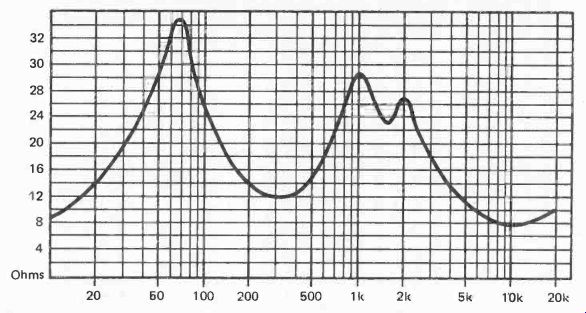
Fig. 40. Typical impedance chart for an infinite baffle enclosure. The
1st. peak is the effect of bass cone resonance; second and third due
to the reactance of the tweeter taking over from the bass unit.
The peak is not due to any resonance but merely the fact :hat the bass driver is here fading out of the picture and the tweeter is taking over. At these frequencies the impedance of the tweeter coil is at the nominal 8 ohm, so the impedance curve descends to about this value, thus producing the peak at around the crossover frequency. Beyond this, the reactance of the tweeter coil rises with the increasing frequency so causing the curve to bend upwards again.
Sometimes the plot above the bass peak does not swing up but remains fairly flat. This indicates that the bass unit is already out of the picture due to a low crossover, which suggests the presence of a mid-range unit.
There may be other humps and dips due to the effect of the crossover network so that the overall impedance curve is quite complex. At any point over the whole range though, it should not fall to below 6.4 ohm otherwise the amplifier may be overloaded.
The curve complexity is a further reason why the design of a crossover network is so difficult and is individual to a specific set of drivers and enclosure. The basic circuits assume a fixed impedance, but the actual impedance curve is far from it.
Distortion
Many factors can contribute to distortion in the driver: cone behavior, coil-end windings passing out of the main magnetic field at maximum excursion, uneven magnetic field distribution and non-linear compliance of the cone suspension.
All these are under the control of the driver designer and there is little the speaker builder can do about them, much has to be taken on trust.
Causes of distortion that are under the control of the speaker builder are the crossover network, doppler distortion, and non-linear air load in infinite baffle enclosures.
That caused by the crossover depends on the actual circuit and its reflected effect on the amplifier. It is compounded by phase distortion between the two drivers and as we saw in the last section is a complex matter. It obviously can be avoided by not using one.
Doppler distortion is proportional to cone velocity at bass frequencies. It is therefore greater with smaller cones because they have to work harder to produce the same volume as larger ones. Resonance peaks in infinite baffle enclosures produce large cone velocities even when damped to give a flat acoustic output, and when only lightly damped the velocity is even greater. So, a single small speaker in an infinite baffle enclosure may produce detectable doppler distortion when driven hard. It is unlikely to be detectable in others, especially reflex and to a lesser extent transmission line enclosures, in which the resonance peak is heavily damped. The use of single full-range speakers should thus not be rejected because of the possibility of audible doppler distortion.
The non-linear air load in the infinite baffle enclosure is a source of harmonic distortion especially with the smaller enclosure. It has its effect when the half wavelength exceeds the longest dimension of the enclosure, so it appears at low frequencies. Over the majority of the mid and treble range harmonic distortion is usually under 1% but in the bass region can rise to 8%. The effect is also experienced with reflex enclosures.
It follows from this and also the practice of underdamping the bass resonance with small enclosures, that a good clean bass sound is virtually impossible with a small enclosure although it may apparently produce a good bass response. If small overall size is imperative the infinite baffle is the only contender, and so the lack of bass definition must be accepted.
There is a possible solution though which we will explore in the next section.