
Magnetic Memories and Diode Protection
By J A Sam Wilson, CET
A Simple Magnetic Memory
The reviews of basic magnetism in this column are intended to prepare you for some actual magnetic devices. A simple type of digital magnetic memory will be discussed at the end of this section.
Summary of magnetics
Magnetic circuits and electric circuits do have some similarities that, unfortunately, are used too often in teaching magnetics. However, they are widely different in many important respects, so a direct analogy can lead to serious confusion.

Figure 1--Of the three basic Ohm's Law formulas, only R equals E divided
by I is accurate with non-linear resistances. Magnetic circuits also are
non-linear, so an Ohm's Law for magnetics is impractical.

Figure 2--Because magnetic flux can ex tend beyond the magnetic material,
a reading of total flux is of little value, in most cases. The preferred
reading lists the number of magnetic lines per square inch (or magnetic density).

Figure 3--Magnetic intensity varies according to the concentration.
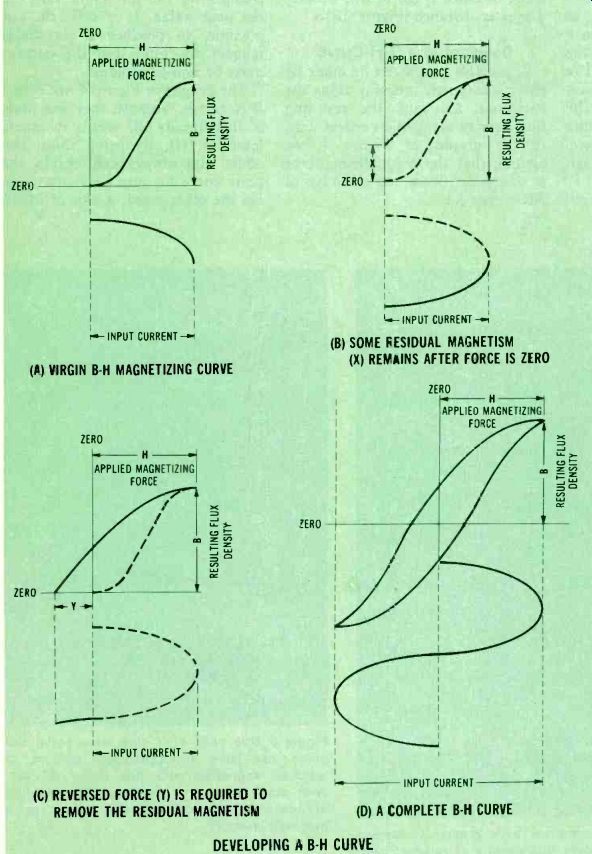
Figure 4--These are four steps of developing a B-H magnetic a sinewave of
current.
The B-H curve is shown above the input current waveform. (A) the initial magnetization follows a different curve than the subsequent ones do (see the same part of D). (B) When the current returns to zero, the flux density does NOT return to zero. (C) Negative current is required to reduce the flux density to zero. (D) This is the complete B-H curve (excluding the virgin curve).
It is common practice to equate magnetomotive force with voltage, flux with current, and reluctance with resistance. This results in a neat-but misleading-formula called "Ohm's Law For Magnetic Circuits." It states: Flux equals magnetomotive force divided by reluctance. Or, in symbols:
0 MMF R
The formula would be useful and totally true, except for one fatal flaw: MAGNETIC CIRCUITS ALMOST NEVER ARE LINEAR.
For an example, let's think about some of the exceptions in electric circuits where the DC Ohm's Law is not accurate, either. In the circuit of Figure 1, only one of the three variations of Ohm's Law can be used. The current varies with the resistance, but the resistance of a thermistor depends on the tempera ture, and the thermistor tempera ture changes with the current. (Of course, you can measure the voltage and current, and then calculate the resistance. But the other two formulas have serious errors.) Similar problems of non-linearity occur with thermistors and diodes.
Magnetic circuits have non-linearity problems comparable to the one with thermistors. Flux in a magnetic circuit depends on the magnetomotive force versus the reluctance of the material. However, the reluctance varies with the amount of flux. And, as the flux increases, so does the reluctance.
Such a condition can't be analyzed correctly with a simple equation.
Also, two more problems complicate the measurements. Electric current is confined to a conductor, allowing an easy test. But, flux seldom is contained entirely within a magnetic material. Therefore, an accurate measurement is the flux density (magnetic lines per square inch), rather than the total amount of the flux (see Figure 2).
Another problem affecting magnetic intensity is whether the magnetizing force is spread over a short distance (Figure 3A), or over a greater distance (Figure 3B).
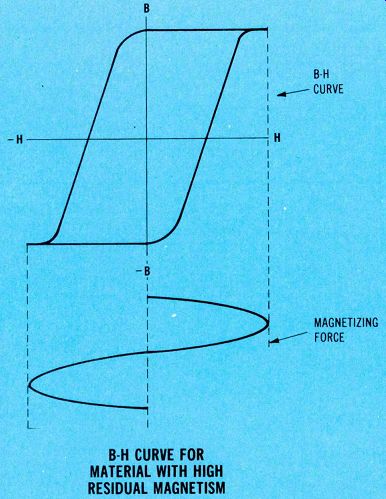
Figure 5 Some magnetic materials have greater hysteresis than the one in
Figure 4. More flux density is retained after the force has stopped. These "square
loop" materials are better for use in magnetic memories.
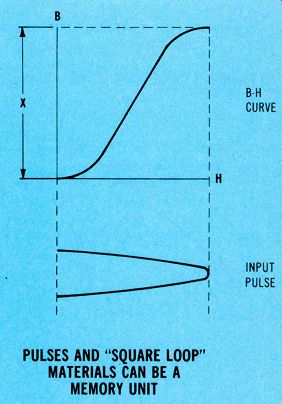
Figure 6 One peak of a sine wave, or a DC pulse, can leave an appreciable
amount of residual magnetism after the pulse is over.
With some means of detecting the residual magnetism, this can be the basis for a magnetic memory.
Developing a B-H Curve
A valuable graph can be made by placing magnetic intensity along the horizontal axis and the resulting flux density along the vertical axis.
In the graphs of Figure 4, we assume that the magnetizing force is sinusoidal (from the sinewave of AC current).
Incidentally, a sinusoidal magnetizing force isn't easy to obtain, because it's difficult to cause a pure sinewave of current to flow through an inductance that has an iron core. Remember that the amount of flux determines the reluctance of the iron core. So, as the sinewave of current starts to peak, it becomes more difficult to establish flux in the iron. Therefore, the counter voltage varies as the current changes for the minimum value to the peak value. It is difficult, but possible, to produce a sinusoidal magnetizing force, but the current must be non-sinusoidal.
The graphs in Figure 4 are called B-H curves, because they are plots of flux density (B) versus magnetic intensity (H). By using these two items, you always can obtain the same curve for any given material.
On the other hand, a plot of MMF versus flux would vary according to the length of the coil or the cross sectional area of the magnetic material. Clearly, a B-H curve is superior to others.
Magnetic Storage
This information has been giving you the background for a discussion of magnetic materials that can perform as storage devices.
When a magnetic material has a nearly square loop (as shown in Figure 5), it will retain a large amount of residual magnetism after just one-half cycle of magnetizing force (see Figure 6).
In other words, the magnetic material has stored magnetism obtained from an input pulse! Think about the implications for a moment. Digital signals are made up of highs and lows; that is, pulses or no pulses.
Therefore, if there were a way to determine that a certain area of magnetic material retained magnetism, then it would prove that a high pulse had been there. A lack of retained magnetism indicates a low was the last signal state.
In other words, the problem is to move the digital information into or out of storage. Next month, I'll show you how it's done.

Figure
7. Resistances and capacitances paralleled across each diode of an array
help prevent the overload of diodes having different characteristics. Thus,
diode failures are minimized.
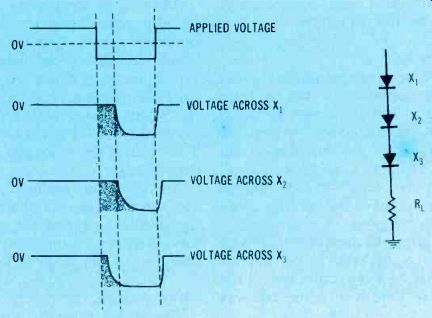
Figure 8. For a brief time following the end of conduction, a diode has
zero resistance. This allows part of the reverse peak to appear in the output
waveform. This time is called "recovery time," and it is different
for individual diodes. The diode having the shortest recovery time has the
total reverse voltage across it, during its recovery time.
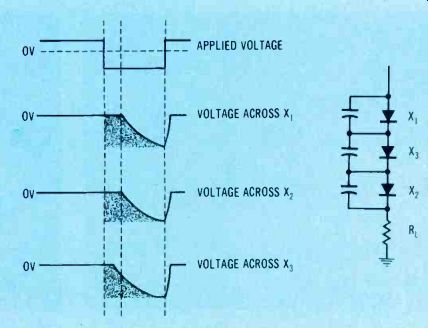
Figure 9. Adding a capacitance across each diode lengthens the recovery
time of each one, thus minimizing the variations of recovery time, and protecting
most diodes from overvoltage shorts.
Diode Protection
Rectifier diodes sometimes are connected in series to obtain a higher total peak-inverse voltage rating (see Figure 7).
When a high reverse voltage is applied to any diode, a minimum or small amount of current flows.
With series diodes, the inverse voltages will be different across each individual diode, because of non-identical reverse leakages.
When this unbalanced condition of the voltages is excessive, the PIV rating of one diode can be exceeded, thus the diode fails by shorting.
In Figure 7, all resistors that are connected in parallel with diodes have the same value, so they equalize the various diode reverse voltages.
Usually, the reason for the paralleling capacitors is stated as an equalizing of the transient voltages across the diodes. When a diode is non-conducting from a reverse bias, it acts as a capacitor. Therefore, the diode junction having the smallest value of capacitance will have the largest relative voltage across it. Placing a capacitor in parallel with each diode then minimizes any differences of diode junction capacitance.
These reasons undoubtedly are valid, but there seems to be another reason for the capacitors.
Recovery time When a diode conducts in the forward direction, it has a large number of charge carriers in the N and P regions. Then, when the voltage across the junction is re versed rapidly, a short period of time is required for the charge carriers to move out of the semi conductor regions.
The effect of these stored charge carriers is to reduce the reverse resistance to a low value for a brief period of time (called the recovery time, or storage time).
In Figure 8, the unequal recovery times for three diodes in series are shown by a drawing, with the recovery periods shaded.
When the supply voltage first is reversed from forward bias to reverse bias, the voltage across each diode remains at approximately zero volts, because the resistance is low while the charge carriers are being swept out. In this case, diode X3 recovers first. So, for a very short period of time, all of the reverse voltage appears across it! Such a voltage overload could destroy X3.
Paralleling capacitors
Addition of a capacitor in parallel with each diode lengthens the recovery times (see Figure 9). Thus, the differences between the various recovery times are reduced.
Note that diode X3 has only part of the input voltage across it before diodes X1 and X2 begin to conduct.
This reduces the possibility of diode destruction.
Anytime you replace just one diode in a series, you should check the paralleling capacitors and resistors. An open component might have caused the diode to fail.
Proper capacity
The proper value for the capacitors of Figure 7 can be calculated by the formula:
Shunt Capacitance = TsXn RT
Where: Ts is the storage time in seconds n is the number of diodes series RT is the internal resistance of the power supply plus the load resistance Use the test setup of Figure 10 to measure the recovery time. The 10-ohm resistor allows the scope to display the diode current waveform.
A good triggered-sweep scope with a wide bandwidth is needed to produce a waveform similar to that in Figure 11. By definition, the recovery time is the measured time between maximum negative current and 10% of the negative current.
This curve is surprising because it shows that the diode does not remove the negative half cycle completely, as is commonly believed. However, the recovery period is short, and some scopes probably can't reveal it.
Proper resistance
The optimum paralleling resistance for each diode of a series is determined by the "rule-of-thumb" that says each resistor should be one-half the minimum value of the diode's reverse resistance.

Figure 10, Connect the scope and components as shown, to measure the current
caused by the diode recovery time.
Spread the waveform by using a triggered scope.
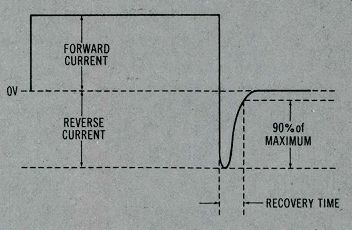
Figure 11. Expect this kind of waveform from the measurement of Figure 10.
Repeat the test with power-supply diodes, fast-recovery diodes used in scan
rectification, and video-detector diodes. Usually, power-supply diodes show
the longest recovery times.
------------
(adapted from: Electronic Servicing magazine, Jul. 1978)
Next: Aug. 1978
Prev: Link |
Also see: