The ability of FM to reduce interference depends to a great extent upon the proper centering of the signal within the bandpass channel of the receiver's tuned circuits. This, in turn, requires that the tuned circuits of the receiver be correctly aligned. When a station is tuned in manually on an FM receiver, the speaker output gradually increases in volume, accompanied by much more noise than is customarily heard with AM receivers.
However, if the dial rotation is continued, a point is reached where the station program comes through loud and clear with all background noise completely absent. Interstation noise, unless removed by a special noise limiter circuit, is much greater with FM than AM receivers. The reasons for this have been discussed previously.
Two methods of aligning FM receivers are currently in use. The most popular method, and probably the faster one, uses a signal generator and a VTVM. The second method requires more extensive equipment, namely, an FM signal generator and an oscilloscope. The latter approach, because of the oscilloscope, is referred to frequently as the visual method. Since both methods are likely to find wide usage, both will be considered in detail.
The reader can then choose the one best suited to his purpose.
Commercial FM receivers can be divided into four categories: first, the familiar limiter and discriminator combination; second, the ratio detector; third, receivers that use the 6BN6 ( or 3BN6) gated-beam tube; and, fourth, the 3DT6 or 6DT6 FM detector. The two latter types have been used, thus far, to a greater extent in the FM sound section of television receivers than in FM broadcast receivers. However, since they are FM detectors, they will be discussed here.
To systematize the alignment presentation for the various types of detectors, we will first examine the alignment of those receivers containing the limiter and discriminator type of detector. Furthermore, since the alignment can be achieved by either of the methods mentioned, we will begin with the method requiring the least amount of equipment and then progress to the more extensive visual procedure.
LIMITER-DISCRIMINATOR RECEIVERS
Signal Generator-VTVM Method. For the purpose of alignment, the receiver can be divided into three main sections: the R.F. stages, the I.F. and limiter stages, and the discriminator. As a general rule, the I.F. and limiter tuned circuits are peaked first, and then the discriminator is adjusted. Finally, the R.F. stages are aligned. Although some change in order may occur, such as adjusting the discriminator before the I.F. and limiter stages, this sequence will generally prove most satisfactory.
I.F. System Alignment. To adjust the I.F. stages, the signal generator is placed at the grid of the mixer tube. The VTVM is connected into the grid circuit of the limiter. If two limiter stages are employed and both are tuned, the VTVM is used initially at the grid of the first limiter. On the other hand, if there is no tuned circuit between the two limiters, then the VTVM is placed initially in the grid circuit of the second limiter.
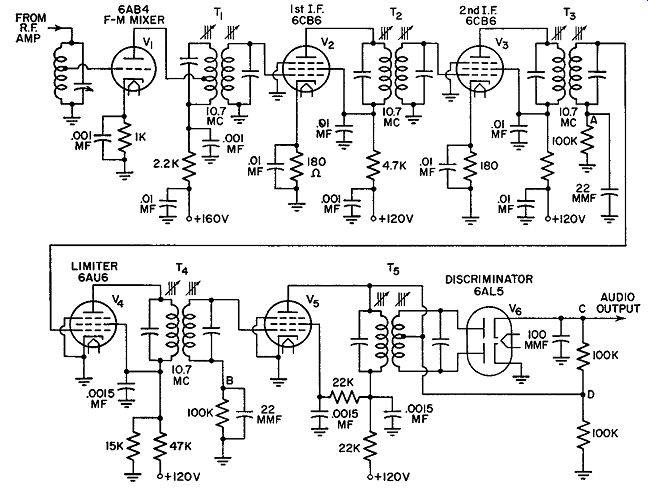
FIG. 11.1. A typical I.F. and discriminator system of an FM receiver.
The I.F. system of a typical FM receiver having two limiters is shown in Fig. 11.1. The signal generator is connected to the control grid of the 6AB4 mixer through a 0.01-mf capacitor. The ground lead of the generator connects to the receiver chassis. The VTVM is set to a low d-c scale and the d-c probe is placed at point A. The meter common lead goes to the chassis.
With the signal generator accurately set to deliver a 10.7 -mhz unmodulated signal, and the receiver in operation, the cores of transformers T1, T2, and T3 are each adjusted for maximum indication on the VTVM. These adjustments should be made with as low an input signal as possible, consistent with a usable indication on the meter. The stages will thus be aligned for maximum response at low signals. Upon reception of strong signals, a certain shifting in the peak of the limiter will result, producing some distortion. However, strong signals can deal more effectively with interference and distortion, and the effect of this peak shifting is less noticeable than it would be if the misalignment occurred on weak signals.
After the foregoing peaking has been carried out, the d-c probe of the VTVM is shifted to point B. Everything else remains the same. Now, both the primary and secondary cores of T4 are adjusted for a maximum indication on the VTVM. This completes the alignment of all the I.F. stages and the two limiters.
Note that the signal generator is placed at one end of the I.F. system and the VTVM is positioned at the other. Occasionally, when the system is badly out of tune or one of the tuning circuits is defective, it may be necessary to conduct this procedure on a stage-by-stage basis. The VTVM is initially placed at point A. The signal generator is then connected to the control grid of V3 . The generator ground lead still goes to the receiver chassis. With the generator set to 10.7 mhz (unmodulated), adjust both cores of T3 for maximum indication on the VTVM. Next, the signal generator is shifted to the control grid of V2 , and the cores of T 2 are adjusted in a similar manner. Then, the signal generator is moved to the grid of V1, and the cores of T1 are adjusted.
One further point before we discuss discriminator alignment. When the signal generator is connected to the grid of the mixer tube, its output may be severely reduced because of the presence of the mixer grid tuned circuit.
This circuit is resonant to a much higher input signal, and its impedance at 10.7 mhz is low. Consequently, a very high setting of the signal generator amplitude control may be required to inject a small amount of signal into the I.F. system.
If this occurs, unsolder the lead to the grid of the mixer tube and substitute a 100,000-ohm resistor from the mixer grid to ground. The signal generator voltage is applied across this resistor.
A question often asked is whether the high-frequency oscillator should be disconnected-or prevented from functioning-during this period of alignment. For clear-cut results, it is better to stop the oscillator. We can re move the oscillator tube, if a separate one is used, or short the plates of its tuning capacitor if the B+ is not thereby grounded out. In crystal oscillators, removal of the crystal itself will prevent operation of the oscillator.
If only one limiter is present in the receiver, the VTVM is connected into its grid circuit. If two limiters are employed and the coupling between them is untuned, the d-c probe of the VTVM goes to the grid of the second limiter and remains there throughout the entire alignment of the I.F. system.
Discriminator Alignment. The next step, after the I.F. and limiter adjustment, is alignment of the discriminator. The signal generator remains at the mixer grid. However, the d-c probe of the VTVM is moved to point D, Fig. 11.1. Common lead of the instrument connects to the receiver chassis.
Adjust the primary core of T5 for maximum meter indication. Then, move the meter probe to point C and rotate the secondary core until a zero reading is obtained. If the core is rotated in one direction from this zero point, the VTVM will indicate a positive reading; if the core is turned in the opposite direction, the meter will indicate a negative voltage. It is important that the zero reading occur between a positive and negative reading (as the core is rotated). This is the only correct setting for this secondary core.
Since most VTVM's have the zero marking at the extreme left-hand side of the scale, the reading of negative values is not too convenient. For such units, an artificial zero mark can be achieved by rotating its "Zero Adjust" knob until the needle is brought some distance up scale. Let us say it is brought to a marking of 3. This now becomes the new zero. Needle deflection to the right of this value represents a positive movement of the needle deflection to the left of 3 represents negative voltage values.
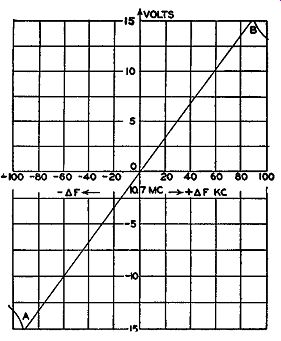
Fig. 11.2. The proper output char- Meters with a center zero scale characteristic
of a discriminator. be employed directly.
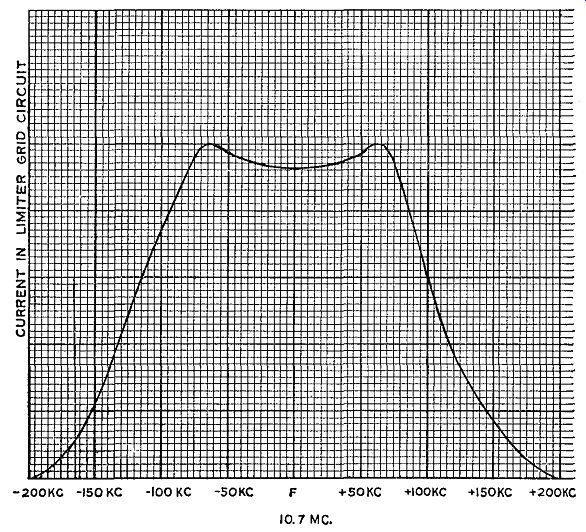
Fig. 11.3. A double-peak response curve for an FM, I.F. system.
The foregoing adjustments should cause the discriminator transformer to produce the response characteristic shown in Fig. 11.2. However, a test should be made of the discriminator linearity, at least up to ±75 khz. Most manufacturers design the discriminator transformer to be linear up to ±100 khz, but ±75 khz will suffice. Vary the frequency of the signal generator to obtain several points such as ±20 khz, ±40 khz, ±60 khz, and ±75 khz, about the chosen carrier frequency, 10.7 mhz. The meter across the load resistors should indicate equal readings (although of opposite polarity) for each set of frequencies. Thus 10.7 mhz + 20 khz should produce the same deflection as 10.7 mhz - 20 khz. If these tests indicate that the response is not linear, then the various cores throughout the I.F. system should be touched up until nearly equal meter deflections are obtained.
Overcoupled I.F. Transformers. There are in use some I.F. transformers which possess a double peak, due to overcoupling, in order to obtain a wide-band characteristic. (See Fig. 11.3.) For these, a slightly modified approach is necessary. When an overcoupled stage is to be aligned with an AM signal generator, it is necessary to use loading networks. The net work loads the circuit so that the transformer is effectively below critical coupling. In this condition, the transformer can be peaked. The loading network to be used will be specified by the manufacturer and may consist of a single resistor or a resistor and capacitor in series. When aligning a loaded stage, a greater signal is required from the signal generator and the stage will tune broadly. If it is found that the generator does not possess sufficient strength, it will be necessary to increase the size of the loading resistor in order to reduce the effect of the loading.
Where the manufacturer's service data are not available, or the size of the loading resistor is not known or specified, a resistor of 680 ohms may be used.
To align an overcoupled transformer, place the loading network across one of the windings, and peak the unloaded winding at the intermediate frequency. After this has been done, the loading network is switched to the other side of the transformer, and the winding, which is now unloaded, is peaked. Both sides of the transformer are now aligned. Remove the loading network, and adjust the windings of all the other transformers in similar manner.
When connecting the loading network across a transformer winding, use leads which are as short as possible. We are dealing here with relatively high frequency networks and there may exist enough inductance in the connecting leads to affect appreciably proper circuit operation. Hence the need for connecting leads which are as short as possible.
Alignment of R.F. Section. The procedure for aligning the R.F. portion of the receiver is similar, in many respects, to the methods in use for present AM radio receivers. In addition, nearly all R.F. tuned circuits are single-peaked, requiring that they be adjusted merely for maximum response.
To start the alignment, connect the high (or signal) lead of the signal generator to the FM antenna terminal through a 270-ohm resistor.
1 The low side of the generator connects to the receiver chassis. (Unless the circuits are completely out of alignment, it is perfectly feasible to adjust the R.F. circuits and the oscillator at the same time.) The indicating meter, a VTVM, is placed in the grid circuit of the limiter. Set the signal generator to some frequency at the high end of the band, say, 106 mhz, for the circuit shown in Fig. 11.4.
2 Adjust the front dial of the receiver to read exactly the same frequency. With the signal generator and receiver both in operation, adjust trimmer capacitors C1, C2, and C3 for maximum deflection of the meter. Do this carefully and use as low a signal as is consistent with readable meter indications.
[ 1. If a balanced input is employed, the signal generator is connected to the antenna terminals with a 150-ohm resistor in each lead. This frequency will vary with the receiver. ]
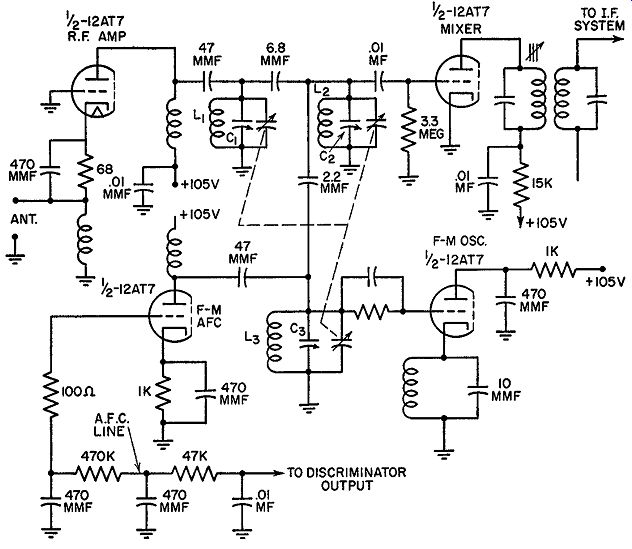
FIG. 11.4. The R.F. section of an FM receiver.
The circuit in Fig. 11.4 possesses an automatic frequency control (A.F.C.) circuit. This is designed to counteract any frequency drift that may develop in the FM oscillator while a station is being received. In the present in stance, we wish to adjust the oscillator's frequency without any control action by the A.F.C. network. Therefore, this stage is disabled. Generally, receivers which possess A.F.C. circuits have a front panel disabling switch and the cut-out is accomplished this way. If, by chance, this is not true, then the stage may be disabled by simply grounding the A.F.C. line which regulates the operation of this stage. See Fig. 11.4.
The next step is to reduce the signal generator frequency to 90 mhz (for the circuit in Fig. 11.4) and to set the receiver dial to the same value. Now, L1, L2 , and L3 are adjusted for maximum meter deflection. Since these coils have no slugs, their inductance is altered by compressing or expanding the coil turns until the desired maximum reading is obtained. After this has been done, the entire R.F. alignment is rechecked to make certain optimum peaking has been achieved.
If coils L1, L2, and L3 do possess internal movable cores, then these would be adjusted in the foregoing step instead of the physical compression and expansion.
The R.F. adjustment frequencies of 106 mhz and 90 mhz are peculiar to the circuit of Fig. 11.4. Other receivers may use other frequencies and, for each, the manufacturer's instructions should be followed.
This now completes the R.F. alignment of the receiver.
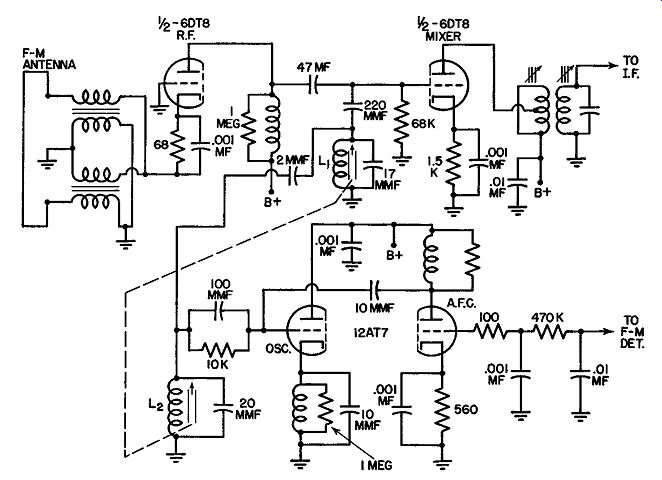
Fig. 11.5. An R.F. front end section in which inductive tuning is employed.
When the R.F. stages employ inductive tuning, as they do in Fig. 11.5, the adjustments to be made are slightly modified. There are no trimmers to adjust, the only movable items are the tuning cores (in L1 and L2 ) themselves. Therefore, adjustment is made on these cores. The signal generator, connected to the antenna terminals, is set to 98 mhz. This is the mid-frequency of the FM band. The receiver dial is also set to 98 mhz. For indication, a VTVM is connected to the grid of the limiter. Then, the tuning cores are individually adjusted for maximum reading on the VTVM. Provision exists for this to be done. The adjustments are performed several times to make certain the best position is obtained. Then the cores are again secured to the mechanical tuning mechanism so that they can be varied in unison.
Visual Alignment. In the visual method of circuit alignment, the response curve of the circuit under test is produced directly on the screen of an oscilloscope. This is achieved by feeding the output of an FM signal generator into the receiver. This signal sweeps back and forth across a band of frequencies 0.5 to 1 mhz wide. The center of this band is placed at 10.7 mhz, which means that the generator output varies from 10.2 mhz to 11.2 mhz.
As the signal passes through the tuned circuits, it is modified in amplitude by the selectivity characteristics of the tuned circuits. At the limiter, the grid bias will vary in accordance with these amplitude variations, and it is this pattern which is presented on the oscilloscope screen.
By this method of alignment, results of any adjustments may be viewed immediately. In this sense, this method is superior to the previous one where we really do not know exactly what the final response curve looks like.
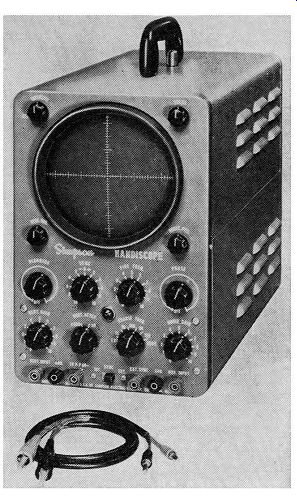
Fig. 11.6. An oscilloscope suitable for aligning and servicing FM circuits.
(Courtesy Simpson Electric Co.)
The Oscilloscope. The oscilloscope, shown in Fig. 11.6, is a voltage indicator. Hence, in order to obtain any indications on the screen, the plates (or the input terminals) must be placed across two points in a circuit where a difference of potential exists. If we desire to determine the form of the current wave, it becomes necessary to pass the current through a resistor and then to obtain the wave form of the voltage across the resistor.
Only in this way is it possible to determine the current variations present.
For alignment of an FM receiver, we still use the points indicated previously. In the grid circuit of the limiter, we obtain the necessary voltage for the oscilloscope from across the grid resistor. At the output of the discriminator, the other indicating point used, the substitution of the oscilloscope introduces no problem.
In connecting the oscilloscope, the vertical input and ground leads are placed across the two points whose voltage waveform is to be viewed. At the points mentioned, one end is usually at ground potential, and it is best to connect the ground terminal of the scope to the grounded point. This places the scope ground at the same potential as the set ground and avoids shock. If both points at which the voltage is to be measured are above ground, care will have to be exercised that one does not come in contact with the case of the oscilloscope, this usually being at oscilloscope ground.
Remember that the so-called "ground" of one system does not necessarily have to be at the "ground" of another system, unless both are directly connected with a conductor.
In order to use the oscilloscope to its fullest extent, it is essential to have a good understanding of the type of indications that will appear. Unless the proper interpretations are made from the observed results, very little benefit will be derived from its use.
We know, from the previous discussion, that an S-shaped curve represents the characteristic response of the discriminator. The usable region, be tween points A and B (Fig. 11.2), must be made linear if amplitude distortion is to be avoided during the FM demodulation process. Beyond the two points the characteristic may curve considerably without affecting the response in any way.
With an FM signal generator sweeping over the entire band, the full S-shaped curve will be obtained on the screen of the scope. If the entire I.F. system is properly aligned, the signal generator may be placed at the grid of the mixer. If the discriminator is aligned before the other stages, the signal generator is generally placed at the grid of the limiter preceding the discriminator. The vertical input terminals of the scope, for discriminator alignment, connect between point C and ground (Fig. 11.1).
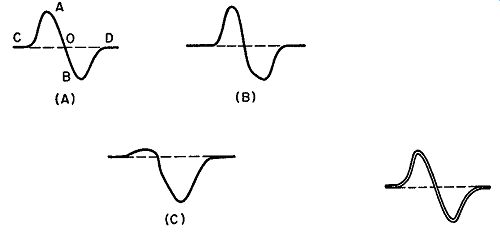
FIG. 11.7. Discriminator response curves. (A) Desired form; (B) and (C)
distorted form.
Fig. 11.8. A double pattern.
With the FM signal generator in operation, the curve that should be seen on the oscilloscope screen is shown in Fig. 11. 7 A. The extent of this curve is greater than that shown in Fig. 11.2 and is obtained by using a half-megacycle sweeping range. This is done purposely so that the two end sections, C,D, will serve to form a zero line. If we then mentally connect sections C and D by a straight line, we can tell more easily when section A-0 is equal in length to section 0-B.
If the secondary of the discriminator input transformer is properly aligned, but not the primary, the linearity of the curve between points A and B will be distorted, perhaps producing the result shown in Fig. 11.7B. The primary winding controls the linearity of the response, and it should be adjusted until the operating portion of the curve is linear.
Misalignment of the secondary, with the primary winding properly adjusted, shifts the cross-over point (point 0, in Fig. 11.7A) from its normal position (see Fig. 11.7C). Adjustment is required until both sections of the curve are symmetrical with respect to the center point.
Although we require but one S-shaped curve, we sometimes get two. (See Fig. 11.8.) To understand the reason for this, it is necessary to know how the FM sweep signal is produced and how the oscilloscope operates in con junction with the generator. In an FM signal generator, of the type likely to be employed for the present purpose, the 60-cycle sine-wave input from the power line is used to frequency-modulate an oscillator. It may do this through a reactance tube (to be described later) or it may do it by some other means. As a result, the frequency variation that appears at the output of the generator varies back and forth at a 60-cycle rate.
At the same time, a portion of this sine-wave voltage is brought to an outlet at the signal generator panel. From this point it is connected to the horizontal input terminals at the oscilloscope by means of a cable. In other words, we replace the sawtooth sweep of the indicating scope with this 60 cycle sine-wave voltage.

Fig. 11.9. The application of a sawtooth wave to the deflecting plates
of a scope causes a relatively slow left-to-right motion and rapid retrace.
A sawtooth voltage, shown in Fig. 11.9, when applied to the horizontal
deflection plates of an oscilloscope, will cause the electron beam to move slowly from left to tight and then, at the retrace, to swing rapidly back to the left-hand side of the screen. With a 60-cycle sine-wave deflecting voltage, such as that obtained from the foregoing FM signal generator, the action of the beam is entirely different.
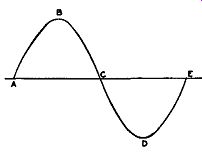
Fig. 11.10. A sine wave.
Sine-Wave Deflection. In Fig. 11.10 we have the familiar sine wave, with letters from A to E inserted at convenient points to aid in the explanation. At point A, the voltage is zero and, if applied to the horizontal deflection plates, would not affect the beam. Hence, when the sine wave of Fig. 11.10 is applied to the deflecting plates, and the voltage is zero, the electron beam will pass through the center of the deflecting system unaffected and strike the fluorescent screen at its center.
From A to B, the voltage is increasing, and the beam is deflected to one side, say, the right.
From B to C, the deflecting voltage is decreasing, and the beam is gradually returning to the center of the screen. It arrives at this position when point C is reached.
From C to D, the voltage has reversed itself, and the beam is now shifting to the opposite side of the screen. At D, the maximum left-hand position has been reached. From D to E, the beam returns to the center of the screen again.
Now let us apply the output from the signal generator to the grid of the last limiter tube. The generator output is varied by the same 60-cycle sine wave. This means that the output frequency starts from its center position (which is indicated by the dial on the front panel), shifts to a higher frequency, reverses and returns to its center position, drops to a lower frequency, and finally returns to the carrier or resting position to end the cycle.
When the FM signal is applied to the discriminator circuit, you will find, by combining the two actions described above, that one S-shaped curve is traced out on the left-to-right motion of the beam, and a similar S-shaped curve is traced out as the beam travels from right to left on the screen.
Remember that with this signal generator we are using a sine-wave sweep; the sawtooth sweep of the oscilloscope itself is in the off position and with out effect. However, although the voltages for the beam deflection and the sweep generator oscillator are obtained from the same source, it does not necessarily follow that these voltages are still in phase with each other by the time they reach the beam or the modulating circuit. To bring them into phase, a special control, the phase control, is incorporated into the sweep generator. By varying this control, the two portions of Fig. 11.8 can be blended into one.
Sometimes, the two curves can be brought together at all points except perhaps at the extreme ends. This is caused by some circuit unbalance and can be ignored.
The Howard W. Sams organization recommends a double "S" pattern in their alignment instructions. (See Fig. 11.11.) This is obtained by using a 60-cycle sine-wave sweep in the FM signal generator and a 120-cycle saw tooth voltage for deflection in the horizontal system of the oscilloscope.
To see just how this double pattern is obtained, let us follow the output frequency of the FM signal generator and the associated motion of the electron beam in the oscilloscope. This is shown in Fig. 11.12. At time A, when the beam is at the extreme left-hand side of the scope screen, the output frequency of the signal generator will be 10.8 mhz are assuming ere a frequency sweep o + 00 c and -100 khz about 10.7 mhz.) Since the output of the discriminator at 10.8 mhz will be maximum, by Fig. 11.2, the beam will be shifted to point A in Fig. 11.12C. This represents the response of the discriminator to 10.8 mhz.
As the beam moves across the screen from left to right, the frequency output of the FM signal generator decreases until it becomes 10.7 mhz when the beam is in the center of the screen. This is time B and the section of the response curve traced out is A-B of Fig. ll.12C. (The dotted arrows show the manner in which the curve is traced out.) From time B to time C, the frequency output of the generator decreases to 10.6 mhz and section B-C of the response curve is traced out. Point C (or time C) occurs when the beam is at the extreme right-hand edge of the screen. If we assume that the beam loses no time in snapping back to the left-hand side of the screen (i.e., retrace), then point C also appears at the left, as shown in Fig. 11.12C. Actually, some small interval is required for this action to occur, but we will ignore it here.
From time C to time D, the beam is again traveling from the left-hand side of the screen toward the center and the frequency is changing from 10.6 mhz to 10.7 mhz. During this interval, section C-D of the response curve is traced out.
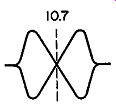
Fig.11.11. The FM detector response curves obtained by using a 60-cycle
sine-wave sweep in the FM signal generator and a 120-cycle saw tooth
voltage for beam deflection in the oscilloscope.
The final section, D-E, is then traced out from time D to time E. The advantage of this type of presentation is its symmetry. If the reader adjusts the FM discriminator until he obtains a linear "X" pattern, as shown, he then knows that the stage is properly adjusted. The crossover point must lie in the center of the pattern.
The difference between the patterns of Fig. 11.11 and Fig. 11.12C is the greater sweep used to obtain the pattern of Fig. 11.11. For Fig. 11.12C, a sweep of ±100 khz was indicated. For Fig. 11.11, a sweep of ±225 khz was used. This additional sweep range provides the flat end sections where the circuit response is zero because the signal is outside the range of the tuned circuit. These end sections further aid in lining up the center of the "X."
If any reader wonders how it is possible to cause the output of the sweep generator to be at the maximum end when the beam is at the extreme left hand side of the screen, the answer is with the phase control on the generator.
This is adjusted until the pattern shown is obtained.
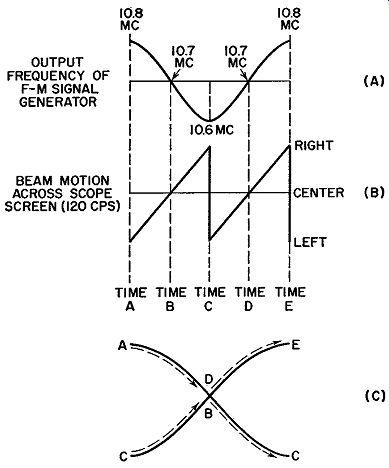
Fig. 11.12. How the pattern of Fig. 11.11 is produced.
Visual Discriminator Alignment. To align the discriminator input transformer visually, connect the output terminals of the signal generator between grid and ground of the last limiter tube. A 0.01-mf capacitor should be inserted between the signal lead of the generator and the grid of the limiter to prevent the generator from upsetting the d-c voltage at the limiter grid. Attach a wire from the "Vertical" post of the oscilloscope to terminal C of Fig. 11.1. The other end of the discriminator load, usually ground, is connected to the ground terminal of the oscilloscope. In addition, an outlet is provided on all FM signal generators from which a portion of the 60 cycle modulating voltage can be obtained. The voltage is applied to the "Horizontal" input terminal of the oscilloscope. The ground terminal of the generator is connected to the oscilloscope ground post. The internal saw tooth sweep of the scope is turned off.
If a pattern such as that shown in Fig. 11.11 is desired, then no connection is made from the signal generator to the oscilloscope. Instead, the latter is set to produce a horizontal sawtooth sweep of 120 cycles per second.
Set the generator to the I.F. value, say, 10.7 mhz, and adjust the sweep control so that the output frequency sweeps for about 450 khz about 10.7 mhz.
This will produce the complete response pattern on the screen plus a good indication of the circuit response beyond the desired spread about 10.7 mhz.
The primary and secondary cores of the discriminator coil are adjusted now until the desired curve is obtained. This curve is shown in Fig. 11.7A. When this curve has been obtained, the discriminator circuit is aligned.
Visual Alignment of I.F. Stages. For the visual alignment of the I.F. system, the vertical input leads of the oscilloscope arc placed across the grid leak resistor in the grid circuit of the first limiter stage (if two are used). The signal generator is connected between control grid and ground of the mixer tube. Again, use the 0.01-mf capacitor in the signal lead of the generator. Adjust each of the cores of the I.F. trans formers (T1, T2 and T3 in Fig. 11.1) for maximum amplitude and symmetry of the curve shown in Fig. 11.13. Then, move the oscilloscope to the grid of the second limiter (point B in Fig. 11.1) and adjust the two cores of T4 for maximum amplitude and symmetry of the response curve. The level of the input signal is kept as low as possible in order not to drive the limiter beyond saturation.
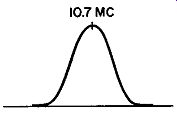
Fig. 11.13. The normal response of an FM I.F. system.
The foregoing completes the visual alignment of the I.F. and discriminator stages.
R.F. System Alignment. Alignment of the R.F. stages is achieved as follows: Attach the signal generator to the antenna terminals of the receiver, leaving the oscilloscope connected across the grid-leak resistor of the limiter stage. Just how to connect the signal generator leads to the receiver will generally be specified by the manufacturer. Philco, for example, states that two simple dipole aerials should be constructed using 30-inch lengths of rubber-covered wire. One dipole is connected to the receiver antenna terminals and one dipole is connected to the output terminals of the signal generator.
The two dipoles are then spaced several feet apart and the signal transfer affected in this manner. Other manufacturers specify that the signal generator output lead should connect to the receiver antenna terminal through series resistor. The value frequently chosen is 270 ohms. The other generator lead goes to the receiver chassis.
The sweeping range of the generator is set for approximately 1 mhz and the center output frequency adjusted to 108 mhz. Set the dial of the receiver to the same frequency. Now adjust the oscillator and input trimmer capacitors ( as indicated by the manufacturer) until the response curve seen at the oscilloscope is symmetrical and at a maximum. Note that, since the oscilloscope is placed in the limiter grid circuit, the signal generated by the signal generator will first have to pass through the I.F. system before it reaches the oscilloscope. Hence, the response pattern seen on the oscilloscope will be that of the I.F. system. (See Fig. 11.14A.) However, if the R.F. stages

Fig. 11.14. (A) The response characteristic of a correctly aligned I.F.
system. (B) A distorted response indicating circuit misalignment.
are not properly adjusted, the response pattern will become distorted, one possible shape shown in Fig. 11.14B. The R.F. stages are correctly adjusted when the I.F. response curve observed on the oscilloscope screen possesses its proper form with a maximum amplitude.
The same procedure is repeated at 88 mhz. Practically all R.F. coils are of single-peak design, and the foregoing method of adjusting for one maxi mum response at each test point is sufficient.
Marker Frequencies. In using the oscilloscope, it would aid consider ably if the frequency at specific points on the curve seen on the screen were identified in some manner by special markers. Such indicators are known as "marker frequencies" or "marker points."
Some sweep generators have built-in marker generators and it is possible to inject the marker signal into the sweep signal directly in the instrument. The marker dial is calibrated and can be set to the desired frequency. Let us say that it is 10.6 mhz. Then, wherever the marker pip appears on the response curve represents 10.6 mhz. (See Fig. 11.15.)

Fig. 11.15. The marker pip as it appears on the response curve.
For visual alignment of the R.F. circuits, the FM signal generator is connected to the antenna terminals. Assume that the initial alignment is to be made at 108 mhz. To produce a 10.7 -mhz marker on the response curve (obtained at the grid of the limiter), the marker generator must inject a 108 -mhz signal into the sweep signal. After this passes through the mixer, the 108 -mhz signal is converted down to 10.7 mhz.
There is still another method whereby we may obtain a marker indication at any point, but it requires the use of an AM signal generator. This second generator may be connected in parallel with the sweep (or FM) generator or it may be placed somewhere along the path through which the signal from the sweep generator must pass. The second generator is then set at the frequency at which we wish the marker indication to appear. The result on the screen of the oscilloscope will be a small pip or wiggle at the proper point in the characteristic curve.
As an illustration, suppose the I.F. system of the receiver is being aligned.
Connect the FM signal generator across the grid circuit of the mixer stage and, at the same time, connect the generator that will supply the marker frequency in parallel with the FM generator. (Place an isolating resistor of 270 ohms in series with the signal lead from the AM signal generator.
This will keep interaction between the two generators to a minimum. Also keep the output of the AM generator as low as possible while still being able to observe a wiggle in the response curve.) Let the FM generator sweep over the band in the usual manner. Set the AM generator-which develops a single signal at each dial setting--to 10.7 mhz. The oscilloscope, connected into the grid circuit of the limiter stage, will indicate a wiggle at the point where 10. 7 mhz is located. The response curve should peak at this point. If it does not, the several tuning circuits are adjusted until it does.
The marker indication is also good when aligning the discriminator. It may be used to indicate the two end points of the S-shaped discriminator curve plus the cross-over or central point. These are just a few of the uses of the marker points. The serviceman, in dealing with the equipment, will undoubtedly find many more.
ALIGNMENT OF FM CIRCUITS CONTAINING THE RATIO DETECTOR
To align FM receivers that do not use the Foster-Seeley discriminator but have another type of detector, such as the ratio detector, for example, it is necessary to modify the process somewhat. Furthermore, ratio detectors fall into two categories, balanced and unbalanced, and this introduces slight variations in the alignment procedure. We will start first with the unbalanced ratio detector, using an AM signal generator and a vacuum-tube voltmeter.
An unbalanced ratio detector is shown in Fig. 11.16. Connect the output lead from the AM signal generator through a 0.01-mf capacitor to the control grid of the I.F. amplifier tube just preceding the detector. Set the signal generator to the I.F. value. This signal should be unmodulated. Connect the vacuum-tube voltmeter between point A and ground. This connects the meter across the 25-mf capacitor and the 15,000-ohm resistor.
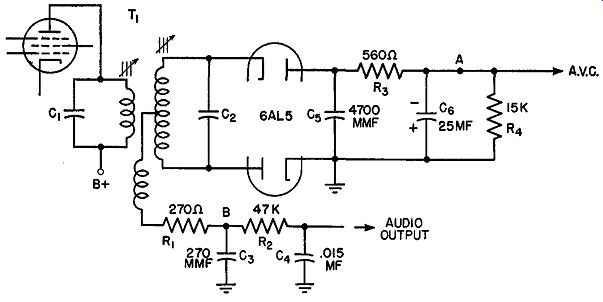
FIG. 11.16. An unbalanced ratio detector.
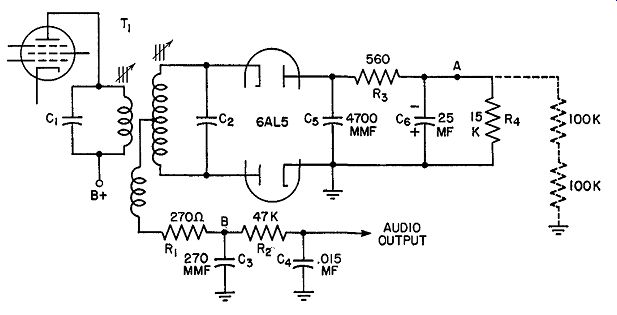
FIG. 11.17. Two 100,000-ohm resistors are connected as shown to balance
the detector. See text With the equipment thus set up, adjust the primary
core of T1 until maximum voltage is indicated on the vacuum-tube voltmeter.
To zero adjust the secondary winding of T1 , it becomes necessary to
balance artificially the detector. This balancing is done by connecting
two 100,000-ohm resistors (within 1 percent of each other) in series,
from point A to ground.
(See Fig. 11.17.) Connect the common lead of the vacuum-tube voltmeter to the junction of these resistors, and the d-c probe to point B. The signal generator remains where it was, with the same dial setting. Now adjust the secondary winding core in T1 for zero meter reading.
Detector linearity can be checked by shifting the signal frequency above and below 10.7 mhz and noting whether equal readings are obtained for frequencies which are equally above and below 10.7 mhz. The procedure is identical to the one discussed with Foster-Seeley discriminators.
After this has been done, the two 100,000-ohm resistors are removed from the circuit.
To align the I.F. system shift the AM signal generator to the grid of the converter or mixer tube. Set the generator to the I.F. frequency. The vacuum-tube voltmeter is connected between point A and ground of the ratio detector. Now adjust the primary point secondary cores of all I.F. trans formers for maximum meter indication. If the transformers are overcoupled, use a loading network as previously outlined.
It is possible to align the I.F. system first and then the ratio detector.
In this case, the signal generator is left at the grid of the mixer for the en tire operation. There is no need to shift it to the control grid of the I.F. amplifier preceding the detector for the latter's alignment.
To align the R.F. sections of the receiver, shift the signal generator to the antenna terminals of the set (using an appropriate matching network as indicated by the manufacturer). The vacuum-tube voltmeter remains connected between point A and ground. Set the generator and the receiver dial to 108 mhz and adjust the proper R.F. trimmers or cores for maximum meter reading. Next, change the generator frequency and the receiver dial to 88 mhz (or thereabouts) and adjust the proper trimmers or cores (as indicated in the manufacturer's service manual) for maximum indication on the meter. The set alignment is now complete.
In reading through the service literature that is put out by manufacturers, variations of the foregoing method will be found. Thus, some manufacturers suggest that an output meter be placed across the speaker voice coil instead of the vacuum-tube voltmeter mentioned previously. Since the signal must now pass through the audio amplifiers in order to reach the output meter, the I.F. signal from the generator must be amplitude-modulated.
Practically all AM signal generators contain provisions for modulating their outputs with a 400-hz audio note, hence this stipulation presents no difficulty. However, since a well-aligned ratio detector does not readily pass an amplitude-modulated signal, complete alignment of the detector is left for the last. Here is the sequence of alignment.
Connect an output meter across the voice coil of the speaker and connect the signal generator to the grid of the tube just preceding the detector.
Set the generator to the I.F. value (10.7 mhz) and switch on the modulation.
Now, with the secondary trimmer or core of the discriminator coil tuned as far out as it will go, adjust the transformer primary for maximum meter reading. This brings the primary winding into alignment. The secondary, however, is still far out of alignment and this is done purposely in order to permit the detector to respond to AM signals.
The I.F. and then the R.F. sections of the receiver are aligned next, at all times modulating the carrier signal with the 400-hz ( or whatever other low frequency note the generator contains). All adjustments in these two sections of the set are made for maximum meter indication.
After these circuits have been adjusted, the signal generator is moved back to the control grid of the tube preceding the ratio detector and set at the I.F. value. The secondary of the detector transformer is now adjusted for minimum reading on the output meter. At this point the AM rejection properties of the detector are best, and the circuit is in alignment.
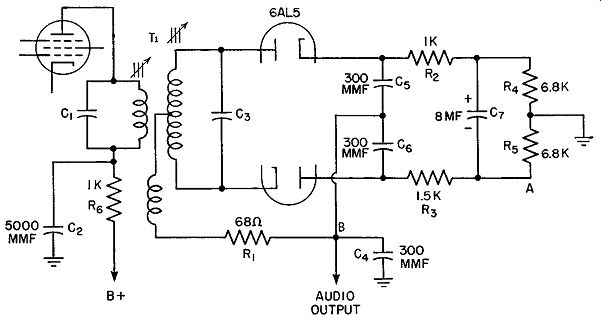
Fig. 11.18. A balanced ratio detector.
Balanced Ratio Detectors. When a balanced ratio detector (Fig. 11.18)
is encountered, the alignment procedure is modified only when the detector circuit itself is being adjusted. To adjust the detector, we proceed as follows: Connect the AM signal generator to the control grid of the last I.F. amplifier. Set it to the I.F. value (say, 10.7 mhz). Connect input. lead from a vacuum-tube voltmeter to point A, Fig. 11.18. Attach the common lead to the receiver chassis. Now, adjust the primary core of T1 for maximum meter deflection. Next, move the input voltmeter lead to point B and adjust the secondary core of T 1 for zero meter reading. Check the linearity of the detector response as discussed with the unbalanced ratio detector.
Visual Alignment. Visual alignment of receivers employing the ratio detector is best accomplished by first adjusting the ratio detector and then adjusting the I.F. and R.F. circuits. The ungrounded vertical input terminal of the oscilloscope is connected through a 10,000-ohm resistor, to point B. (Point B, Fig. 11.19, represents the audio output terminal of the detector.) The other terminal (ground) connects to the receiver chassis. The initial position of the sweep signal generator is between control grid and ground of the 6AU6 I.F. amplifier tube. A .01-mf capacitor is inserted in the output lead of the generator. Set the generator to 10.7 mhz, with a sweep of ±450 khz. On the oscilloscope screen, the S-curve characteristic of ratio detectors should be visible. Adjust the primary iron core of T1 for maxi mum linearity of the S-curve. Next, adjust the secondary iron core until the S-curve is symmetrical, with as much linear section above the 10.7 -mhz marker point as below. A marker signal, obtained from an AM generator, can be used to determine the frequency extent of the linear section of the S-curve. The curve should be straight for at least ±100 khz.
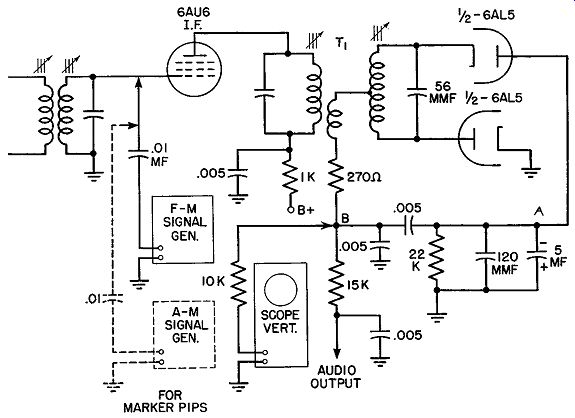
Fig. 11.19. Connection of test equipment to adjust visually the ratio
detector.
The sweep generator and the marker generator are now shifted to the mixer signal grid. The ungrounded vertical input lead of the oscilloscope is connected, through a 10,000-ohm resistor, to point A, Fig. 11.19. The ground terminal connects to the receiver chassis. Remove temporarily the 5-mf capacitor connected from point A to ground. Keep the signal generators at the same frequency used previously, and adjust the primary and secondary windings of each I.F. transformer for maximum amplitude and balance of the response curve. (See Fig. 11.14A.) Note that loading networks are not required with the visual alignment methods. The I.F. system is now adjusted. Reconnect the 5-mf capacitor.
The purpose in removing the 5-mf electrolytic capacitor, as indicated in the foregoing paragraph, is to permit the voltage variations caused by the FM signal passing through the I.F. system to appear at point A. When viewed on the oscilloscope screen, these variations represent the response curve of the I.F. system.
Sweep alignment of the R.F. stages of an FM receiver is seldom required. Simple peaking using an AM generator, as previously described, is the method generally recommended by receiver manufacturers. However, if sweep alignment of the R.F. stages is desired, it is carried out as follows: Connect the sweep generator to the antenna terminals of the receiver.
The oscilloscope is connected to point A, Fig. 11.19. The sweeping range of the generator is set for approximately 1 mhz, and the center output frequency is. adjusted to 108 mhz. Set the dial of the receiver to the same frequency.
Now adjust the oscillator and input trimmer capacitors (as specified by the manufacturer) until the I.F. response curve possesses maximum amplitude and is symmetrical about 10.7 mhz. However, if the R.F. stages are not properly adjusted, the response pattern will become distorted. The R.F. stages are correctly adjusted when the response curve possesses its proper form with a maximum amplitude.
The same procedure is repeated at 88 mhz, completing the front-end alignment of the set.
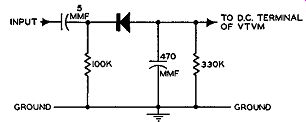
Fig. 11.20. Circuit of the probe required in the alignment of FM receivers
employing the beam-gated tube.
Alignment Procedure for Beam-Gated Tubes. The alignment procedure for FM receivers using the 6BN6 (or 3BN6) beam-gated tube differs in many respects from the alignment one of the other detectors. The first difference occurs in the alignment of the I.F. stages themselves. Since the 6BN6 removes amplitude variations, and therefore cannot be transformed into an AM detector, it becomes impossible to place either a vacuum tube voltmeter or an oscilloscope at any point in this circuit and obtain the proper indications for peaking the I.F. coils. Hence, to align the I.F. system, a special probe detector must be constructed. A suggested circuit of a probe is shown in Fig. 11.20, using a germanium crystal. When constructing this probe, be careful to keep the length of all connecting leads between components as short as possible.
To align the I.F. system, connect the input lead of the probe to grid 1 of the 6BN6. (See Fig. 11.21.) The output lead connects to the d-c scale of a vacuum-tube voltmeter, while the other output lead connects to the ground or common terminal of the meter. This same lead also connects to the receiver chassis. An AM signal is connected, in turn, to each of the control grids of the I.F. amplifier tubes, and the transformer associated with that stage is adjusted for maximum meter indication. This is done for each I.F. amplifier in exactly the same manner that it is done in sets using the ratio or Foster-Seeley detectors, always using as low a signal as possible .
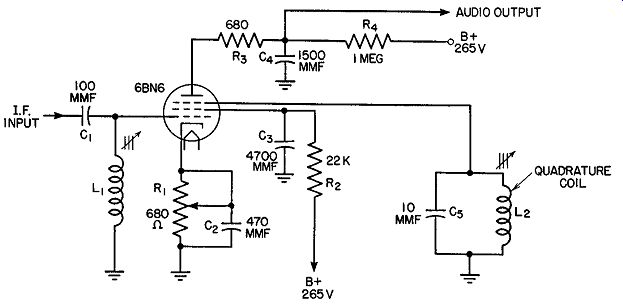
Fig. 11.21. The beam-gated tube connected as a limiter-discriminator.
After the I.F. system is aligned, the signal generator is moved to the in put terminals of the receiver, and the R.F. section is adjusted for maximum indication on the probe meter. If visual alignment is desired for either the RF. or I.F. sections of the receiver, the output of the probe detector connects to the vertical input terminal of the oscilloscope, and an FM sweep generator is used.
To adjust the discriminator, the probe detector with its meter is left connected to grid 1 of the 6BN6. The signal generator, however, is removed, and the regular set antenna is now connected to the receiver and a station tuned in. The set should be tuned for maximum deflection on the probe meter, thereby indicating that the station is properly tuned in. As an added precaution, the dial should be rocked back and forth until the meter deflection is maximum. The volume control should be turned completely counter clockwise so that no sound is heard from the speaker.
When the station is correctly tuned in, the volume control is advanced until speech or music is heard, and the quadrature coil of the 6BN6 is adjusted for best sound from the speaker.
There still remains the adjustment of the variable resistor in the cathode leg of the tube. The function of this resistor, it will be recalled, is to provide the proper grid bias for the limiter, in order that the best limiting action (for AM rejection) be obtained. A method of adjusting this control which is both simple and satisfactory is to place the set in operation just as it normally would be and then tune in a signal of medium strength. Insert a resistive attenuator pad between the antenna and the receiver and reduce the received signal to a level where hiss is heard with the sound. Now adjust the cathode control of the 6BN6 for clearest sound and the least amount of hiss. During the adjustment, the hiss may disappear. If this occurs, the input signal must be further reduced so that the hiss never disappears during alignment.
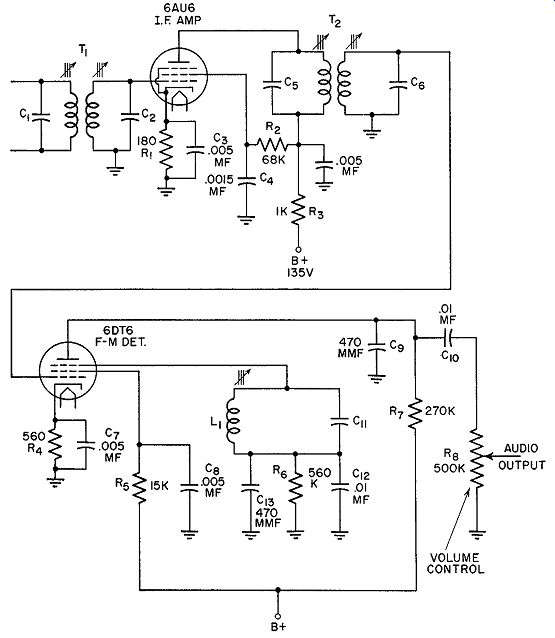
Fig. 11.22. An I.F. amplifier and 6DT6 F-:VI detector circuit.
It is possible to align a 6BN6 FM system without test instruments if the tuned circuits are not too far out of alignment. The procedure is as follows. Tune in a station and then use a resistive antenna attenuator to decrease the incoming signal until a hiss is heard in the sound. Now, adjust the I.F. and R.F. tuned circuits, including L2 and R1 (Fig. 11.21) for maxi mum clear sound and minimum hiss. If the hiss disappears during alignment, increase alignment until it reappears.
6DT6 FM Detector. Although this type of FM detector circuit (Fig. 11.22) is similar in many aspects of its operation to gated-beam tube detectors, there are certain differences, arising chiefly from the extreme sensitiveness of the circuit. Here is a typical procedure, as recommended by Motorola for the above circuit.
Best alignment is achieved using a received station signal instead of a generated signal. Since the detector is extremely sensitive, a relatively small input signal will cause grid current to flow in both the I.F. amplifier and the detector stages. Grid current through the tuned coils will load them down, making the adjustment quite broad and alignment impossible. For this reason it is necessary to use a very weak signal when aligning the driver and the detector input coils. Actually, the signal should be well down into the noise level for proper tuning action.
Procedure (for Strong Signal Areas):
1. Connect the negative lead of the VTVM to the junction of R6 (560K) and the bottom of L1. Connect the positive meter lead to chassis ground.
2. Tune in a station.
3. Set the volume control for average usable sound amplification.
4. Adjust the quadrature coil (L1) for maximum negative reading on the VTVM. There are two points of tuning for the quadrature coil-one of which is incorrect. The correct tuning point will produce approximately 2½ volts.
The incorrect tuning point will produce approximately 1½ volts. Severe misalignment of the sound I.F. and FM detector grid coils will reduce the value of this tuned voltage. If this occurs, tune for maximum negative reading on the VTVM; later adjustment of the input coils will produce the 2½ volts.
After the correct tuning point has been established, make the final adjustment of the quadrature coil based on minimum sound distortion. Make no further adjustments of the quadrature coil during the remainder of the alignment.
5. Reduce the signal input at the antenna ( disconnect one or both leads and separate from the receptacle or insert resistors) until the sound has been weakened considerably (hiss should be heard).
6. Adjust the primary and secondary of T2 for best signal-to-noise ratio as determined by listening to the sound. If the signal is too strong, exact tuning will be difficult. ( Cores of transformer must be turned as far from each other as possible so that the cores are just entering the coils.)
7. Adjust transformer T1 for best signal-to-noise ratio as determined by listening to the sound output. If the signal is too strong, exact tuning will be difficult. If there are any other I.F. transformers, adjust their cores in similar fashion.
8. Readjust for best possible signal-to-noise condition.
9. If considerable alignment was required to complete the foregoing procedure, it would he advisable to recheck the tuning of the quadrature coil using a strong signal as in Step 4. However, if the quadrature coil is re aligned, it will be necessary to repeat Steps 5, 6, and 7 for tuning of T1 and T 2, using a weak signal.
Procedure (for Weak Signal Areas).
1. Connect the negative lead of the VTVM to the top of R6 . Connect the positive meter lead to chassis ground.
2. Using maximum available signal input, roughly align the cores of T1 , T2, and L1 for maximum quadrature grid bias (meter reading) of 1½ volts.
(See note under Step 4 of the procedure for strong signal areas.)
3. Using maximum available signal, align the quadrature coil (Li) for minimum sound distortion.
4. Using the weakest signal possible, adjust the primary and secondary of T1 for best signal-to-noise conditions. (Turn cores of transformer as far from each other as possible so cores are just entering the coils.)
5. Using a weak signal, adjust transformer T1 for best signal-to-noise ratio. (Turn core as close to chassis metal as possible.)
6. Repeat the procedure several times, if required, until the optimum adjustment is obtained. Keep in mind that the I.F. amplifier and detector input coils must always he readjusted on a weak signal if the quadrature coil setting is changed.
EXAM
1. What two methods can be employed to align FM receivers? Can the same methods be used with AM receivers? Explain.
2. What similarities exist between the basic alignment procedure for AM and FM receivers?
3. How is a Foster-Seeley discriminator aligned, using an AM signal generator and a voltmeter?
4. Describe the alignment of a two-stage transformer-coupled limiter. What precautions must be observed when limiters arc aligned?
5. Can improper alignment of the I.F. and limiter stages affect the operation of the discriminator? Explain.
6. What effect does the type of FM detector used have on the method of alignment?
7. What effect will a strong signal have on the alignment of the I.F. and limiter stages? Assume the indicating meter is placed in the grid circuit of the limiter.
8. What is the purpose of an overall alignment check on the I.F. and detector stages? Describe how this check is carried out.
9. How are over-coupled I.F. transformers aligned?
10. Why is the I.F. system aligned before the R.F. section of the receiver'? Would it be possible to reverse the process.? Explain.
11. Describe the alignment of the R.F. section of an FM receiver.
12. What equipment is needed to run a visual check on a receiver? Explain how each piece of equipment is used.
13. Explain the difference between sine-wave deflection and sawtooth deflection of the electron beam in the oscilloscope.
14. What would happen if a sweep generator using sine-wave modulation was used in conjunction with an oscilloscope in which the electron beam was deflected by a sawtooth voltage? How would the response pattern appear on the scope screen?
15. Why is a phase control incorporated in sweep signal generators?
16. What are marker frequencies? Why are they used?
17. Describe the alignment of the I.F. system and the discriminator by the visual method.
18. How are marker signals developed?
19. What differences are there between the alignment of balanced and unbalanced ratio detectors?
20. Describe the alignment procedure for FM systems using beam-gated detectors.
+++++++++++