EQUALIZATION requirements in a tape recorder can be fairly formidable in terms of the amount of bass and treble boost required. If the response is to be reasonably flat over all or most of the audio spectrum, the designer must consider the maximum equalization required, the point at which bass or treble response begins to rise (turnover frequency) and the shape of the response characteristics. There are a variety of equalization circuits. The choice is governed not only by the considerations just listed but also by the manner in which these circuits affect distortion and high-frequency response.
One section cannot present all the equalization networks found in various tape recorders. What will be attempted instead is to cover adequately the basic circuits and some of their popular commercial variations and to explain in basic terms how they work.
The discussion, in part, will be divided between record and playback equalization. Each will present treble- and bass-boost circuits commonly found in tape recorders. Let us begin by examining some general principles of equalization.
In the accompanying figures some of the values shown are rounded for ease of illustration.
General principles
Fundamentally, equalization is of two sorts, losser or feedback.
[1. For excellent discussions of the subject, the reader is referred to the sections on equalization in the following books: High-Fidelity Circuit Design by Norman H. Crowhurst and George Fletcher Cooper; Understanding Hi-Fi Circuits by Norman H. Crowhurst. Published by Gernsback Library, Inc.]
--------------- Example: R = 100,000 ohms; C = .016 Af; f = 100 hz =_-
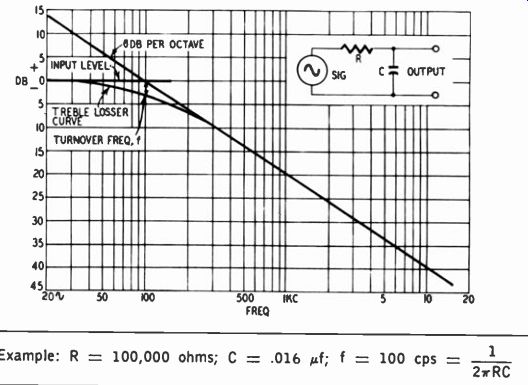
Fig. 701. Treble droop produced by an R-C losser circuit.
----------------
Losser equalization is in the nature of a high- or low-pass filter; the desired frequencies go unattenuated from one amplifier stage to the next while the less desired ones are attenuated by being blocked or shunted to ground. Feedback equalization operates by controlling the gain of an amplifier stage; negative feedback is applied for all frequencies, but more so for the undesired ones, thus reducing gain for the latter.
Lesser circuits Figs. 701 and 702 show two basic losser circuits, a treble and a bass losser, respectively. Also shown are the response curves produced by each. These are called R-C curves because they are produced by resistance and capacitance. Looking at Fig. 701, the following should be noted:
1. High frequencies are attenuated because Xe, capacitive reactance, becomes smaller as frequency increases. R and X, essentially form a voltage divider and, as frequency rises, the out put voltage across C becomes a smaller portion of the input voltage.
2. The turnover frequency f is the point at which the values of R and X, are equal. There is a 3-db difference between the output voltage at this point and the flat region. The turnover frequency and 3-db point are synonymous.
-------------
Example: R = 100,000 ohms; C = .0008 1.4f; f = 20,000 hz = 1 2TRC Fig. 702. Bass droop produced by an R-C losser circuit.
---------------
Given R and C, the turnover frequency is obtained by the formula f = 2 pi RC, where f is hz per second, it approximately 3.14, R in ohms and C in farads. The turnover point has meaning not only in mathematical terms but also in everyday experience because differences in sound level ordinarily are appreciable only when they exceed 3 db (although they may be detectable when they exceed 1 or 2 db). The product RC is referred to as the time constant (the time required to charge C through R to 0.636 of maximum voltage or to discharge C through R to 0.364 of original voltage).
3. Several other formulas relate frequency f, resistance R, capacitance C and capacitive reactance X, to each other. Since R and X, are equal at the turnover frequency, these terms can be substituted for each other. Useful variations of the basic formula are:
R- 1/2 pi fC
C- 1/2 pi fR
4. Above the turnover frequency, the curve conforms to what is called a 6-db-per-octave characteristic. The phrase "proportional characteristic" might be more descriptive. That is, the change in output voltage is exactly proportional to the change in frequency.
This relationship may be direct or inverse. In Fig. 701, it is in-verse. As frequency goes up, output declines proportionately.
When frequency doubles, the output is cut in half. Since a doubling in frequency corresponds to one octave and since halving the voltage output corresponds to a 6-db change, the linear portion is called a 6-db-per-octave characteristic.
5. In the vicinity of the turnover frequency, an R-C response curve changes by, or has a "slope" of, less than 6 db per octave.
A couple of octaves are required on either side of the turnover point before the slope reaches 6 db per octave or flattens out.
Going in the direction of the 6-db-per-octave portion, there is a 4-db decline in the first octave beyond the turnover frequency, a 5-db decline in the second and a 6-db decline thereafter. Going in the direction of the flat portion, there is a rise of 2 db in the first octave, nearly 1 db in the second and none thereafter. Fig. 702 is a mirror image of Fig. 701. The high frequencies get through the capacitor easily, while low frequencies do not. R and X, essentially form a voltage divider and, as frequency declines, the output voltage across R becomes a smaller portion of the in put voltage. The formulas for calculating turnover frequency, resistance or capacitance are the same as those listed earlier.
Theoretically, an inductance (L) could be substituted for the capacitance in Figs. 701 and 702 to obtain similar effects. The basic formula would be f = 2 π RL. The R-L response curves would be just the opposite, however. For example, if an inductance were substituted in Fig. 701, the response characteristic would be that shown in Fig. 702 because the reactance of the coil increases with rising frequency, instead of declining as in the case of a capacitor. However, R-L circuits are only of academic interest for tape recorders. Various factors make the use of inductors impractical in this application: Inductors are expensive, may pick up hum, are relatively fragile and have some resistance which produces losses and prevents response curves from having the degree of precision that can be produced by R-C networks.
On the other hand, R-L-C (resistance-inductance-capacitance) networks are often used when the desired shape of the equalization curve is steeper than a 6-db-per-octave characteristic. The R-L-C combination provides the well-known sharply rising characteristic of a tuned circuit, as shown in Fig. 703. R1 and R2 form a voltage divider, R2 being considerably smaller, so that over most of the audio range the output voltage is appreciably less than the input voltage; the maximum amount of this attenuation is termed "insertion loss."
Fig. 703. Response of an R-L-C circuit.
However, at the resonant frequency, the impedance of L and C in series becomes very small and bypasses R1. R2 becomes the larger leg of the voltage divider, and output voltage rises rapidly.
Since the output declines again on the other side of resonance, the R-L-C network is used on y at one end of the audio spectrum, almost always the treble end. Given L and C, the resonant frequency is obtained by the formula:
f- 1 2 pi V17C
By transposing terms, L or C can be determined when the frequency and either C or L is given. Thus:
1 1 C = L =
(2 pi f)2L (2 pi f)2C
The sharpness of the resonant peak depends upon the relative values of L and C compared to R1.
Continuing this discussion, but returning to the R-C losser networks, the basic circuits in Figs. 701 and 702 may be combined in various ways to produce more complex curves. Figs. 704 and 705 show two complex curves of fundamental importance. Where as the curves of Figs. 701 and 702 have a continuing decline at either the treble or bass end, this is often undesirable in practical circuitry. The designer usually wants to shape the curve more exactly; he wants it to level off at both an upper and a lower frequency as in Figs. 704 and 705, not just at one end or the other as in Figs. 701 and 702.
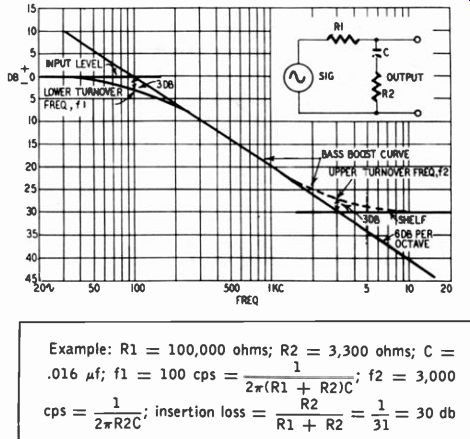
Fig. 704. Bass boost produced by an R-C losser circuit.
Fig. 704 may be viewed as a bass-boost curve for tape recorder applications, although in other situations it might be called treble droop. In broad terms, R1 and C correspond to R and C in Fig. 701, and their effect is portrayed by the solid portion of the response curve in Fig. 704. C and R2 account for the dashed portion. At very high frequencies, the equivalent circuit is a voltage divider comprising R1 and R2. Hence a limit is set to the maxi mum drop in high-frequency response; this maximum drop is referred to as the "insertion loss." The lower limit to which gain declines may be referred to as a "shelf." As the frequency de clines from the upper extreme, the reactance of C, namely Xe, approaches that of R2; at the upper turnover frequency designated as f2, R2 and X, are equal and output is 3 db above the shelf. As frequency declines further, X, increases and the output goes up by voltage-divider action until the value of X, approaches that of R1. When X, becomes equal to R1 + R2 (at a relatively low frequency), the output voltage is within 3 db of the input voltage and a further rise is therefore very limited. In most in stances R1 is much bigger in value than R2 so R1 + R2 is essentially determined by the value of R1.
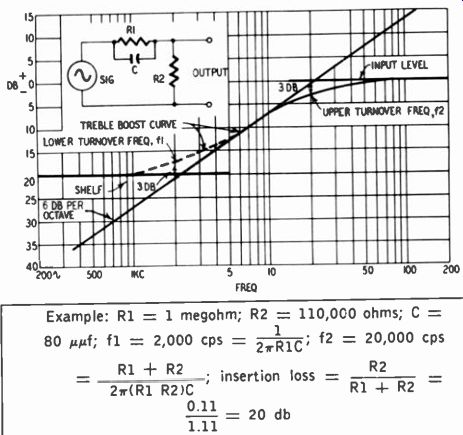
Fig. 705. Treble produced by an R-C losser circuit.
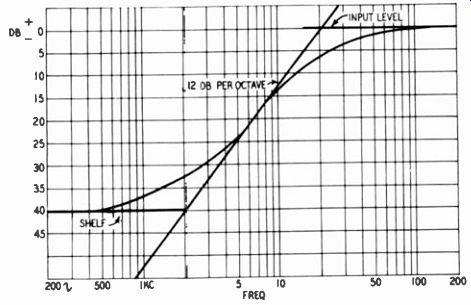
Fig. 706. Treble boost produced by using circuit in Fig. 705 in two
amplifier stages.
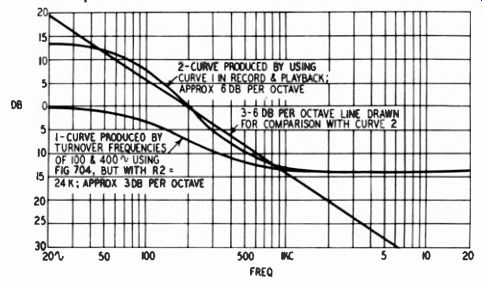
Fig. 707. Response curve having a slope of about 3 db per octave.
The circuit of Fig. 705 may be viewed as treble boost. Broadly, R2 and C correspond to R and C in Fig. 702 and account for the solid portion of the response curve in Fig. 705. At very low frequencies, the equivalent circuit is a voltage divider comprised of R1 and R2, the latter forming a shelf at the low end. As the frequency increases, X, declines and at the turnover frequency the reactance of C is equal to R1 and the output voltage is 3 db above the shelf. As X,, declines further with increasing frequency, the voltage-divider action of Xe and R2 causes the output across R2 to increase. However, this increase approaches a halt when R1R2 , (R1 and R2 in parallel), at the turnover frequency f2; the output is then within 3 db of the input voltage.
R1 + R2
The R-C combinations discussed thus far approach 6-db-per-octave characteristics. However, several similar R-C networks may be cascaded (that is, used in series or in successive amplifier stages) to obtain more steeply rising or falling characteristics. The maximum rate of rise or fall is a multiple of the number of R-C networks used. A characteristic curve approaching 12 db per octave, produced by using the same R-C circuit in two amplifier stages, is illustrated in Fig. 706.
On the other hand, it may be desired to obtain a curve which rises or falls less than 6 db per octave. This can be done, over a limited span, by bringing the upper and lower turnover frequencies close together so that the response characteristic does not cover a sufficient number of octaves to attain a 6-db-per-octave slope. Curve 1 in Fig. 707 illustrates a response curve with a slope of about 3 db per octave obtained in this manner.
Feedback
The basic principle of feedback is simple. All other factors remaining the same, the gain of a tube is constant. The input is the voltage between control grid and cathode. Regardless of the signal impressed between grid and ground, it is the potential be tween grid and cathode that counts. Therefore, effective input can be reduced in two basic ways: (1) by applying to the grid a feedback voltage with a polarity opposite to the audio signal on the grid; (2) by applying to the cathode a feedback voltage with the same polarity as the audio signal applied to the grid.
If the cathode varies in the same direction as the grid, then the difference in voltage between grid and cathode is reduced, there by cutting down the effective input.
Negative feedback falls into two basic categories: voltage feed back and current feedback. Although the same response curves can be obtained by either means, each type has distinctive characteristics which may or may not he desirable.
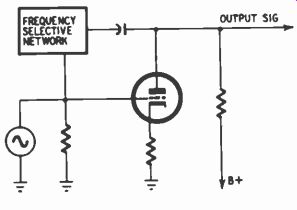
Fig. 708. Plate-to-grid voltage feed back.
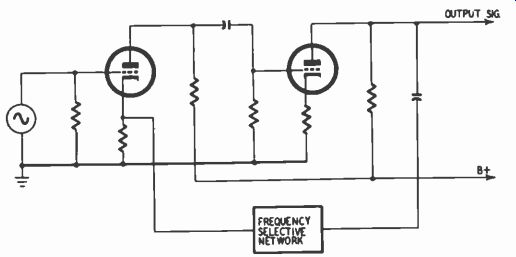
Fig. 709. Plate-to-cathode voltage feedback.
Voltage feedback
Voltage feedback-where feedback is obtained from the output voltage-is illustrated in Figs. 708 and 709. In Fig. 708, feedback is applied from plate to grid. Assume that the instantaneous signal voltage at the grid is positive. When the grid of a tube goes positive, its plate goes negative. Through the frequency-selective network, a fraction of the negative voltage at the plate is applied to the positive grid, reducing the net signal at the grid. Other sections of this section will discuss details of the frequency-selective network; it is sufficient here to state that R-C components are usually employed, and turnover frequencies are determined in a manner akin to those in losser circuits.
In Fig. 709, voltage feedback is shown applied to the cathode of the input tube. If the cathode polarity varies in the same direction as the grid polarity, the difference in voltage potential be tween the grid and cathode is reduced. Assuming that the instantaneous signal voltage at the grid of the input tube is positive, a positive voltage for feedback to the first cathode is obtained at the plate of the second tube. (Although the feedback signal polarity is positive, this should not be confused with the fact that the type of feedback is negative inasmuch as it is used to offset original input, or reduce gain.) The frequency-selective network is along the lines of that in Fig. 708.
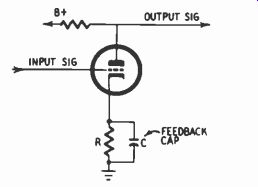
Fig. 710. Treble boost by means of R-C current feedback.
Current feedback
By contrast, current feedback usually does not require connecting one tube element to another. The feedback voltage can be generated at the cathode by the simple expedient of using a relatively large cathode resistor and omitting the bypass capacitor.
Assume the instantaneous signal voltage at the grid is positive, causing increased current to flow in the tube. This current goes through the cathode resistor. The increased current through the cathode resistor causes a larger voltage to appear across it. Since the electron flow is from ground to cathode, the cathode becomes more positive with respect to ground. In sum, when the grid goes positive, the cathode also goes more positive and, as already stated, if the polarity at the cathode varies in the same direction as the signal at the grid, the effective input is reduced. The larger the resistance (or reactance) between cathode and ground, the greater is the feedback and the lower the overall gain.
-----------------
Treble boost reaches maximum when the reactance of L = the reactance of C;
f = 1 2wVre
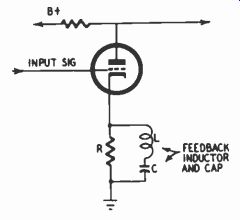
Fig. 711. Treble boost by means of R-L-C current feedback.
----------------------
To achieve frequency equalization, the cathode resistor is bypassed so as to reduce feedback at those frequencies where higher gain is desired. Figs. 710 and 711 illustrate two basic methods of obtaining high-frequency boost by current feedback. In Fig. 710, a relatively small capacitor is used; its reactance relative to that of the resistor becomes small at high frequencies, where it serves to increase gain because the smaller the reactance between cathode and ground, the less feedback there is. The response curve resulting from the circuit in Fig. 710 tends to follow a 6-db-per-octave characteristic since it is formed by R-C components.
In Fig. 711, the feedback resistor is bypassed by an inductance and capacitance in series. This causes gain to rise sharply in the manner of a tuned circuit (and then to fall again on the other side of resonance).
Record equalization
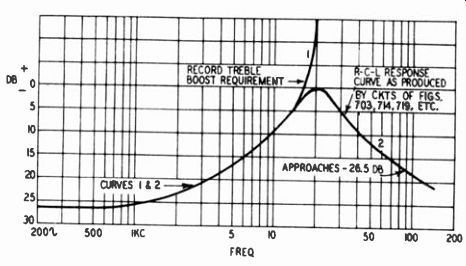
Fig. 712. Use of an R-L-C- response curve to match record treble-boost
requirement of a tape recorder operating at 7.5 ips.
Although tape recorders have incorporated varying concepts of how equalization should be achieved, there has been growing recognition of the fact that for optimum results treble boost should take place chiefly in record and bass boost chiefly in play back. NARTB equalization embodies this principle. Virtually all professional machines and an increasing number of moderate-price ones are using NARTB equalization at 7.5 and 15 ips, and modified versions of it for different tape speeds.
Accordingly, this discussion shall in the main be oriented to the fact that record equalization calls for a substantial amount of treble boost and a slight amount of bass boost. But many recorders still use so-called half-and-half equalization, where half the treble boost is achieved in record and the other half in playback; and similarly for bass boost. It will be assumed, unless otherwise stated, that equalization is for the 7.5-ips speed, the lowest at which it is possible today to maintain relatively flat response out to 15,000 hz.
Record treble boost
For recording more or less in conformity with the NARTB characteristic at 7.5 ips and at the same time using enough bias current to result in low distortion at high record levels, the required treble-boost curve must invariably have a slope greater than 6 db per octave over a sizable region if the frequency response is to be reasonably flat out to 10,000 hz or beyond. This is because normal bias values together with other factors (principally demagnetization effect) result in a precipitous decline in the amount of signal recorded on the tape at high frequencies.
Actually, record losses vary inversely with recorded wavelength: the higher the frequency and/or the slower the tape speed, the shorter the wavelength. Thus, in the attempt to get out to 15,000 hz or nearly so at 7.5 ips, considerable record losses have to be overcome by treble boost.
------------------
Example: R1 = 240 ohms; R2 = 5,000 ohms; L = 20 mh; f1 = 2,000 hz = ; f2 = 40,000 hz =_ 2w1;
R1 + R2;
insertion loss = R1 1
= 26.5 db 2wL R1 + R2 21
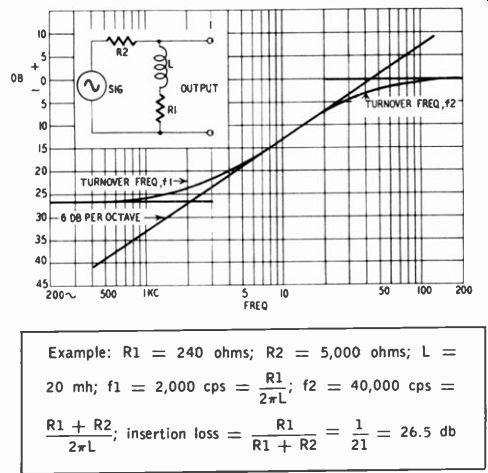
Fig. 713. Treble boost produced by an R-L losser circuit.
----------------------
The sharp treble boost required to satisfy the NARTB record characteristic, or modifications of it, may be had most conveniently by means of tuned R-L-C circuits. The required slopes can less easily be approximated by cascading several R-C circuits. Although such cascading produces a boost considerably in excess of 6 db per octave, still the response curve does not rise as sharply as an R-L-C one.
Fig. 712 shows the response characteristic of a typical a-L-C curve as well as the hypothetical treble-boost requirement of a tape recorder. Curve 1 is the required treble boost out to 20,000 hz, while curve 2 is the tuned-circuit characteristic. The steepness of the slope of an L-C tuned circuit is controlled by its Q (the ratio of the inductive reactance of the coil at the resonant frequency to the resistance of the coil).
The R-L-C circuit does not provide full compensation. Beyond 15,000 hz, the two curves diverge: the R-L-C curve levels off while the required boost approaches a slope that is al most infinitely steep. However, out to the frequency of interest, assumed to be 15,000 hz in Fig. 712, the two curves coincide so that the R-L-C circuit does what is necessary within the practical audio range. In some tape recorders, the maximum frequency of interest might be 12,000 or even 10,000 hz at 7.5 ips, depending upon the designer's judgment as to what is the best compromise among the conflicting requirements of good treble response, low distortion and high signal-to-noise ratio.
------------------
Example: R1, R2, L and fl as in Fig. 713;
C = .0032 µf; f2 = 20,000 hz =
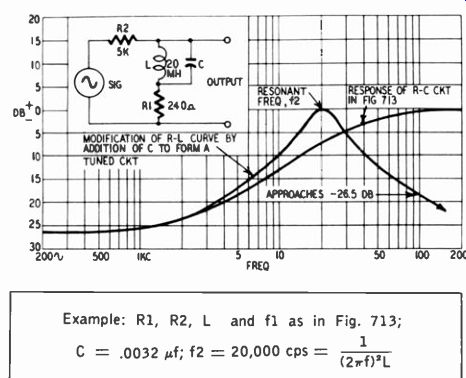
Fig. 714. Conversion of treble-boost curve in Fig. 713 into a tuned
circuit characteristic (R-L-C curve).
-------------------
Because the R-L-C curve can be easily tailored to coincide with the treble-boost requirement, it is ideally suited for record equalization. Let us see how a typical R-L-C treble-boost circuit of the losser type can be so shaped.
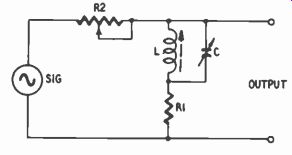
Fig. 715. Flexible version of circuit in Fig. 7/4. See Fig. 716 for
the effects of varying R2, L or C.
Fig. 713 shows a treble-boost curve produced by an R-L circuit. R1 and R2 form a voltage divider, in which resistor R1 determines the low-frequency shelf. The output voltage is 3 db above the shelf (turnover frequency) when R1 and the reactance of L are equal. However, a rise faster than the 6-db-per-octave slope produced by this circuit is needed. This can be had by placing a capacitor in parallel with L, producing a tuned-circuit response characteristic, as shown in Fig. 714.
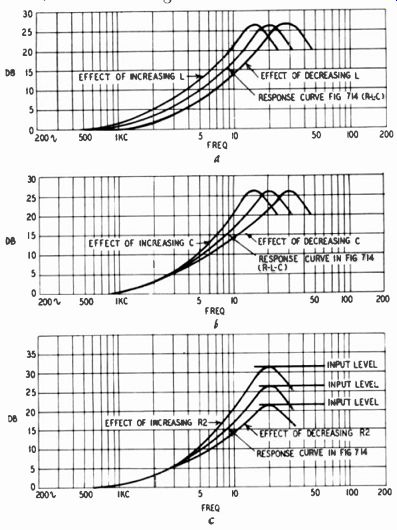
Fig. 716-a. Effect of varying L in Fig. 714; b) effect of varying C
in Fig. 714; c) effect of varying R2 in Fig. 714. Input levels are actually
the same for all curves, but are shown differently for clarity of presentation.
Given L, the maximum response can be obtained at the desired frequency by choosing C in accordance with the formula mentioned earlier. By varying R1 with respect to R2, maximum gain can be varied; that is, the low-frequency shelf can be changed.
By varying L with respect to R1, the point at which treble boost begins (turnover frequency) can be controlled. For example, if L is reduced, its reactance equals R1 at a higher frequency. How ever, as L is varied to shift the turnover frequency, C must also be adjusted if it is desired to maintain maximum response at the same frequency. If these two measures are taken simultaneously, the slope of the treble-boost curve becomes either more or less steep.
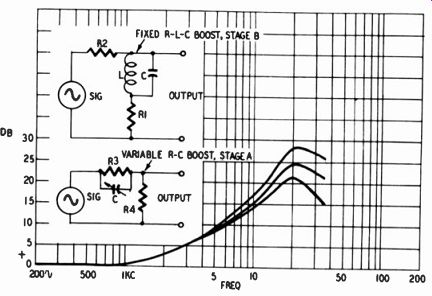
Fig. 717. Variations in total response produced by variable R-C treble
boost plus fixed R-L-C treble-boost circuits in separate amplifier stages.
Fig. 715 is a modified version of Fig. 714, the difference lying only in the fact that all components but R1 are made variable so that gain, slope and frequency of maximum response can be adjusted. Fig. 716 shows the effects of varying one element at a time.
Fig. 716-a shows that as L is changed, not only does the frequency of maximum response shift, but so does the turnover frequency.
Fig. 716-b shows that if C alone is varied, the rise in response be gins at the same point and only the frequency of maximum response is affected. Fig. 716-c shows that as R2 is varied, the gain of the response curve changes. Actually, the peak level at resonance stays constant and it is the shelf that changes level, but the presentation in Fig. 716-c illustrates the effect better.
Although networks as flexible as that of Fig. 715 have been incorporated in some custom recorders, fortunately in commercial practice a smaller number of adjustments, usually one, suffice. If a manufacturer were to use the circuit of Fig. 715 during the design stage of a recorder, by calculation and experiment he would ascertain the necessary values for each component in the boost net work, taking into account the rest of the amplifier circuit, the tape he recommends and the optimum bias value. Thenceforth he could build the boost circuit with fixed values of resistors, coil and capacitor, as in Fig. 714. To permit some flexibility, he might leave one of the components variable.
---------------
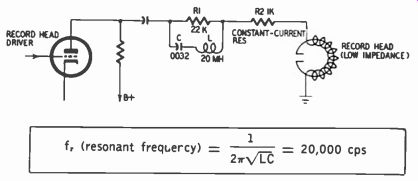
Fig. 718. Example of treble boost produced by an RLC losser circuit.
---------------
A frequent practice is to introduce variability in a separate circuit which helps shape the total treble-boost characteristic. For example, the circuit shown in Fig. 705 often provides part of the required treble boost. In this case, a certain amount of flexibility can be had by making the capacitor in Fig. 705 variable; a padder type capacitor is often used, yielding response variations as shown in Fig. 717.
The question of flexibility in the treble-boost characteristic is important. In almost all moderate-price recorders, and occasion ally in professional ones, there is no equalization adjustment. This would be fairly reasonable if, as was the case until a few years ago, response were expected to extend only to a recorded wavelength of 0.001 inch. At 7.5 ips this translates into a frequency of 7,500 hz, and at 15 ips into a frequency of 15,000 hz. But improved playback heads (narrower gaps) and improved tapes (better high-frequency response) have raised expectations to 15,000 hz at 7.5 ips. At this speed, however, record losses on the tape beyond 7,500 hz are still so severe as to require a large amount of equalization as well as careful setting of bias current because treble losses vary directly with bias. To record to 15,000 hz at 7.5 ips requires far more accurate adjustment of equalization and bias than if 7,500 hz were the upper limit. Therefore, if optimum results are to be had from a 7.5-ips tape recorder, one of these results being substantially flat response to 12,000 or 15,000 hz, it is highly desirable that treble boost be adjustable. (The same applies to bias current.) Fig. 718 shows an R-L-C treble-boost circuit of the losser type. Maximum boost is determined by the relationship between R1 and R2, which form a current-limiting resistance. At low frequencies, current to the record head is a small fraction of maxi- mum possible current because R1 is fairly large. But at high frequencies the impedance of L and C in series becomes low enough to bypass R1, thus decreasing the series impedance and increasing current to the head. Minimum impedance occurs at the L-C resonant frequency. This is 20,000 hz for the values given in Fig. 718, so that the lower slope of the resulting response curve matches the treble-boost requirement.
Turning to feedback circuits, Fig. 719 shows a popular R-L-C treble-boost network. An unbypassed cathode resistor produces feedback, the amount depending upon the value of the resistor.
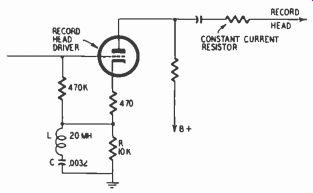
Fig. 719. Example of treble boost produced by R-L-C- current feedback.
------------
The response curve is similar to Fig. 705.
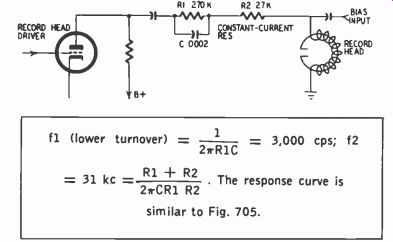
Fig. 720. Example of treble boost produced by an R-C losser circuit.
------------
In Fig. 719, feedback is principally due to R. (The reason for connecting the grid resistor to the intersection of the 470- and 10,000-ohm resistors is to place the grid at the proper negative dc bias voltage relative to the cathode for linear operation of the tube. If the grid resistor went to ground, the cathode would be at an excessive dc positive voltage relative to the grid. This is the same as saying that the grid would be at an excessive negative potential relative to the cathode.) At high frequencies, the series impedance of L and C becomes low and serves to bypass R. thus decreasing feedback and increasing gain. Maximum gain occurs of course at the resonant frequency of L and C when they present a virtual short circuit across R.
--------------------
Example: R1, R2, C1, fl and f2 as in Fig. 705; C2 = .03 1.4f; f3 = 5 hz; f4 = 50 hz. C1 corresponds to C in Fig. 705.

Fig. 721. Combined treble and bass boost produced by R-C losser circuit.
---------------------
The advantage of using a negative feedback circuit, such as Fig. 719, is that feedback serves to reduce distortion. In other words, to the extent that the tube introduces distortion products (frequencies) not originally present in the audio signal, these products are added to the input signal in opposite phase, so as to largely cancel those produced in the tube. Distortion reduction is greatest at low frequencies because feedback is greatest in that region. However, this does not mean greater distortion at high frequencies for two reasons:
(1) There is still some distortion-reducing feedback at all frequencies due to the 470-ohm resistor.
(2) Typical audio sources contain the least audio energy at the highest frequencies. Since distortion declines with decreasing signal amplitude, there is less need for measures against distortion in the treble range.
Let us now consider some typical R-C treble-boost circuits.
Fig. 720 shows a losser circuit. R2 is the constant-current resistor; its value is greater than the reactance of the record head at all audio frequencies so that assuming for the moment R1 is out of the circuit, R2 essentially determines the amount of audio current through the record head. R1 is much larger than R2.
Consequently, at low frequencies current through the head is considerably reduced owing to the current-limiting action of R1.
As frequency increases, C bypasses R1, resulting in greater audio current through R2 and the head. Audio current begins to rise at the turnover frequency determined by R1 and C. Its rise approaches a halt at the turnover frequency determined by C and R1R2 R1 ± R2 The response curve produced by this circuit results in almost a 6-db-per-octave treble boost. A more sharply rising characteristic is necessary if the response is to extend satisfactorily beyond 10,-000 hz. There are several possible answers to this situation:
(1) The recordist may be trying to achieve satisfactory response only to about 8,000 hz. (2) The recorder may be using a sub normal amount of bias current. This reduces the treble-boost requirement but at the same time results in greater distortion.
(3) The recorder may have additional treble boost at other stages. For example, at one or more tubes there may be treble boost due to use of a small capacitor across a cathode resistor (Fig. 710).
At this point, a flag of caution should be waved with respect to turnover frequencies when R-C feedback circuits are used.
R-C feedback circuits do not necessarily give the precise turnover characteristics that R-C losser circuits do. A simple R-C losser circuit requires about two octaves for response to depart 3 db from a flat course, and it takes another two octaves before response changes at the rate of 6 db per octave. In the case of R-C feed back circuitry, however, unless proper conditions are established, the shift from the region of maximum response to a falling characteristic may be either sharper or more gradual, depending upon the feedback circuit.
Record bass boost
In professional tape recorders, a few db of record bass boost are often introduced at the very low end to satisfy NARTB requirements. Moderate-price tape recorders may also provide a small amount of record bass boost for the same reason or they may contain a relatively large amount because the total bass-boost requirement is evenly split between record and playback.
Where only a small amount of record bass boost is required, the circuit is almost invariably of the losser type. Where large amounts are used, either a losser or feedback type is used.
Fig. 704 has shown the fundamental bass-boost losser circuit; the manner of its behavior has already been described. For the curve to follow a 6-db-per-octave slope to a given frequency, say 50 hz, the bass boost must continue to a much lower frequency, otherwise the curve will begin to level off in the region of 50 hz. The further that bass boost continues, the greater the loss of gain involved; after all, bass boost is obtained in a roundabout way, by attenuating all the other frequencies. But if some lack of precision in the bass-equalization characteristic is acceptable, then bass boost need not be carried to an inordinately low frequency, and gain, perhaps as much as 10 db of it, can be saved.
Gain requires amplifier stages and costs money.
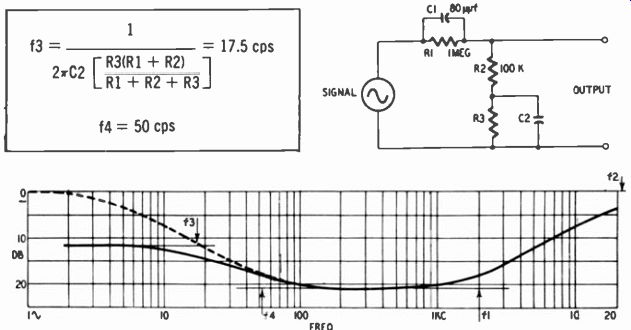
Fig. 722. Modification of response curve in Fig. 721 to produce less
bass boost below 20 hz. The dashed line is the response in Fig. 721.
R1, R2, C1 as in Figs. 705 and 721 R3 chosen on approximate basis to equal reactance of C2 in Fig. 721 at 20 hz.
On the other hand, it is often possible to eat one's cake and have it too when it comes to bass record equalization. Record treble equalization involves a large sacrifice of gain, and some of this gain can be recouped as bass boost if the treble and bass-boost circuits are combined. In such a case, full bass boost can be preserved without any sacrifice in precision. Fig. 721 is a typical illustration of such a combined circuit. Except for the addition of C2, this figure is the same as Fig. 705 and operates in the manner already described so far as treble boost is concerned.
C2, R1 and R2 supply bass boost in accordance with the explanation of the circuit of Fig. 704.
Fig. 723. Addition of bass boost to treble-boost circuit in Fig. 714. A cathode follower is required because of the low impedance (about 5,000 ohms) of the equalizer network at mid-frequencies.
However, it will he noticed that bass and treble boost in Fig. 721 are of the same amount whereas, at least to the maximum and minimum frequencies of interest, say 15,000 and 50 hz, less bass than treble boost is desired when recording. Thus bass boost in Fig. 721 extends to the extreme low end, perhaps to 5 hz. In other. words, the reactance of C2 does not become as large as R1 until 5 hz, at which point bass boost approaches a halt. But it is undesirable to have bass boost extend this far down because it serves only to emphasize rumble frequencies due to the tubes or input signal. To keep gain from increasing below, say, 20 hz, it is necessary to prevent the reactance of C2 from causing further appreciable increase in the impedance of the out put leg of the voltage divider. To do so, resistor R3 is connected across C2, as shown in Fig. 722. The illustration shows how R3 is calculated and its effect upon the bass turnover frequencies.
Fig. 723 shows another combination bass- and treble-boost circuit. In this case the bass-boost configuration of Fig. 722 is combined with the R-L-C treble-boost circuit originally shown in Fig. 714. Similarly, the bass-boost circuit can be combined with still other treble-boost networks.
Playback equalization
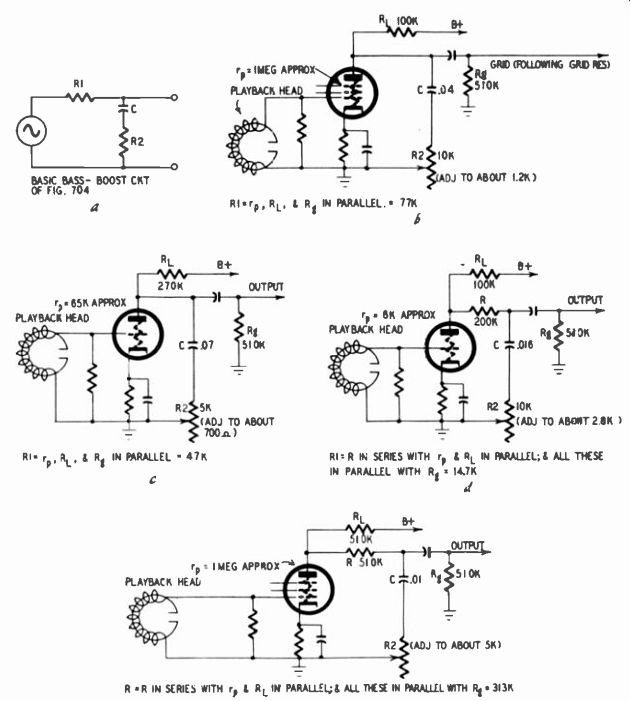
Fig. 724. Practical variations of the bass-boost circuit in Fig. 701.
Whereas a large amount of treble boost and little or no bass boost are generally required in record, the opposite is true in playback where a large amount of bass boost and little or no treble boost are needed. To a substantial extent, the same basic circuit configurations are used for playback as well as record; only the values of the components differ. On the other hand, some equalization arrangements are more or less unique to the playback mode.
Playback bass boost
The playback head, being an inductive device, has an output voltage proportional to the rate at which the magnetic field on the tape is changing; i.e., proportional to frequency. Thus, head output decreases 6 db per octave as frequency declines, and bass boost in very substantial quantity-36 db of it for NARTB equalization-must be introduced as a compensating measure. In this discussion, it will be assumed that NARTB equalization is used, which means that bass boost commences (3-db rise) at 3,180 hz and approaches an upper shelf (3 db below maximum gain) at 50 hz.
Since the declining output of the playback head essentially follows a 6-db-per-octave characteristic, the bass-boost curve must do likewise. R-C circuits, which possess such a characteristic, are therefore used for playback bass-boost circuits, whether of the losser or feedback type. In feedback circuits, only the voltage feedback type is employed. Use of current feedback, namely that produced by a large cathode resistor, would necessitate bypassing the resistor with an inductor to achieve bass boost, a practice that is objectionable because of the disadvantages of inductors in such use (hum pickup, cost, fragility, lack of precise equalization).
Fig. 724-a repeats the fundamental bass-boost losser circuit of Fig. 704, while parts b through e present several versions of a.
Each variation has its points of interest.
In Fig. 724-b, R1 consists of the 100,000-ohm load resistor (RI) in parallel with the much larger plate resistance of the tube (re), about 1 megohm, and with the following 510,000-ohm grid resistor (R). For easier visualization, Fig. 724-b is redrawn as an equivalent circuit in Fig. 725-a. The 77,000-ohm parallel resistance R1 (re, RL and Re in parallel) and 0.04-0 capacitance determine approximately the lower turnover frequency, 50 hz. R2, adjusted to about 1,200 ohms, and C determine the upper turnover frequency of 3,180 hz. Fig. 724-c is essentially the same, except that here a triode is used. R1 is 47,000 ohms and is largely determined by the plate resistance of the tube, which in this case is assumed to be 65,000 ohms, considerably smaller than the 270,-000-ohm plate load and grid resistors. R1 and C produce the lower turnover of 50 hz. R2, which is variable, may be adjusted so that in conjunction with C it produces the upper turnover frequency of NARTB equalization, namely 3,180 hz.
Ordinarily, triodes are considered preferable to pentodes as input tubes because as a rule they produce less hum and noise (although this rule has its exceptions). On the grounds of hum and noise, therefore, the circuit of Fig. 724-c might be preferred to that of Fig. 724-b. On the other hand, a pentode has an important advantage over a triode in that its input capacitance is much lower, thus preventing loss of high frequencies. Thus, it might seem that with respect to frequency response the equalization circuit of the triode circuit is at a disadvantage.
However, this is not true in Fig. 724-c. Input capacitance consists mostly of that between plate and grid and in effect varies directly with gain due to Miller effect. (For example, when the grid goes positive, the plate goes negative; the more tube gain, the greater the negative voltage on the plate. The signal source sends a charging current into the grid-plate capacitance whose ability to absorb current from the input signal varies with the potential across this capacitance; hence the greater the gain, the more signal current is absorbed by plate-grid capacitance and the greater are the signal losses; this effect is equivalent to that produced by a larger capacitance between plate and grid than the actual physical capacitance.) In Fig. 724-c the equalizer capacitor C is a virtual short circuit at high frequencies and the load consists mainly of R2, a relatively small value. Since the load, principally R2, is in series with the plate resistance, by voltage-divider action there is very little output voltage across R2. In brief, gain of the tube is greatly reduced at high frequencies. Along with this reduction in gain there is a reduction in Miller effect. In other words, the input capacitance becomes very small and high-frequency response is not menaced.
Still, there is a slight disadvantage to the circuit of Fig. 724-c.
To the extent that plate resistance departs from the nominal value of 65,000 ohms due to voltage changes, age or the individual tube used, the turnover frequency at the low end (in the region of 50 hz) is affected. Thus, bass equalization will not be absolutely precise. However, this variation is usually of an order small enough to be acceptable for practical operation.
In Fig. 724-d the plate resistance of the medium-mu type of triode used is too low to serve as R1. Therefore, a 200,000-ohm resistor is used as the principal part of R1. R1 figures out to 147,-000 ohms and in conjunction with the 0.018-uf capacitor produces the desired turnover frequency of approximately 50 hz. Potentiometer R2 is adjusted to about 2,800 ohms to produce a 3,180 cycle turnover frequency in conjunction with C.
Fig. 724-e is a similar configuration, except that a pentode is used. Although the load resistance in parallel with the plate resistance of the tube and with the following grid resistor is sufficiently high to serve as R1, the designer has sought to reduce the effect of changes in plate resistance upon equalization by inserting R. Consequently, R1 is determined to a substantial extent by the 510,000-ohm resistor R. The plate and load resistances are in parallel with each other (combined value about 330,000 ohms) and in series with R. All these are in parallel with the 510,000-ohm grid resistor, making a total resistance R1 of 313,000 ohms. R1 and the 0.01-pf capacitor produce a turnover frequency close to 50 hz. R2 is adjusted to about 5,000 ohms to produce the upper turnover frequency of 3,180 hz. (The equivalent circuit appears in Fig. 725-b.)

Fig. 725. Equivalent circuits for Fig. 724.
Feedback bass equalizers of the voltage type have two worth while advantages over losser circuits: (1) reduction in distortion, particularly at the high frequencies, where signal output from the head is greatest; (2) reduction in the effective plate resistance of the tube and therefore in its output impedance; this facilitates maintenance of high-frequency response inasmuch as shunt capacitance (stray capacitance and capacitance of the following stage) produces less treble loss across a small resistance than a large one.
Why does negative voltage feedback reduce internal resistance of the tube? Assume, for example, that a decrease in the value of the load impedance, say due to stray capacitance, reduces the tube's output voltage. As a result, the feedback voltage also de creases, bringing the output voltage close to its original value.
The same effect would be produced if the internal resistance of the tube were very small compared with the impedance of the load. So far as output signal is concerned, the internal resistance and external load are in series, forming a voltage divider, with the output voltage present across the load. Relatively large changes in the load can occur without affecting voltages across it, provided that the tube's internal resistance is low enough. With negative voltage feedback, the tube behaves as though it had a lower plate resistance.
A typical feedback bass equalizer with good characteristics is shown in Fig. 726. R2 is relatively small and at high frequencies, where C is a virtual short circuit, a large amount of feedback is applied to the cathode of the first stage. R2, Rk, and C essentially determine the upper turnover frequency (3,180 hz); as frequency decreases, the reactance of C becomes equal to R2 and Rk, feedback starts decreasing and gain starts increasing. R1 and C essentially determine the lower turnover frequency (50 hz); as frequency continues to decrease, the reactance of C becomes equal to R1, C no longer by-passes R1, feedback stops increasing and the gain approaches a maximum. At very low frequencies the value of the coupling capacitor must he properly selected to avoid subsonic peaking due to feedback.
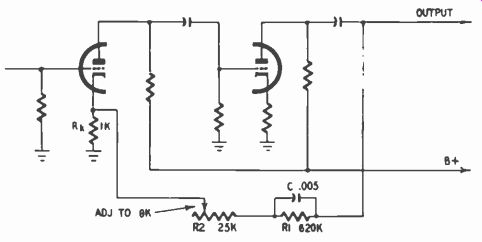
Fig. 726. Bass-boost circuit using voltage feedback over two amplifier stages.
The roles of R1, R2 and C in Fig. 726 correspond to those of the same components in losser bass-boost circuits. However, the response curve may not be as precisely shaped by feedback as by losser networks. That is to say, the shift from flat response to a 6-db-per-octave characteristic may be considerably more gradual in the case of a feedback equalizer. Fig. 727 shows a comparison be tween the bass boost achieved by an R-C losser and an R-C feed back circuit. In both cases the turnover frequencies are nominally 50 and 3,180 hz in accordance with NARTB playback equalization. Feedback may produce a more gradual transition from flat to 6-db-per-octave response at the very low end, so bass boost may suffer somewhat.
The more gradual turnover in a feedback equalizer is not a necessary condition, although one that is likely to occur at least to a moderate extent. To offset this lack of precision, the lower turn over frequency can he reduced to provide sufficient bass equalization within the frequency range of interest.
Feedback equalizers do not always display as sharp a turnover as losser circuits because variation in gain does not vary purely with feedback. Instead, signal attenuation due to feedback is described by the expression 1 + A$, where A is gain without feedback and # the fraction of the output voltage that is fed back.
In Fig. 726 the maximum fraction of voltage feedback, which occurs at the high end, is determined by the ratio of Rk to Rk R2, C being a virtual short circuit at high frequencies. The mini mum percentage of voltage feedback which occurs at the low end, is determined by the ratio of Rk to Rk R1 + R2, C being a virtual open circuit at very low frequencies.
Although it is the intention of this guide to minimize mathematical presentations, the importance of feedback and the simplicity of the arithmetic involved make it desirable to show why it is that attenuation due to feedback varies with the quantity of 1 + Aft. Let e be the input voltage to the amplifier, e the output voltage, A the amplifier gain without feedback and # the fraction of eo fed back to the input. The output voltage equals amplifier gain times the voltage between grid and cathode. This is the input voltage minus the fraction of output voltage fed back. Gain in an amplifier is output voltage divided by input voltage or e /e.
e. = A (e- /k.) (1)
e. = Ae- Ai3e. (2)
AtIe. = Ae (3)
e.(1 A13) Ae (4)
Rearranging the terms of equation 4, we find the expression for the gain of a feedback amplifier:
A e 1 +
Now let us assume that the value of A is substantially greater than 1, so that 1 becomes an insignificant part of the denominator of equation 5 and can therefore be omitted. Thus:
A A 1 (6) 1 + As A/3 (A# is much larger than 1.)
The gain of a feedback amplifier is inversely proportional to the feedback fraction (ft) so long as Aft remains appreciably greater than 1. For practical purposes, values of Aft in excess of 4 are sufficient. (Addition of 1 to 4 makes 5, which is a difference of only 2 db.) Where a large amount of bass boost is required and $ becomes very small at the low frequencies, then the gain (A) must be high to maintain Aft above 4.
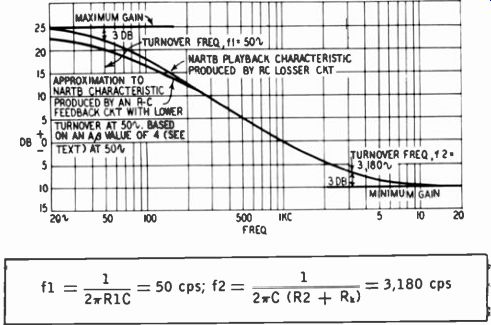
Fig. 727. Comparison of bass-boost curves produced R-C hisser and feedback
circuits.
Assuming NARTB playback equalization, there must be a total of 36-db bass boost; 30 db of this occurs between 50 and 3,180 hz, with low-frequency output tapering off to a level 3 db higher than at 50 hz and with high frequency output tapering off to a level 3 db lower than at 3,180 hz. And 36 db of equalization is equal to a 63-to-1 voltage ratio. If the term Af3 must be at least 4 at the low end of the frequency range, then at the high end it must be at least 63 times as great, or 252. There fore, if ft could be varied from 1 at the high end down to 0.016 (or 1/63) at the low end, an amplifier having a gain of 252 would suffice. At the low-frequency end, the term Aft would equal 4, namely the product of 252 times 0.016. However, it is not practical to have $ as large as 1, chiefly because this would load the output heavily, producing distortion and excessively reducing gain at high frequencies. As can be seen in Fig. 726, if 13 were to become 1, this would mean that the feedback resistor R2 would have to diminish to zero, leaving the cathode as the only significant portion of the load resistance (the reactance of C would be negligible at high frequencies).
For practical circuitry, therefore, $ may not exceed about 0.1 without excessively loading the output of the amplifier. Consequently, the amplifier must have a gain of about 2,500 in order that the feedback fraction may vary from 0.1 to 0.0016 (a range of 63 to 1), without the term Ap becoming smaller than 4. This will maintain satisfactory precision of the equalization characteristic and at the same time avoid undue loading of the amplifier output. Two stages of a high-mu triode, such as the 12AX7, can provide the needed gain.
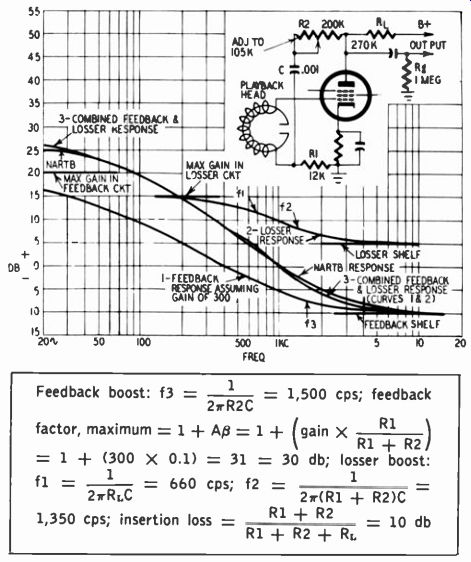
Fig. 728. Approximation of NARTB bass boost produced by plate-to-grid
feedback combined with a losser circuit.
Using feedback, equalization satisfactorily approximating the NARTB characteristic can be achieved with a single pentode, even though the maximum gain from a pentode is only about 300 in practical circuitry rather than the 2,500 previously indicated as desirable. What is done is to combine a losser circuit with the feedback network so that the corresponding curves add up to a characteristic approaching NARTB equalization.
Fig. 728 illustrates such a circuit. R1, R2 and C constitute the feedback network, with R1 and R2 forming a voltage divider.
As frequency declines, the reactance of C becomes equal to R2 and the feedback voltage across R1 begins to decrease, with a resulting increase in gain at the low-frequency end. The feed back curve shown in Fig. 728 has a turnover frequency of 1,500 hz. The losser circuit comprises R1 + R2 in series, RL and C.
It operates in the same manner as Fig. 724-b, with RL playing the same role and R1 + R2 playing the role of R2; the resulting curve has turnover points at 660 and 1,350 hz. Addition of the feedback and losser curves produces a characteristic close enough to the NARTB one for practical purposes.
----------------
f2 (upper turnover frequency) = 1 2TR2C
= 400 hz; bass boost tapers off at low end as Aft (gain of V2 times fraction of output voltage fed back) becomes much smaller than 1; feedback factor, maximum
= 1 + Ap = ± (gain X R1 R1 + R2/
= 1 + (30 x 0.1) = 4 = 12 db
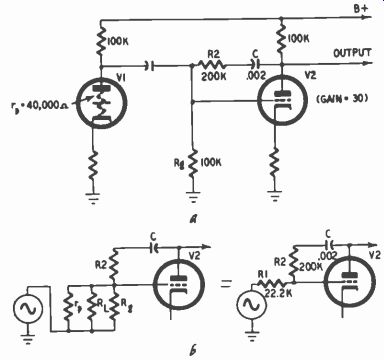
Fig. 729. Interstage plate-to-grid feedback circuit producing bass boost.
-----------------
Fig. 729 is an example of plate-to-grid feedback introduced after the input tube. This circuit produces bass boost with an upper turnover frequency of about 400 hz, being used in a recorder with half-and-half equalization. The gain of V2 produces a voltage at its plate 30 times that at the grid, but in opposite phase. Therefore C and R2, from the viewpoint of the grid circuit, have 31 times the grid voltage across them. This enables them to accept 31 times as much signal current. Thus the actual values of 200,000 ohms and .002 pf are equivalent to 6,500 ohms (200,000/31), and .062 pf (31 x .002); these equivalent values are in shunt with the plate of V1 and serve to load this tube in the sane fashion as in Fig. 725-c.
A number of the playback bass boost circuits illustrated (Figs. 724;728) incorporate means for adjusting the response curve. This flexibility makes fairly precise equalization possible, at the same time allowing for the effects of other factors upon high frequencies. For example, if in playback there are some treble losses due to cable capacitance, then the upper turnover frequency f2 can be reduced somewhat. This means that the equalization curve does not drop as much at the high end. Thus, where NARTB equalization is required, a turnover of, say, 2,000 hz instead of 3,180 might approximately balance out high-frequency losses elsewhere in the playback amplifier.
Playback treble boost
To correct for playback losses (due to gap width, hysteresis, eddy currents), to compensate cable losses or to complete a particular equalization characteristic employed, tape recorders frequently provide high-frequency boost in the playback amplifier.
The shape of the required treble-boost curve will depend upon the factors which are primarily responsible for playback losses.
If gap width is the predominant factor, then losses take place at a rapidly accelerating rate. Therefore a circuit with a sharply rising characteristic is needed. This may be obtained by an R-L-C circuit. Such a circuit can add half an octave or so to the high-end response of the tape recorder, usually a very worth-while addition.
One way of achieving this effect is to place a suitable capacitor across the playback head as shown in Fig. 730. The capacitor and the inductance of the head form a tuned circuit which can be made to resonate at the desired frequency by proper choice of the capacitor value. Voltage across the capacitor reaches a maxi mum approximately at resonance, and output voltage can there fore be appreciably increased, depending upon the Q of the tuned circuit. Although capacitance across the playback head in the form of cable, interwinding or input-tube capacitance is usually viewed as a threat to high-frequency response because of its shunting effect, yet properly controlled capacitance can produce just the opposite result. If the head and the various capacitances resonate within the audio range, then there are audio losses above resonance. But, if resonance occurs slightly beyond the audio range, then resonance can serve to improve the response at the upper end of the spectrum. If the peaking effect due to the tuned circuit is too great, it may be necessary to place a resistor across the head to reduce the Q of the circuit and thereby the rise in response. If the recorder uses a head with a very narrow gap and operates at high speed, say 15 ips (so that gap losses do not enter into the picture) and if there are no treble losses due to other factors, then rising output due to head resonance might be un desirable. In such a case it would be necessary to make sure that head resonance occurs well above 20,000 hz or use a resistor to reduce the Q of the resonant circuit.
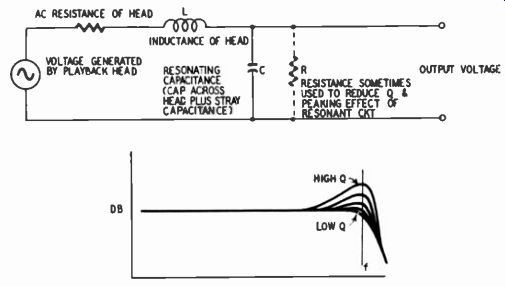
Fig. 730. Playback treble boost produced by resonating the play back
head.
The treble-boost techniques found in the record section are also often used for playback. For example, the treble boost may be associated with the bass-boost circuit (Fig. 722) where C1 bypasses R1. Of course, for playback purposes, the values are different from this figure since playback calls for a large amount of bass boost and a small amount of treble boost.
Quite frequently, treble boost is achieved by current feedback as in Fig. 710, where the cathode is shunted by a capacitor, or as in Fig. 711, where the cathode is shunted by an inductor and capacitor in series, producing a much more sharply rising curve.
The amount of current feedback, and thus the amount of treble boost which can be achieved by a capacitor or capacitor-inductor bypass, does not vary purely with the size of the cathode resistor.
Instead it varies with the expression 1 Rkg., where RA is the cathode resistor; gm the transconductance of the tube in mhos.
As long as the term Rkgm is large compared with 1, say four times as large or greater, feedback will vary essentially in direct proportion to the value of the cathode resistor.
Assuming that Rkgm is suitably large to begin with, feedback begins to decrease and gain to rise appreciably when the reactance of the bypass element, say a capacitor, becomes equal to the cathode resistor. Above this frequency, the capacitor's reactance, being smaller than Rk, principally determines the ac voltage be tween cathode and ground, hence the amount of feedback.