THE frequency response of many amplifiers, provided basic design is good, can often be considerably improved.
Sine wave testing Distortion, frequency response, overloading, etc., in the audio system can be checked with the following aids: (1) sine waves, (2) square waves, and (3) sweep-frequency records. The first method (illustrated in the setup in Fig. 1101) consists simply of a variable audio oscillator and a scope. The oscillator feeds a signal into the amplifier, and the scope (across the amplifier output) indicates what has happened to the audio sine wave as it passed through the amplifier. The low-range a.c. or output meter connected across the audio oscillator output should read the same value of signal input for all applied frequencies.
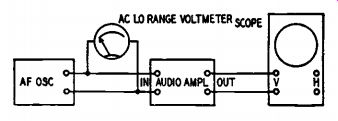
Fig. 1101. Setup for checking phase shift.

Fig. 1102. Single and double sine wave forms are shown in a and b.

Fig. 1103. Waveform a is distorted sine wave output. Waveform b is a
60-cycle since wave modulated with 400 cycles.
Let us examine some of the waveforms which can be obtained with sine wave testing. We are familiar, it is assumed, with the sine wave forms shown in Figs. 1102-a and 1102-b. Suppose that a sine wave similar to that in Fig. 1103-a is present at the output, even though no signal is being fed into the amplifier input. A logical assumption is that a.c. hum is being picked up at some point in the amplifier. Deter mine the frequency of the waveform by adjusting the scope frequency control until a single stationary cycle as in Fig.1102-a is obtained; then read the frequency setting on the scope sweep control. If the frequency is 60 cycles, look for cathode-to-heater leakage in one of the tubes, or stray pickup from the filament leads, power transformer, or some external source. If the hum frequency is 120 cycles, an open or low-valued filter capacitor is indicated.

Fig. 1104. Typical distorted waveforms. Note waveform a is clipped at
top while waveform b is clipped top and bottom.
Sometimes a wide, blurred waveform may appear at the output instead of the usual thin, well-defined line. Such indication is caused by oscillation within the amplifier. Low-frequency feedback resulting in oscillation may be due to open plate or screen-grid bypass capacitors or to inadequate decoupling between stages. High-frequency oscillation may be the result of defective plate or cathode bypass capacitors, or due to regeneration in one or more stages. An open plate bypass capacitor in the output stage, and output leads which are too close to the amplifier input circuit can be notorious offenders in this respect.
This condition is often caused by improperly shielded grid circuits in high-gain amplifiers, or by plate and grid leads placed too close to each other. Shielding all grid and low-level leads, and properly dressing grid and plate leads almost invariably corrects this latter condition.
Be careful to check response after applying these remedies. It may cause appreciable loss of high frequencies.
The waveform in Fig. 1103-b is the result of modulating a 60-cycle sine wave with 400 cycles. Typical distorted waveforms are shown in Figs. 1104 and 1105. Note that the relatively small amount of distortion in Fig. 1104-a results in clipping of the positive peaks only, while the high distortion shown in Fig. 1104-b has flattened both positive and negative peaks. Positive peak flattening is usually due to overloading or insufficient bias. Negative peak flattening can be caused by a shorted cathode bypass capacitor. The waveform in Fig. 1105-a (note the distorted negative peaks) is a typical example of distortion caused by overloading. Fig. 1105-b indicates presence of regeneration and overload. The terms positive and negative peaks are applicable liter ally only when checking the waveform at the plate of a particular stage.

Fig. 1105. Waveform a is example of overload distortion while waveform
b indicates regeneration and overload.
The usual stage-by-stage checks should be employed to determine the source of distortion. First, be sure that the distortion is due to a defect within the amplifier and not from excessive input from the signal generator. Connect the scope's vertical leads successively across the plate and grid circuits of each stage, beginning with the output stage and working back toward the input until the distorting stage is located. If distortion as indicated by these scope checks suddenly disappears you can be certain that its source has just been passed. Don't forget to check compressor, expander, and phase inverter circuits. In most cases you will find that the distortion is caused by defective tubes, leaky, open or shorted capacitors, improper grid bias, incorrect plate voltage, resistors that have changed in value, power supply hum, etc.
It is important that we positively identify the half-cycle being viewed on the scope. The first step is to check the polarity or phasing of the scope. Connect the negative side of a battery (1.5-4.5 volts) to the ground terminal of the vertical amplifier. Turn up the vertical gain, then touch the positive side of the battery to the hot vertical input terminal. If the trace moves up, the upper half of an alternating input signal will be positive and the lower half will be negative.
If this alternating signal is amplified by a single stage before being fed into the scope, phase will be reversed and the positive half-cycle on the grid of the amplifier will be shown as the lower half of the trace on the scope. Thus, the polarity of the observed signal corresponds to that of the scope only when there are an even number of stages between the signal source and the scope.
When the signal to the scope is taken from the secondary of a transformer; e.g., the voice-coil winding, check the phasing of the winding.
Apply a positive signal of known polarity to the grid of the stage feeding the transformer and note the deflection on the screen.
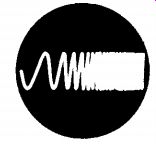
Fig. 1106. Typical response pattern produced by a sweep-frequency record.
Use of these records eliminates necessity for audio sweep frequency generator.
Sweep-frequency records include marker "pips" at various frequencies
for identification of response limits.
Keep the input to the scope low, otherwise the vertical amplifier may overload and distort the trace. When feeding high voltages into the scope, distortion in the vertical amplifier may be avoided by feeding the signal directly to the deflection plates. Before doing this, check the polarity of the plates by using a d.c. source of 20 to 45 volts.
Frequency response
There are several methods of measuring frequency response characteristics. One of the simplest is to use a variable audio oscillator with a db meter (instead of the scope) connected across the output of the audio amplifier. As the audio oscillator is varied slowly from about 30 to 20,000 cycles (with its output kept constant as indicated on the low range a.c. voltmeter), the amplifier response can be read directly as + or - db on the output meter. If no db meter is available, the scope can be used as a response indicator. Simply turn off the horizontal amplifier, so that only a thin vertical line appears on the screen.
(This line represents the amplifier output). Adjust the height of the line to cover any desired part of the screen at a certain reference frequency (usually 1,000 cycles). Then vary the audio oscillator as above and note whether the vertical line decreases or increases in length. A 50% change indicates a corresponding voltage drop or gain of 6 db.
A drop of this amount would indicate the practical limit of response at that particular end of the band. (First check the linearity of the scope's response over the frequencies to be measured by connecting it directly to the a.f. oscillator output.)
Hum originating in the power supply can be traced with a 600-volt, 1-uf capacitor in series with the scope lead to the vertical circuit and probed to points in the power supply. The amplitude of the 60- or 120-cycle sine wave at these points will indicate the effectiveness and condition of each filter component.
Sweep-frequency testing Sweep-frequency records (or transcriptions) are available for use without a signal generator. See the typical response pattern in Fig. 1106. Such records include marker "pips" at various frequencies for identification of response limits. An audio sweep-frequency generator may, of course, be used (if the pocket-book can stand the strain); but, in any case, an audio sweep unit is substituted for the oscillator in the test setup.

Fig. 1107. Waveforms in a, b, and c give an indication of the frequency
response of an amplifier. Such waveforms give a clue as to components
to be changed.
When the sweep-frequency record is used, you will need a tone arm employing a good magnetic or reluctance pickup, and a small amplifier (preferably a twin-triode such as the 12AU7, 6SN7-GT, etc., connected as a two-stage cascade amplifier). Flat response over at least the audio range is necessary for accurate results.
Analysis of the frequency response, distortion, harmonic content, etc., becomes extremely simple with this method. Note the response pattern shown in Fig. 1107-a. This denotes a practically flat response from about 50 to 10,000 cycles (fair for a high-fidelity system). In 1107-b the frequencies from about 200 to 4,000 cycles are markedly emphasized (about 6 db, or twice the height on the screen of the aver age waveform height), while the response is down at the low-and high frequency limits. This would indicate that the cathode or coupling capacitors have decreased in value, or that the plate bypass capacitor is too large. It would be wise to check the value of the grid resistors and decrease if necessary. If the amplifier response is generally poor, it can be improved (with a sacrifice in gain) by using negative feed back. Fig. 1107-c indicates a definitely poor response above about 4,000 cycles. If no definite defects are found in the interstage coupling units, try decreasing the value of the plate bypass capacitor (and cathode bypass capacitors). Lowering the value of the coupling capacitor probably would help, but at the risk of impairing the low-frequency response.
Sweep-frequency testing has many advantages when used for audio design or replacement work. The effect of volume controls, tone control and feedback circuits, filters, etc., on frequency response, phase, harmonic distortion, and other factors can be readily observed on the scope screen.
Phase-shift technique
The frequency response can also be determined by measuring the phase shift which a signal undergoes in passing through the amplifier.
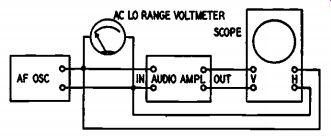
Fig. 1108. Setup for checking phase shift
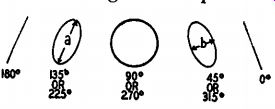
Fig. 1109. The patterns show phase shift.
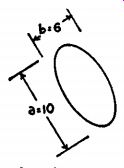
Fig. 1110. b/a is tangent of angle.
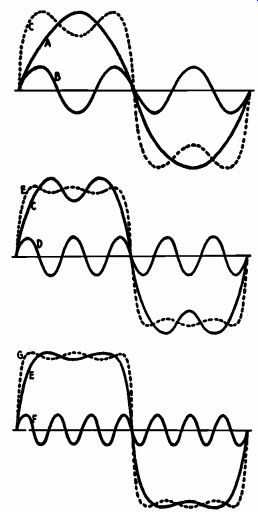
Fig. 1111. How harmonics add to form a square wave.
The testing arrangement is illustrated in Fig. 1108. This method is sensitive because even minute changes in amplitude are accompanied by large shifts in phase. The test procedure is the same as that for the amplitude-vs-frequency method except that the input and output signals are compared as to phase by applying them to the vertical and horizontal plates of a cathode-ray oscilloscope. Depending upon the degree of phase shift, the resulting pattern, called a Lissajous figure, will be a straight line, a circle, or an ellipse, as shown in Fig. 1109. The phase shift may be estimated from the shape of the figure, but is best calculated from the formula, θ = 2 tan-1 (b/a), where θ is the phase-shift angle in degrees, b is the length of the shorter axis, and a is the length of the longer axis. See Fig. 1109 for an illustration of axes a and b.
As an example, in Fig. 1110, the short axis b is 6 units long and the long axis a is 10 units long. Therefore, b/a = 6/10 = 0.6. Looking in a table of tangents to find the angle whose tangent is 0.6000, we find that the closest one is 0.6009, which is the tangent of 31 degrees or 149 degrees. Multiplying these angles by 2 as the formula states, the phase shift is 31 X 2 =62 degrees or 149 X 2 = 298 degrees. To deter mine which of the two is the correct phase angle, note that the Lissajous figure in Fig. 1110 is tipped over to the left. Hence, the phase shift is approximately 62°. Had it been tipped over to the right, the phase angle would be about 298°.
The calculation is made for every frequency fed into the amplifier, from 500 to 15,000 cycles. However, in drawing up the response curve, phase shift, instead of amplitude, is plotted against frequency. If the curve is not sufficiently flat, the faulty stage or stages must be located by point-to-point testing, substitutions made, and the entire procedure repeated as before.
Square-wave testing
The main advantage of square-wave testing is that phase, distortion, and frequency response characteristics of an audio amplifier can be observed at the same time.
A square wave is square because it consists of a fundamental and all its harmonics in definite phase and amplitude relation to each other. Strangely enough, square-wave analysis is so simple because square waves are so complex. Theoretically, a square wave is the algebraic sum of a fundamental frequency and an infinite number of its harmonics, all sinusoidal in shape and all having a common time of origin. In practice, however, the 30th harmonic is the highest order of sufficient amplitude to be of consequence. Fig. 1111 suggests how the fundamental and its harmonics combine to produce a square wave by flattening the top and steepening the sides of the original sinusoidal waveform.
Any circuit which changes the phase relation or the amplitude of any of the components will distort the square wave. Only when the circuit passes all the frequencies of the square wave without attenuation or relative phase shift can the output be undistorted. This is the principle of square wave analysis.
Square-wave analysis is simplicity itself. The only equipment required is a square-wave generator and an oscilloscope, having a frequency response that will pass the fundamental and all the desired harmonics of the square wave without attenuation or relative phase shift. The square-wave generator is connected to the input of the circuit under test, and the oscilloscope to the output.
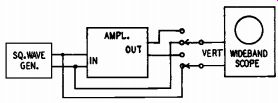
Fig. 1112. Square wave amplifier check.

Fig. 1113 a, b, c. Ideal square wave shown in waveform a. Waveform b
reveals drop in low-frequency response; waveform c shows poor low and
high response.

Fig. 1113 d, e, f, g. Distorted waveforms shown in d, e, f, and g, produced
during square wave test of amplifier.
Set the fundamental frequency of the square-wave generator at 500 cycles with your equipment as shown in Fig. 1112. The input signal to the amplifier is viewed on the wideband oscilloscope to make sure that it is square. The scope is then switched to the output of the amplifier and the waveform viewed to see if it is square. If it is, the frequency response is satisfactory from 500 to 15,000 cycles. If the output waveform is distorted, the amplifier needs adjustment. The scope is then switched to the output of the next to the last stage, then the stage before that, and so on, until the wave-shape becomes square.
This localizes the difficulty in the following stage. Adjustments are made in the amplifier until the waveform assumes a square shape. The amplifier is then passing all frequencies between 500 and 15,000 cycles.
There are no multiple-frequency checks, no calculations, and no curves to be drawn!
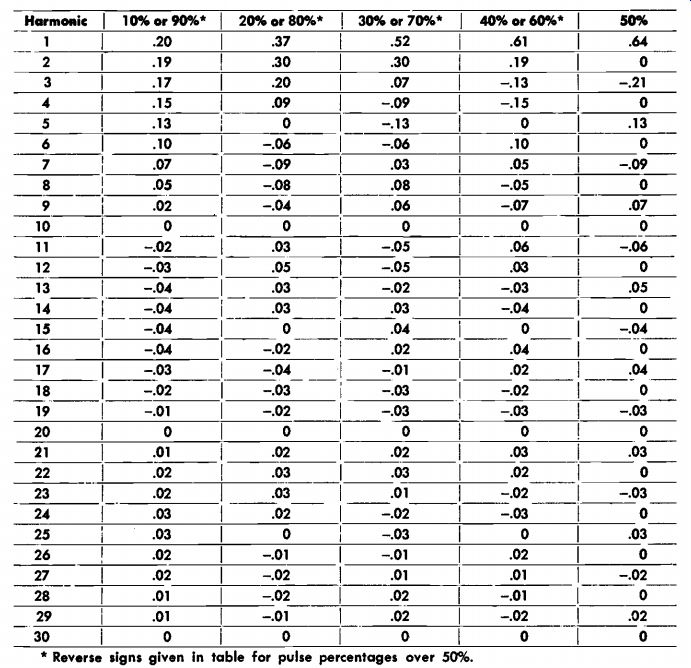
---------- Square-Wave Component Table Percentage Width ------ *Reverse
signs given in table for pulse percentages over 50%.
If no square-wave generator is available, the regular audio oscillator may be used by adding a simple twin-diode (such as the 6H6) in its out put circuit and biasing it to operate as a limiter. Experiment with the bias by feeding a sine wave through the limiter and adjusting the bias until a pattern similar to Fig. 1113-a is seen on the scope.
The square wave shown in Fig. 1113-a is an unattainable ideal. The wave form of Fig. 1113-b indicates a certain amount of distortion, accompanied by a drop in low-frequency response. Fig. 1113-c shows comparatively poor response at both the low and high frequencies. In 1113-d there is considerable distortion and very poor low-frequency response. The sloping sides also indicate excessive phase shift. The drop in low-frequency response points to an open or defective cathode or screen-grid bypass capacitor. The dampened oscillations in 1113-e are usually due to a resonant condition at some particular frequency check the values of the coupling, cathode, and plate isolating capacitors.
Resistance loading of the interstage transformers is a sure cure in some amplifiers. The high-frequency leak or "pip" in 1113-f could be caused by improper shielding or inadequate isolation of the stages. The almost triangular pattern in Fig. 1113-g represents very bad low-frequency response and excessive phase shift.
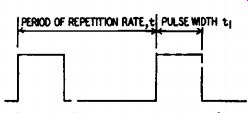
Fig. 1114. Square wave time definitions.
Not all square waves are alike. They may differ in period or repetition rate, frequency, amplitude, and percentage width. The period or repetition rate is the reciprocal of the frequency of the fundamental and is defined as the time between the beginning of any two successive pulses. The time duration of the pulse t 1 is called the pulse width.
These characteristics of the square wave are illustrated in Fig. 1114.
The ratio of the pulse width t 1 to the period t, when multiplied by 100, is known as the percentage width: t1/ t x 100 = percentage width.
The percentage width depends upon the harmonic content of the particular square wave. It is possible to prove this by a complex mathematical procedure known as a Fourier expansion. This operation is used to analyze complex wave-shapes and to determine the amplitudes and natures of their components. A tabulation of the amplitudes of the fundamental and all its harmonics up to the 30th of square waves of different percentage widths is given in the table of square-wave components. This table lists percentage widths in steps of 10%, from 10% to 90%. The figures in it were obtained by using a Fourier expansion.