THE audio engineer is concerned with designing equipment to produce imitations of speech and music. If the imitation bears a close resemblance to the original sound it is said to be "high fidelity." This is a purely subjective definition, for what is high fidelity to one person is an irritating noise to another. In any event, the medium of perception is the human ear, and ears, in sensitivity and frequency response, vary within very wide limits.
The "average ear" is as much a myth as an "average person." No person is an average person-he is himself and he has his own particular pair of ears. So curves which give a smooth mean result based on tests of typical cross-sections of listeners represent the average of a number of ears, but any one pair of ears may give results considerably different from these curves.
Characteristics of musical instruments
Before the designer can consider ways of dealing with musical sounds he must understand the nature of those sounds. The numerous books on sound reproduction almost invariably give a dia gram showing the frequency range of musical instruments; most give the range of fundamental frequencies emitted by various instruments; some include what is generally described as the harmonic range. Most of these are only partially correct and virtually useless.
It is well known that the differing timbre of musical sounds and speech is due to the presence of harmonics or partials as well as a fundamental frequency. The harmonics have frequencies which are integer multiples of the fundamental frequency and they can vary in number and amplitude. Basic research in this subject was carried out by Lord Rayleigh (Theory of Sound) and H. van Helmholtz (Sensations of Tone). Reference to these works will give the mathematical and scientific analysis of musical sounds.
Harmonics
A rough guide to the number and amplitude of harmonics in some sound sources is given in Table 1. The relative intensities of harmonics are expressed in figures, but in many cases the figures are guesswork, based on a method of simulating the tone by using a series of tuning forks. With strings, reasonably accurate measurements can be made but it is almost impossible to measure the relative intensities of the harmonics in wind instruments and voices.
The method is to set up a series of tuning forks until, when simultaneously activated, they produce a sound which seems to match the original. Admittedly the modern electronic organ had not been dreamed of in Rayleigh's and Helmholtz' day, but their data seem fairly sure.
Modern techniques could produce complete records. Instruments could have their performance recorded in photographed oscillograms and the oscillograms analyzed by harmonic analyzers.
However, the writer is not aware of any comprehensive publication of work, done on these lines. He has been at some pains to compile all the available information on the nature of the various sources of musical sounds and this data is presented in Fig. 101, which gives a more complete picture of the frequency range of voices and instruments than has hitherto appeared.
[1 i.e. musical quality.
2. Sometimes called "overtones." 3 Lord Rayleigh (John William Strutt, 1842-1919). Theory of Sound, 1st edition, 1877. 1st American edition, 1945, by special arrangement with the Macmillan Co.
• Hermann L. F. von Helmholtz (1821-1894), On the Sensations of Tone as a Physiological Basis for the Theory of Music, 1st German edition, 1862. American edition, 1954, Dover Publications.]
--------------
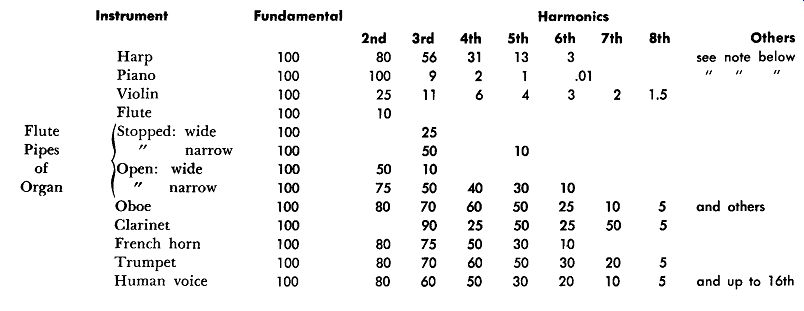
Table 1--Harmonic Range of Various Sound Sources Instrument Fundamental Harmonics
Note: particularly in the case of the piano the harmonic development depends on the fundamental frequency. For example, Can octave below middle Chas 15 harmonics; Can octave above middle Chas only 6, and "top C" only five. Other instruments show similar variations, and the harmonic range of stringed instruments depends -on whether they are bowed, muted or plucked. Wind instruments have a different harmonic development according to whether they are played "straight" or muted.
The numbers given in Table 1 above represent the relative intensities of the harmonics. Thus, the 6th harmonic of the oboe is 25 / 100 or 25% of the amplitude of the fundamental.
---------------
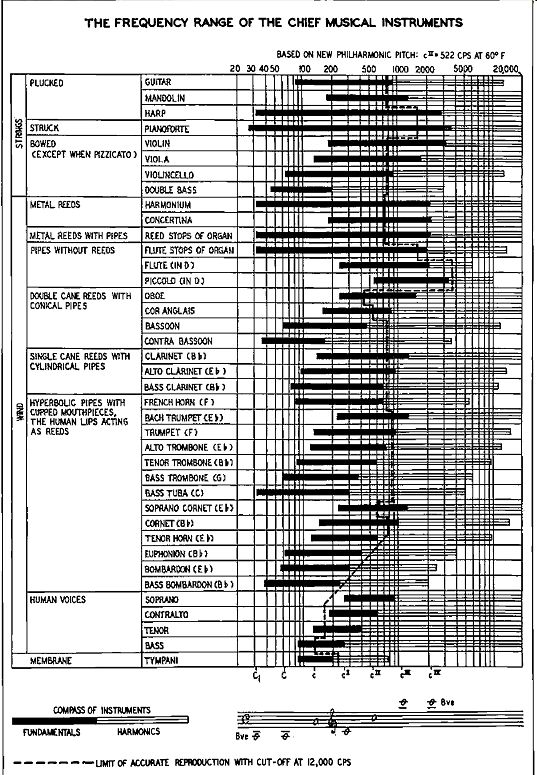
Fig. 101. In the frequency scale of the above chart the solid line opposite
each instrument shows the fundamental range; the harmonic range is depicted
by a triple line. See page 8, and the pages following, for the meaning
of the dotted line representing a cutoff at 12,000 hz.
For guidance in designing equipment, a dashed line has been added to the illustration (Fig.101) to show what part of the compass of the instruments is not reproduced correctly by apparatus having an upper cutoff at 12,000 cycles. This line could not be a vertical one drawn through the 12,000 ordinate on the frequency axis since the horizontal line for each instrument represents all its fundamental frequencies and harmonics. Each complex note needs to have all of its harmonics reproduced correctly. The solid parts of the lines represent the fundamental frequencies, but for the lower fundamental frequencies it will be obvious that the "harmonic range" extends downward over the fundamental range shown. The cutoff line (refer to Fig. 101 illustrated on the facing page) must therefore pass through that part of the line which rep resents the highest frequency at which all the harmonics are re produced.
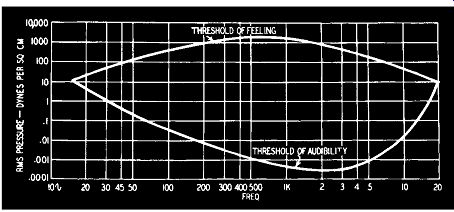
Fig. 102. Auditory sensation area of the human ear.
A little reflection will indicate that not even an overall flat response to 20,000 hz will give near-perfect results in the case of some instruments and all human voices. The situation is further complicated by the fact that a human ear with an upper-limit response of 12,000 hz listening to a live performance in which all the harmonics are present will not hear the same thing as when listening to a reproduced performance having nothing higher than 12,000, due to the fact that the ear is conditioned by what to it are supersonic frequencies. This will be considered further in the next subsection.
Characteristics of the human ear
Sounds too quiet to be heard are neither heard nor felt. As the intensity is increased, the point at which they are just heard is called the threshold of audibility. This will depend on the characteristics of any particular ear, but it will also depend on the frequency. The pressure of the sound on the ear (in dynes per square centimeter) can be plotted against the frequency (in hz), and this is shown in Fig. 102. As the pressure on the ear increases there comes a point when the sensation ceases to be just hearing and becomes both hearing and feeling-in the case of very low frequencies a feeling of throbbing and, when the intensity is high enough, actual pain. This again depends on the ear and the frequency. The point at which feeling rather than hearing becomes dominant is called the threshold of feeling and is also plotted in Fig. 102. The area between the two curves is called the auditory sensation area of the ear. This is, of course, that mythical "average ear" but all ears follow the same general characteristics, except that individual variation at certain frequencies may be as great as 20 db.
Response of the ear It will be noticed that the ear is most sensitive to frequencies between 2,000 and 3,000 hz. It so happens that many loudspeakers have a resonance at about 3,000 hz because of defects in construction, the cheapest speakers usually being the worst offenders.
While such a combination of characteristics provides an easy way of affording "efficiency" for the non-discriminating listener, it is precisely the reverse of what is wanted for fidelity of performance.
To pure tones the ear has been said to be sensitive to increases of power of from l to 3 db. This, however, depends on the frequency of the pure tone. Weber's Law states that in order to pro duce a perceptible increase in the intensity of a sensation an equal fraction must be added to the previous intensity of the stimulus, whatever its value. The magnitude of the sensation (loudness) produced is proportional to the logarithm of the stimulus (intensity). If I = the original intensity and l'-,I = the just perceptible increase in intensity, then l'-,l/I = the differential sensitivity. The sensation level of a sound is expressed in decibels above the thresh old of audibility.
Loudness and intensity
To some readers the above statements may seem obscure, and this may be attributed to the fact that there is a rather widespread confusion as to the exact meanings of loudness and intensity; equally common is the misuse of the term 'decibel'. We frequently read that such and such has a level or magnitude of so many db.
This statement is absolutely meaningless, for the unit is one of comparison only, and is not absolute. A value expressed in decibels must therefore be given a reference level. The reference level may not actually be specified, but the context must make the implied reference level free from confusion.
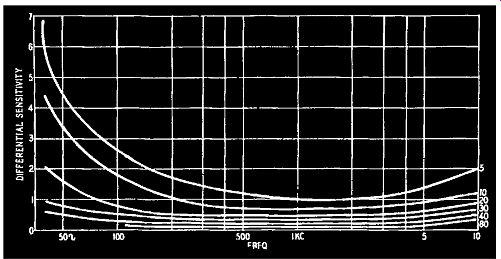
Fig. 103. Variation of frequency response of the ear at various volume
levels. The figures shown at the right-hand ends of the curves are in
db.
The intensity of a sound is a real physical quantity that can be defined and measured precisely. It has an objective existence whether anyone is listening to it or not. The loudness of the same sound is the effect it has on a listener and is therefore purely subjective, since it depends on the ear and the hearer's motor mechanism. Admittedly the effect of loudness, the magnitude of the sensation, is dependent on the primary intensity of the sound, but the loudness itself is not something that can be measured absolutely. It. must. be referred to some previous level existing in the hearer's mind. Weber postulates an original intensity; whatever the original intensity may be, an equal proportion of it must be added to produce a perceptible increase. The increase is perceived by the hearer as an increase in loudness, and the loudness is proportional to the logarithm of the intensity.
Ear response vs. volume level
Let us call the original intensity P1 (P representing power, for the intensity of a sound is power) and the increased intensity for perceptible increase P2. Then the loudness is proportional to log [P2/P1]. The bel is the unit of relationship between the two powers and is expressed as the common logarithm of the relationship.
The bel is an inconveniently large unit and is therefore usually divided into 10 decibels. Hence difference in level in db between two powers P1 and P2 equals 10 log 10 [P2/P1] With these definitions in mind a series of curves can be prepared showing the behavior of the ear towards sounds at different volume levels. These are shown in Fig. 103.
These curves show that the frequency response of the ear changes considerably for different volume levels. As could be seen from Fig. 102 the ear is most sensitive to frequencies of 2,000 to 3,000 hz and least sensitive to frequencies at the end of the scale. Fig. 103 shows, however, that this nonlinearity can be over come by increasing the level of the applied sounds. This argument only applies to pure tones, that is, sounds of sine wave form.
Phonic level
The relation between sensation level and intensity depends on the waveform of the sound. Generally, Sensation level [in db] = 10 log 10 X intensity [in microwatts per sq. cm.] If the intensity is such that 1 microwatt moves through 1 square centimeter, which is taken as the comparison intensity, then the sensation level (called the phonic level) is zero. This corresponds to the intensity on the ear drum if the pressure of the sound wave is 20 dynes per square centimeter. Reference to Fig. 102 shows that the ear has its widest frequency response at this pressure.
Fig. 103 shows that a phonic level of at least +30 db is necessary for the ear to act as a reasonably linear transducer of sounds.
It also shows how much the lower and higher frequencies have to be increased in intensity to give the same loudness sensation at different levels. This is shown for single pure tones. If they are musical sounds (complex waves) the level should be higher. There is also a range of level to consider.
In a concert hall the dynamic range of an orchestra is about 60 db; that of phonograph records is probably about 45 db and of a broadcasting station perhaps 30 db. A level of 30 db would, in a completely quiet listening room, permit adequate reproduction of a broadcast program but phonograph reproduction would re quire a 45 db level, which at the same time puts the ear into a better condition for high-grade listening. If there is background noise, the level must be set higher. Even so, it will be realized that during the quietest passages the ear itself distorts, but as this also happens in listening to an original performance one need not at tach undue importance to this consideration.
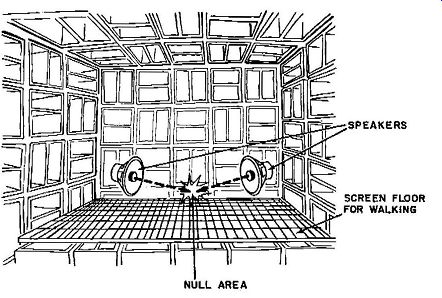
Fig. 104. Mutual interference of sound waves: a-(above) two speakers
working at the same level and frequency in an anechoic chamber; /1-{/,e/aw)
null areas produced by the times of a tuning fork.
Interference
The passage of one sound wave through the air does not affect the passage of other sound waves if the amplitude is small. If a particle of air is acted on by two sound waves, the resultant displacement of the particle is obtained by adding the separate displacements vectorially. If the two waves have the same frequency, have amplitudes a1 and a2, and are cf, 0 out of phase, the resultant amplitude= /a12
+ a22
+ 2a1a2 cos cf,.
If the two waves are in opposite phase, that is, if a1 is at greatest positive value when a2 is at greatest negative value, then cf,= 180°, cos cf,= -1, and the above expression reduces to a1 -a2. If the amplitudes of the two waves are equal, then the resultant amplitude becomes zero. In other words, two sound waves of equal frequency and amplitude but 180° out of phase produce no sound whatever. This phenomenon is called interference, and it can be demonstrated very easily with an ordinary tuning fork (Fig. 104-b). When the fork is struck both tines vibrate at the frequency for which the fork was designed, and while vibrating separate simultaneously and come together simultaneously. Assume the fork to be held vertically with the tines in a north-south axis. When the tines are separating pressure is exerted on the air in northerly and southerly directions creating sound waves travelling outwards; at these instants rarefaction of the air between the tines results in sound waves travelling inwards from east and west. These out going and incoming waves extend over spherical zones and on the axes dividing the angles between north-south and east-west they neutralize each other by mutual interference. If you strike the fork and twirl it near one ear you will hear, in each revolution of the fork, four points of maximum sound, four points of no sound, and intermediate waxing and waning of the sound output of the fork. Note particularly that the frequency of waxing and waning is entirely dependent on the speed of the rotation of the fork and has nothing to do with the frequency of the emitted sound.
It will be clear that as the interference is created because the fork has two sound sources, interference can be created by any other two sound sources suitably placed. Two speakers can be placed in a non-reflecting testing chamber, with their axes at an angle. Walking about in the chamber will indicate that at certain points the sound emitted by the two speakers (working at the same frequency and with the same output) is no longer audible. If the input to one of the speakers is reduced the null points will be at some other situations. Now drive one speaker in an ordinary reflective auditorium, such as an ordinary living room, and points where nothing can be heard are fairly numerous. In this case the second sound source is, of course, the reflections from the walls and ceiling (Fig. 104-a).
The formula given earlier for out-of-phase sound waves refers to the lag or lead of one wave with respect to the other (as in ordinary ac calculations) and the lag or lead is determined by the efficiency of the reflecting surface and its distance and angle with respect to the original sound source. The mathematical analysis is comparatively easy but measurements within the test chamber are rather difficult. The matter has been mentioned to explain standing waves, which are not waves at all but points of null displacement of the air.
Standing waves
Although the matter of standing waves does not come under the heading of perception of sound, being rather a problem in architectural acoustics, it will be obvious from what has been said that the interference points can be substantially modified by reducing or removing reflections from the walls of the listening room or auditorium. In an ordinary living room not very much can be done except by using carpets, curtains and drapes. Acoustic tiles, such as are used in properly designed non-echoing studios are some what costly, difficult to fix and liable to interfere with the domestic decor. Table 2 gives the relative absorption characteristics of various furnishing materials, the figures representing the amount of sound absorbed by the material. An open window obviously reflects nothing, so the figure of merit in this case is unity. All other materials reflect some of the sound, and a study of the table shows that they reflect a fairly high proportion. This accounts for the fantastically elaborate treatment required for anechoic chambers, where the reflection from the walls, floor and ceiling must be as near as possible non-existent.
Lace and nylon curtains are almost completely transparent to sound and so their presence or absence makes little difference to the properties of the windows or walls behind them. Drapes to be effective should be thick-velvet, cretonne, burlap (art jute) or similar substantial material. Wallpaper affects the properties of the wall material according to the thickness and texture: a thin glazed paper on an insulating panel would impair the absorption especially at higher frequencies; a thick rough-surfaced paper on plaster would increase absorption on a plaster wall. Rooms lined in wood can be treated only with drapes if the wood is used for decorative effect.
Although Table 2 is correct in giving relative absorption for some mean frequency, the absorption depends on the frequency, and absorption of very low frequencies is extremely difficult. Fig. 105 shows the absorption properties of various types of acoustic treatment related to frequency; the fact that the frequency scale is not extended below 125 hz is significant! Masking effect If the two sound waves considered here are not quite the same frequency, beats will be created. Assume at any given instant that the positive half-cycles are in synchronism (they will also be in phase); the maximum amplitude of air displacement is a1 + a2
At the next cycle of a1 the amplitude a2 will not be at its maximum; it will lag or lead a1 and the difference will increase until a whole cycle has been lost or gained on a1 . During this period the sound produced by the combined waves will change from a maximum to a minimum, and the periodicity of the beat will be the difference in frequency between the two waves.
If a certain amount of steady sound or noise is impressed on the ear, it is not so sensitive to other sounds-in the presence of noise the phonic level must be raised. If one sound is being heard and another is increased until the first can no longer be heard, the second is said to mask the first. Comprehensive tests were carried out by Bell Telephone Laboratories many years ago, since the matter is important in applied acoustics, and it was found that, whereas a sound of low frequency had to be raised to a high intensity to mask a high-frequency sound, it is easy to mask a sound by one of slightly higher frequency.
--------------------
Table 2-Absorption properties of the more common furnishing materials within the approximate band of 500 to 1,000 HZ Open window .. . .
. . . 1.00
Audiences ......... 0.96 to 0.44
Felt 1-inch thick, ranging from needle-loom to piano 0.8 to 0.5
Cork 1½-inches thick ............ .. 0.32
Insulating boards, such as ½-inch sugar-cane fiber .... 0.7 to 0.25
Rugs and carpets of various thicknesses ....... 0.3 to 0.2
Velvet curtains ............... 0.25 to 0.2
Cretonne curtains . . 0.15
Linoleum .. ... . .. . 0.12
Pine boards. .. 0.06
Plaster_ on laths . 0.034
Glass .............. 0.027
Bricks and hardwall plaster ........ 0.025
Cheesecloth and similar materials ............... 0.025 and less
------------------------
1. Acousti-Celotex (cane fiber) 1 ¼" thick.
2. "Unitone" Acoustic Tile, 3/8" thick.
3. Celotex Absorbex (cement-wood fiber) 1" thick.
4. Asbestos Acoustic Tile with 1" rock-wool backing.
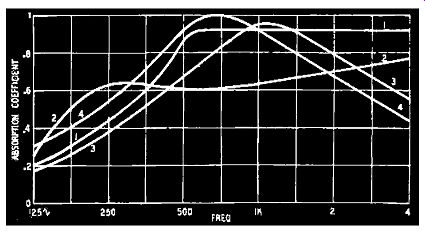
Fig. 105. Absorption properties as related to frequency.
Fig. 106 gives the masking effects of a 400- hz sound on those of other frequencies. Keeping the intensity of the masking sound constant; the threshold shift denotes the amount the masked sound has to be raised above its normal threshold value to be just audible. For example, a 400- hz sound has to be increased 60 db before it begins to mask a 4,000- hz one. But, as the frequency of the latter falls toward that of the masking sound, the masking effect increases substantially. The fact that the curves cross one another shows that, in case of a complex wave, the ear will hear different harmonics as the intensity is increased.
Combination or subjective tones If sounds are loud and sustained, combination or subjective tones are formed. One, at a frequency equal to the difference be tween the component frequencies, is called the differential tone; another has a frequency which is the sum of the component frequencies and is called the summation tone. Subjective tones can arise from only one sound wave. At 1,000 hz the second harmonic can be heard at a sensation level of about 50 db; the third, fourth and fifth will be added if the level is raised to 80 db.
If, now, two loud and sustained notes of frequencies f1 and f2 are sounded together, the fundamentals will form subjective tones with each other and with the harmonics:
f1, f.L + f. L -f• 2f1, 2~, 2L + f. 2L - f~ 2~ + f1, 2f2 - f1, 2f1 + 2f2, 2f1 - 2f2, 3f1, 3f2 and so on.
If the two sounds are complex, the number of subjective tones will be very great. Some of these sounds will be masked by others, so reducing the total audible number which, in any event, is a function of the sound level. See Table 3.
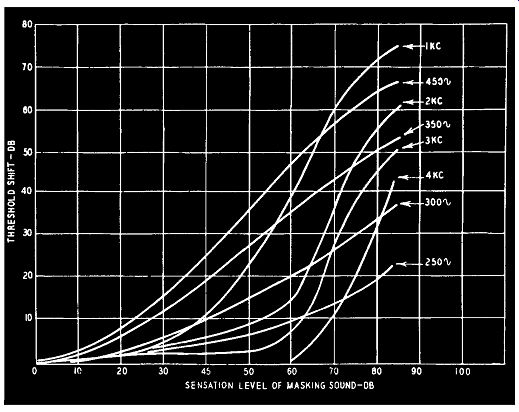
Fig. 106. Masking effect of a 400- hz sound on those of other frequencies.
Reaction of the ear to complex sounds If a filter is used to remove the fundamental of a complex sound, the differential tone that is created by the harmonics will become audible at the fundamental frequency. A commonly met filter of this type will be encountered in the average loud speaker which cannot reproduce fundamental frequencies at any significant volume below its bass resonant frequency. This does not mean to imply that a loudspeaker without bass resonance is unnecessary for obtaining the best results. There is an audible difference between the aurally reconstructed fundamental bass frequencies and the true bass frequencies that are actually emitted by a loudspeaker.
Suppose a musical instrument sounds a note having a fundamental frequency of 50 hz, with harmonics at 100, 150, 200 and so on. Considering only the fundamental and second harmonic, a differential tone will be formed at 50 hz and a summation tone at 150 hz, so the fundamental and third harmonic will be boosted.
If the speaker cannot reproduce the 50 hz fundamental, the reproduced series will be 100, 150, etc. which will produce a differential tone of 50 and a summation tone of 250. This gives a series of 50, 100, 150, 200, 250, but the fifth harmonic has been boosted and the original fundamental is only a differential tone from two harmonics. If amplitudes are large, the divergence from reality becomes very great.
At the top end of the frequency spectrum a similar argument applies. Even if the ear could not hear frequencies above 12,000 cycles, it can hear differential tones below 12,000 created by frequencies higher than this. If these unheard frequencies exist in the original performance, the ear will hear the differential tones,; if they are cut out by the reproducing equipment, what the ear hears below 12,000 hz is not what it would hear at the original performance, Basic requirements for fidelity of reproduction It will now be clear that mere width of frequency response is not enough for high-grade sound reproduction. The frequency response of the reproducing system must also be level. If it is not, peaks and valleys in the response curve will result in nonuniform amplification of both fundamentals and harmonics. The performance of the ear is erratic, even if it conforms to certain general laws, and it is clearly undesirable to complicate the problem further by introducing or failing to eliminate defects in the equipment.
Perfect reproduction of an original performance in an auditorium cannot be achieved in the home. The esthetically equipped expert can only strive to provide a standard which is musically satisfying. This phrase is introduced deliberately because, when science has done its best, the ear itself is the final arbiter and, when the engineer has designed as well as his technique will allow, he must then apply the principles of musical criticism to what he has accomplished.
------------
Table 3-Effect of a bass filter cutting off fundamental frequency
Subjective tone A B
f1 50 100 f2 100 150 f1 + f2 150 250 f1 - f2 50 50 2f1 100 200 2f2 200 300 2f1 + f2 200 350 2f1 f2 0 50 2f2 + f1 250 400 2f2 f1 150 200 2£1 + 2f2 300 500 2f, - 2f2 100
100 3f1 150 300 3f2 300 450 3f1 + f2 250 450 3f1 - f2 50 150 and so on.
A: subjective tones formed by 50 hz fundamental and second harmonic.
B: subjective tones formed by second and third harmonics.
------------
This being a technical data book, no information is given on musical appreciation beyond the obvious advice that the engineer should make himself thoroughly acquainted with the sounds of musical instruments at firsthand. As a technical worker he should heed the following basic requirements of high-quality reproduction:
1) The overall frequency response of an amplifier should be as wide as the economics of design will permit.
2) Within the predetermined limits of response there should be no audible distortion of any type.
3) The mean level of sound output must be adjusted to enable the ear to function as nearly as possible as a linear transducer.
So far as the first two are concerned, the requirements can be met when designing the amplifier but are not easy to secure from the loudspeaker. Most engineers are compelled to use speakers designed by some other person and all speakers have more or less serious defects. The speaker and its housing should not have a bass resonance and should he free from peaks and valleys in the response curve. Peaks in the region 2,500 to 15,000 hz are particularly objectionable in that they give rise to harsh and "brittle" reproduction. If a suitable speaker cannot be found, it is better to restrict the overall width of response than to provide opportunity for the speaker to demonstrate its defects. The result will not be fidelity but it will be more acceptable to a musically-minded listener.
So far as the third requirement is concerned, tone-compensated volume controls will neutralize, to some extent, the nonlinearity of the ear at very low and very high phonic levels, but even this is affected by the size and nature of the listening room.
The listening room
Generally speaking, nothing very much can be done in the way of altering the shape or size of a room. The room is there and has to be used, but a great deal can be done to improve its existing acoustical properties. This has to be considered from two points of view-elimination of external noise which would interfere with enjoyment of the music, and modification of the internal reflections and reverberation.
Reflection has been dealt with in Table 2; reverberation should be mentioned as something like an echo which causes the sound to continue after the sound source has ceased to emit sound.
Reflection in rooms being constant, the larger the room the longer the reverberation; the more reflective the room the more intense the reverberation. There was the well known lecture room at Harvard University which had a reverberation period of 5.5 seconds for the human voice. Even a slow speaker utters several syllables in this time and the result was an unintelligible jumble of sounds if the room was not full of people. Somewhat primitive treatment helped considerably-putting cushions on the seats to help absorption when the audience was small. Today proper acoustic treatment would get over the difficulty. On the other hand there is a celebrated case in London of a subway tunnel leading to the Science Museum. The reverberation period in this glazed-brick-lined tunnel about 200 yards long is something like 15 to 20 seconds, and has always been a source of amusement for bellowing schoolboys doing a museum jaunt. Nothing can be done, for the proportions of the "room" are hopeless. Fortunately we do not have to listen to our music in subway tunnels, and the ordinary domestic living room can be treated with a considerable measure of success.
Unfortunately, if the music room is the listening room, the piano will have to go somewhere else. It is a strongly resonant device, with tuned resonances over the whole compass. Even vases and other room ornaments can give rise to resonances. A completely dead room would be lifeless for high-quality reproduction, since "attack" is needed as well as overall frequency response, but undue reflection causes standing waves and reverberation. Unglazed boo kcases fairly full of books are good sound absorbers; if glazed, their absorption becomes that of glass. Un-upholstered furniture can be assumed to have the same acoustic absorption as pine boards in Table 2. The thick heavy easy chair is better acoustically than modern functional designs. A fitted carpet is more effective than a polished floor with rugs. Un-curtained picture windows are very nearly hopeless. Uncased radiators and heating panels can be very troublesome.
If it is desired to fit acoustic tiles to an otherwise highly reflective wall, the tiles should not be fastened directly to the wall.
Wood battens an inch thick should first be applied and the space between the battens filled with Fiberglas or rock wool; then the tiles are applied to cover the whole area. But whether acoustic tiles are used or not, it will pay to give some attention to corners, especially the angles between walls and ceiling. It is not unusual to have the ceiling join the walls with a "cove," a concave plaster surface. This will focus sound as a concave reflector in a car head lamp focuses the light from the bulb. If treatment of the room angles is undertaken, the use of convex corner fillers will help dispersion of the sound to a great extent. In broadcasting studios movable flat or convex reflectors are used to modify the characteristics to suit the program, but these refinements are not necessary for home listening. But angles should be given a convex contour for the best results.
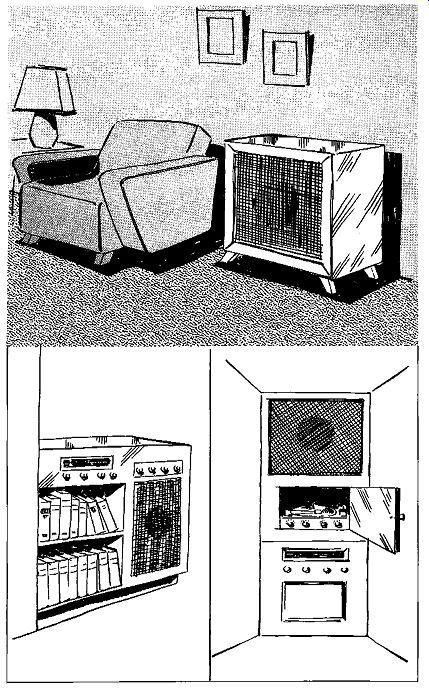
Fig. 107. The speaker is .sometimes housed in its own cabinet or is
made to form an integral unit with the rest of the system.
Speaker position
The position of the speaker is very important. Unless mounted in a corner horn, it does not follow that a corner is the best position. Nor, on the other hand, is it likely that a speaker mounted in a closed box forming part of an audio montage across a whole wall will be successful. The present writer may have earned a reputation for being different and difficult, but he feels that an audio system is something which should be tucked away out of sight. A record player and a control box must be conveniently at hand, but they need be no larger than necessary. The speaker and its enclosure have to be heard and obviously should be placed where they sound best, and this does not bear any relationship to the most convenient place for operating the music source. If the speaker has a very good bass response, the audio montage (if part of the speaker cabinet) will be unusable for no turntable spring mounting appears able to insulate the record and pickup from the vibration set up by a speaker in the same housing. A high fidelity audio system is something to be heard, not seen, and the more that can be put away out of sight the better. This then demands that the speaker should be a separate unit, and being a separate unit it can be placed where it sounds best.
Figs. 107 and 108 illustrate a few of the many arrangements being used and not endorsed by the author.
Multichannel speaker systems In a multichannel speaker system it is logical to assume that speaker diaphragms should be of similar material and in any event not metallic, which everybody knows has a ringing quality; our diaphragms should be as inert as possible. ·what is just as important is the spatial relationship of the two or more diaphragms.
If you set up two identical speakers some distance apart and drive them with the same signal you will get quite an impressive imitation of stereophonic reproduction. It is not true stereophony since only one channel is used, but the effect is noticeable as long as you are not equidistant from the two speakers. This effect is most noticeable when, if the two speakers are in the two corners at the ends of one wall, you sit near an adjacent wall.
The effect is due to the sound from one speaker being out-of phase, to some extent, with respect to the other, since the sound takes a little longer to travel from the more distant speaker. The two outputs are combined in the human hearing mechanism to create an illusion of depth; but the effect will only be obtained if the two speakers reproduce the whole frequency range. If one of the speakers is a tweeter and the other a woofer, all you hear are the two separate outputs, the treble coming from one corner, the bass from the other, no matter where you are sitting in the room.
It follows, therefore, that a tweeter-woofer combination must be so disposed that the two sound sources are as close together as possible. Ideally, they should coincide, which accounts for the development of coaxial speakers.
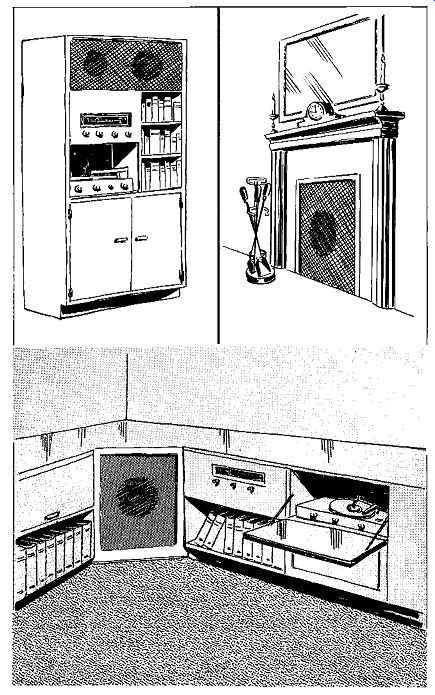
Fig. 108. The illustration on the facing page shows a number of possible
ways of positioning speakers. (These arrangements are not endorsed by
the author.)
I believe that the best way of laying out a dual range speaker is to have each unit horn loaded, so as to avoid interaction between the two units (horns being much more directional at the sound source), and if the tweeter horn can be curved into the mouth of the woofer horn, coaxiality is achieved.